

Robert H
-
Content Count
717 -
Joined
-
Last visited
-
Days Won
94
Posts posted by Robert H
-
-
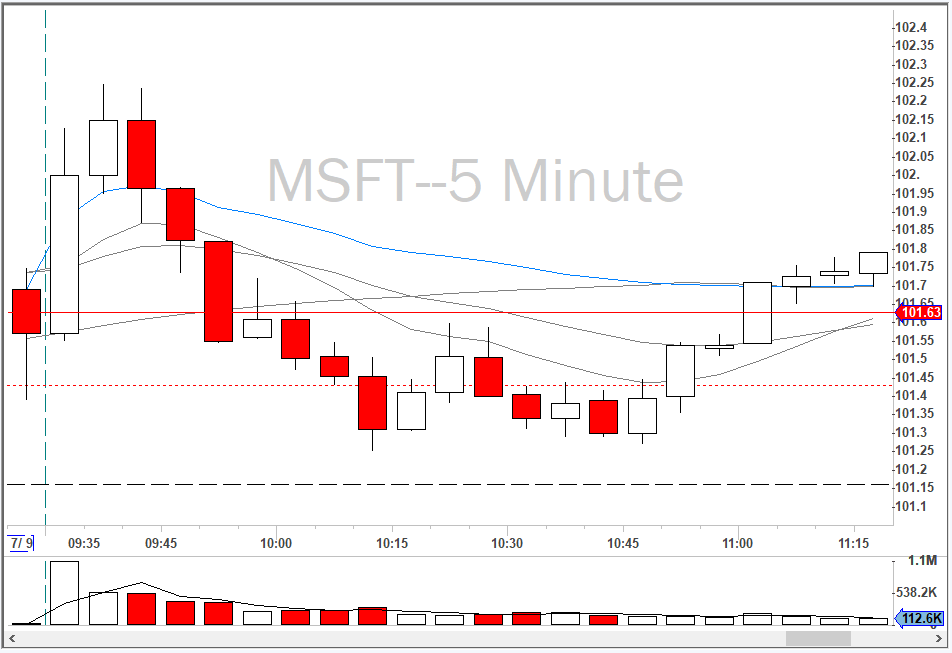
Not 100% Engulfing, still Cracked though

-
$MSFT was a good example of this strategy today. Marcel Andre called it!
-
I've never used the cancel hotkey/button. I know that pressing the PANIC hotkey once closes all open orders (if any exist), and pressing it a 2nd time closes all open positions.
Play around with the PANIC command and see if it can be combined into one hotkey. Might just work.
-
Hey B,
Most likely an after hours issue. Someone else mentioned a problem with a STOP order in pre-market.
SM means Stop Market. The Price column is irrelevant--it just shows what the current price was when you sent the STOP order. The open order triangle on the chart will also be placed at the time/price of when you sent the STOP order (useless info, I know.)
So, SM:50.1603 means there is a STOP MARKET order which will trigger at 50.16.
-
Check out the video in Members Area > Premium Resources: https://www.bearbulltraders.com/advanced-lesson-bearish-engulfing-crack-strategy/
Saw the setup twice today. Once on $BABA (semi-successful back to VWAP but just too choppy), and $MU (failed).
I believe one factor that gives the move such downward momentum is that stops are being taken out on the 5-min chart (close of prior white candle), and 1-minute chart (loss of the 9 EMA).
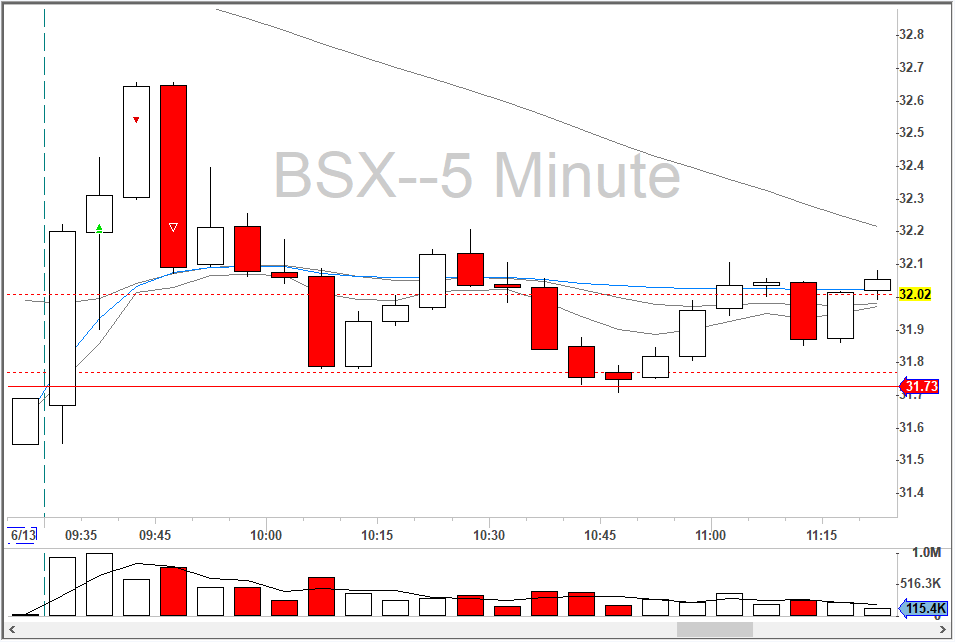
I was actually on the opposite end of a Bearish Engulfing Crack once. Went long $BSX on an Opening Range Breakup and was stopped out during the flush.
-
 3
3
-
 2
2
-
-
10 hours ago, Avinash said:Thanks, Robert, this link (https://forums.bearbulltraders.com/topic/buy-sell-hotkeys/) that you mentioned seems to be broken. Can you please fix it?
Done

-
33 minutes ago, onosendi said:Robert,
I believe I saw in another post that you use Tradervue as well? I started tagging NYSE stocks for this reason. An easy filter of the "NYSE" tag shows them all. Some of my biggest losers are NYSE stocks

I don't use Tradervue; I'm using a custom journal in Excel.
Great idea to tag NYSE stocks, though! I can't say that I've lost more money on them. In fact, some of my biggest winners have been trades on $PBR, $CAG, etc. when they were in play. I think the key is to watch the price action and order flow in the first 5-10 minutes. On certain days/catalysts, they can move indistinguishable from NASDAQs.
-
1
-
-
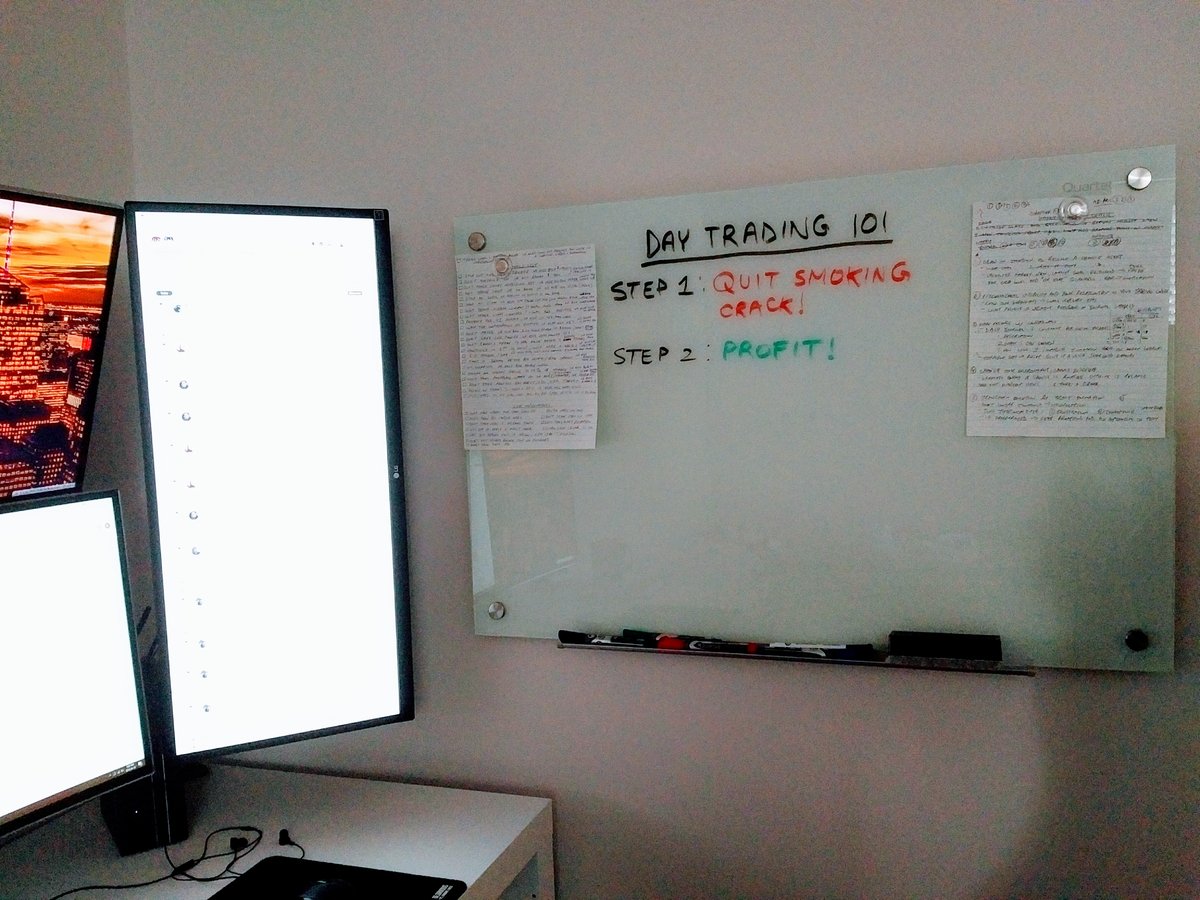
Home Improvement: whiteboard installed on first attempt! Thanks @Carlos M. for the idea and inspiration!
-
2
-
 2
2
-
-
This is a problem all traders face--beginner and advanced. Even Andrew and Brian mentioned this in the Lifetime Webinar. We go into a trade looking for 2:1 risk/reward, and end up coming out with 1:1 after scaling out. Our losers are almost always -1:1, if not greater. This means that with 50% accuracy, we break-even over the long-term despite claiming to take trades with a minimum of 2:1 risk/reward!
My journal tracks some key stats to see how well I'm taking profit compared to the risk I take. The required variables are:
- Number of shares
- Entry price
- Stop price
- Target price
- Max loss = (Stop - Entry) x Shares
- R-Target, aka Target Risk-Reward = (Entry - Target)/(Stop - Entry)
- R-Real, aka Realized Risk-Reward = P&L/Max loss
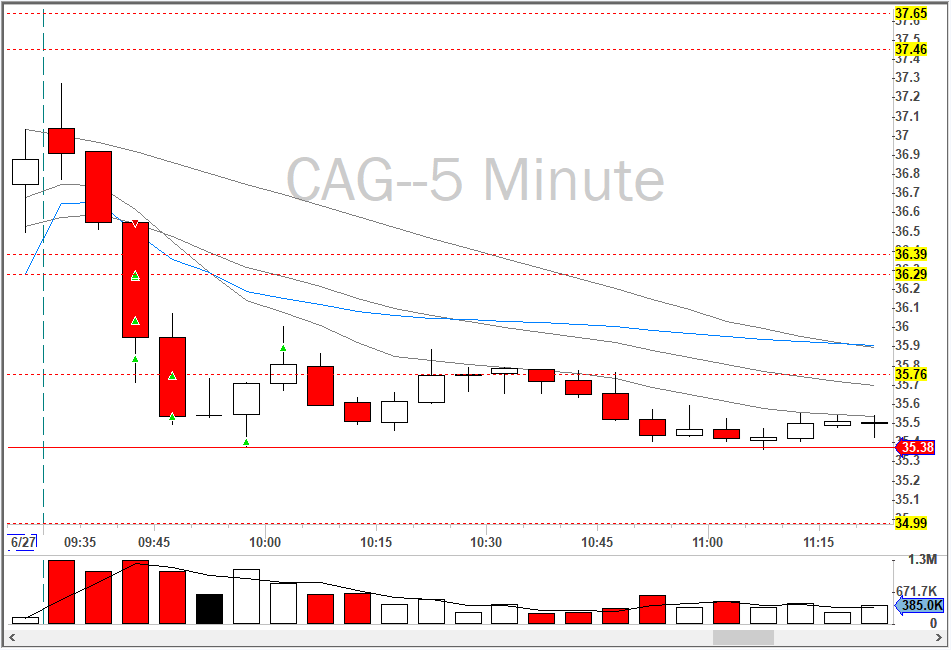
Let's use my $CAG trade from June 27 as an example of a good outcome.
I entered the trade looking for a 4:1 risk/reward (R-Target). Based on how I scaled out (in 6 steps), I managed to come out with an R-Real of 2.9. This is the type of patient profit taking you want to see over the long-term.
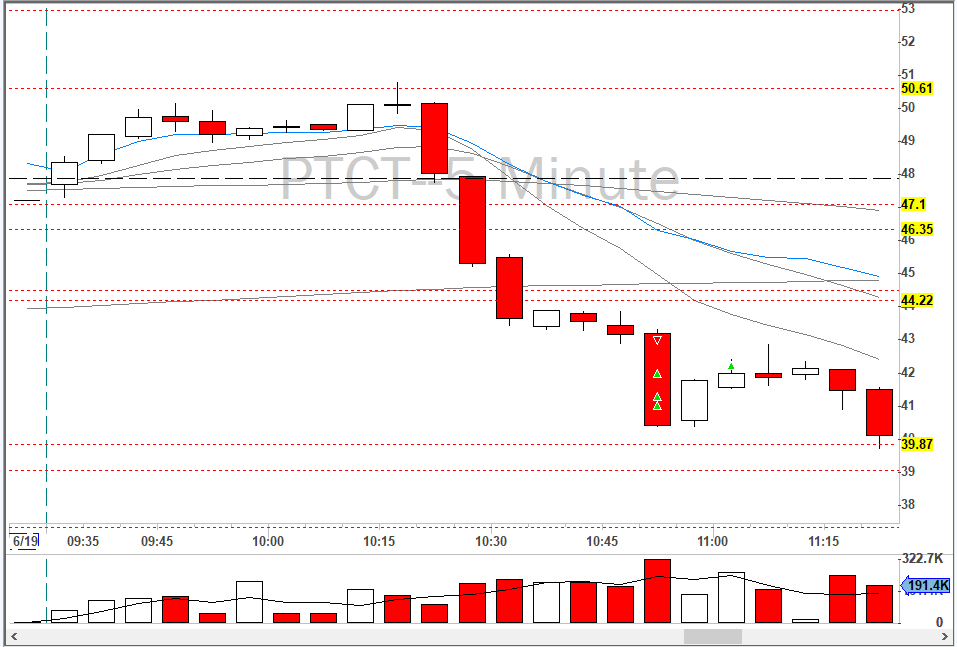
Entry 36.52 Shares 800 Stop 36.7 Target 35.75 R-Target 4.3 Max loss 144.00 P&L 412.78 R-Real 2.9 Now here is an example of a winning trade where the R-Real is less than half of the R-Target.
Despite being a winner, the realized risk/reward was actually less than 1. Statistically, taking trades like this over the long term would result in losing money.
Entry 42.87 Shares 100 Stop 44 Target 40 R-Target 2.5 Max loss 113.00 P&L 97.34 R-Real 0.9 I've been consciously trying to improve my long term average R-Real by taking profit more patiently. Similar to Carlos' advice above: (1) take first partial after a 0.30-0.40 (2) patiently take profit at original targets (3) keep the last 10-20% for as long as possible. This has helped bump up my R-Real, but it is nowhere near 2.0. As of right now, it is a mere 1.1 after 450+ live trades. My losing R-Real is -0.9. Both numbers are improving, but it takes a lot of practice. Improving accuracy of winning trades is another solution to this problem. If you can be right 65-70% of the time, then you can afford to have an R-Real of 1.0 and still be profitable.
-
4
-
-
T = Trading resumed
SSR = Short Sale Restriction
S = Shortable
5C = 5-cent tick programYour hotkey needs to be at least +/- 0.05 to trade a 5-cent tick program (since bid/ask are in 0.05 increments).
-
1
-
-
13 minutes ago, glovtrader said:Is there any way to load your desktop from the simulator into your Speedtrader account? When I try, I am getting an error message and it shuts the Speedtrader software down?
I don't think so. There are compatibility issues. Please e-mail me and I will send you a SpeedTrader layout to get you started.
-
You're right. You can just set the # at the end of the trading day. At midnight it will reset to that value (no change). Give it a shot tonight and let us know.
-
DAS automatically resets your trade log/indicators and account at midnight EST, daily. The only workaround I can think of is for you to remember the account balance at the end of each day and set it to that the next morning. See here:
-
Per trade means per ticket (execution). Unfilled orders don't count.
-
3 minutes ago, Dread7 said:When you get in with SpeedTrader make sure to update immediately as they give you a really old version to install and the desktop you develop in the sim will not work if you don't.
Also note that their included "sim paper account" will constantly default back to the real account in the montages. While you can use it don't screw around. Make trades like your account depends on it because you may look down and find it does.
Can't you just change the default account in Global Order Templates (same as standard DAS)?
-
23 minutes ago, fores321 said:Hi all, Want to fill you in on a bad experience with DAS trader.
I recently went with das trader pro setup with IB, but after a week of trial, on both sim and real time trading, I found Das was not executing correctly. Sometimes my orders wouldnt even go through with my smartkeys set-up. Other times, duplicate orders would go through instead of a buy canceling out my short position for example.
I dont trust them with my money anymore, and WOULD NOT recommend DAS PRO.
This is the first I've heard of such issues. Have you tried another keyboard? What kind of computer are you using? It's really surprising considering that hundreds--if not thousands--of our members have used DAS hotkeys successfully.
Have you reached out to DAS Support? As a paying subscriber, you are entitled to a 1-hour free session with their Tech Specialist to ensure your system is running smoothly. Best of luck!
-
If I can't even use a tape measure correctly!
I spent the day installing a wall mount for a 29" ultrawide monitor which will be orientated in portrait mode. I calculated 46 cm above the desk as the centered height, but for some reason went to measure 41 cm on the wall. I quadruple-checked the 41 cm before drilling and off we went.
Monitor goes on the mount and... it's too low by exactly 5 cm. Going to redo tomorrow

-
1
-
-
Aiman is correct. Here is an answer I provided to another member:
QuoteDaily charts are useful for us since other market participants (day traders, swing traders, institutions, hedge funds, etc.) look at levels from the past. As day traders, we are interested in the support/resistance levels where the price bounces or is tested on multiple occasions.
Check out Class 2 where Andrew explains this.
-
1
-
-
Brian Trade Recap of $MIK
-
31 minutes ago, idosunmu said:Link to hotkey is not working
Fixed.
-
That's amazing!
I wonder if you can expand on the script and use the same stop price to send a STOP order? So basically, you double-click to set the stop price and hit the hotkey which sends an entry order along with a stop order.
-
Does this script allow you to buy $125 worth of a stock (i.,e 5 shares x$25), or does it allow you to risk $125 max based on a stop price?
-
Brian Trade Recap of $HRB
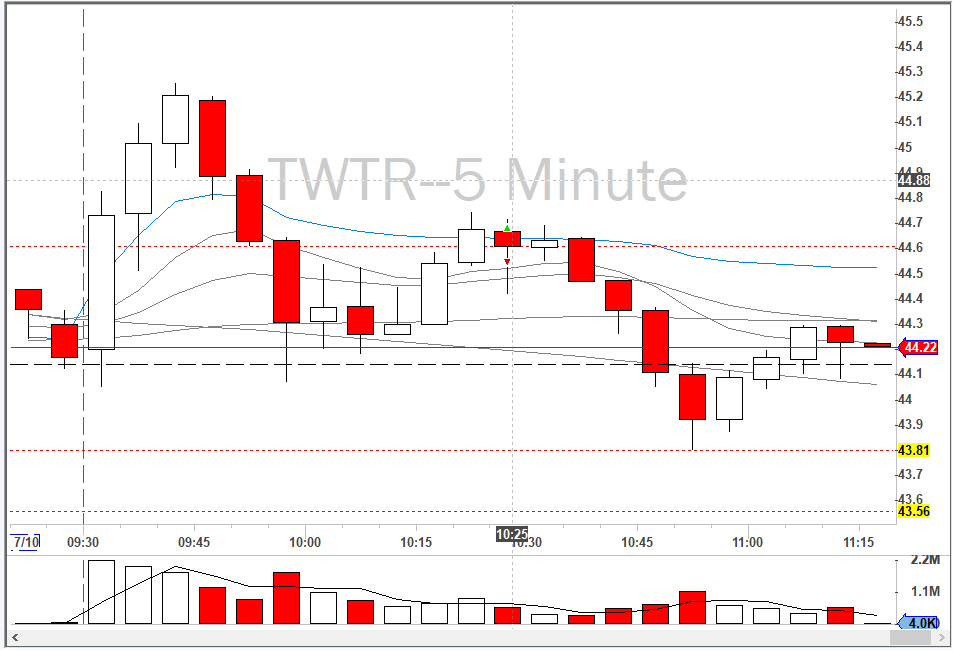

Bearish Engulfing Crack Strategy
in Day Trading Strategies
Posted
Took $TWTR on Bearish Engulfing Crack but was stopped out on first try. Went back in for second attempt and rode momentum to low of the day (LOD).