

Robert H
-
Content Count
717 -
Joined
-
Last visited
-
Days Won
94
Posts posted by Robert H
-
-
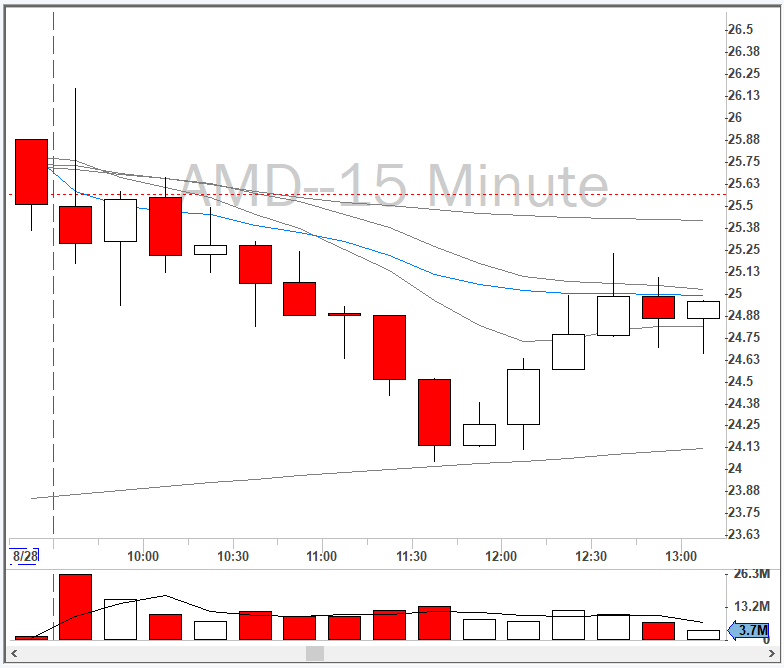
$AMD Aug 28, 2018: Bounce off MA support and reversal to VWAP
15-min chart shows clear bottom and new 15-min high.

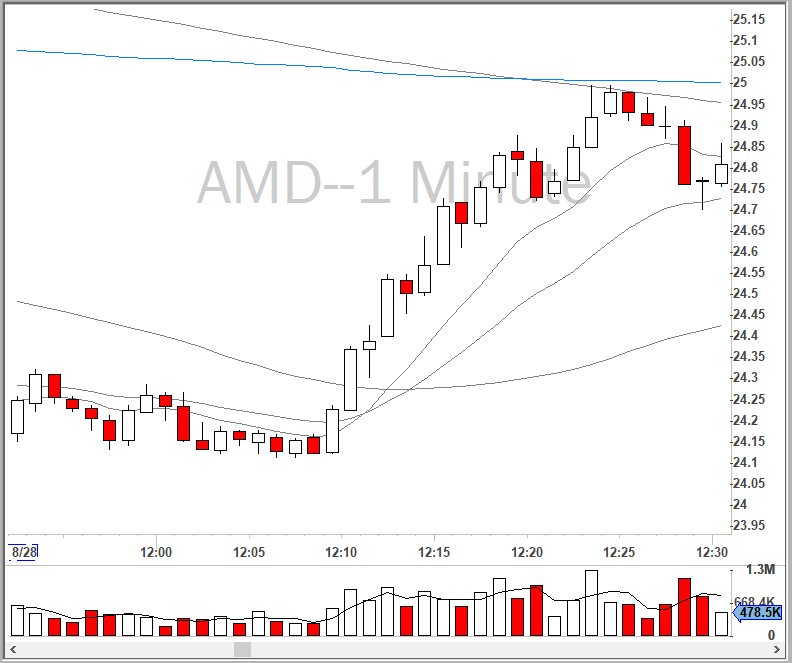
5-min chart new high made at 12:10 PM.
1-min chart 9 and 20 EMA cross over and above the 50 SMA.
-
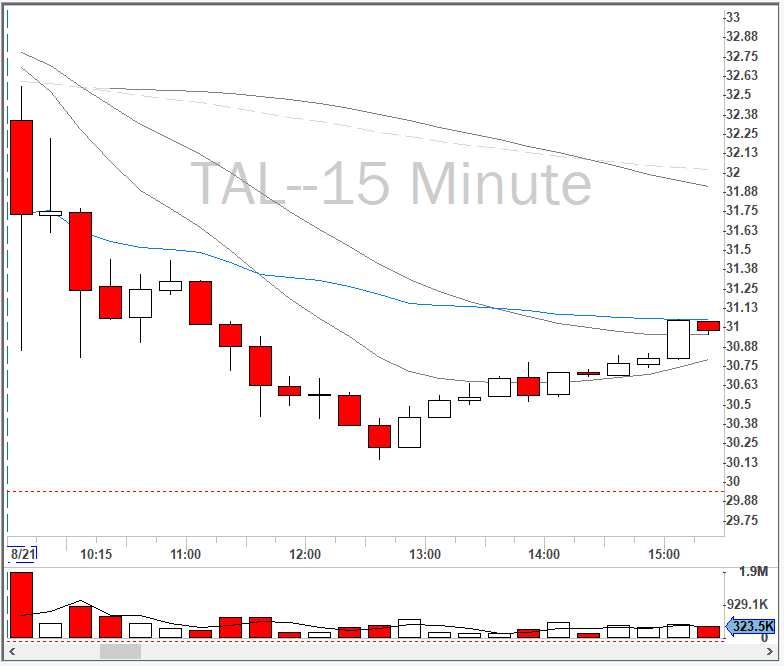
$TAL - Aug 21, 2018: 15-Minute Reversal to VWAP
15-min chart engulfing candle. No new 15-min low, but a new 15-min high.
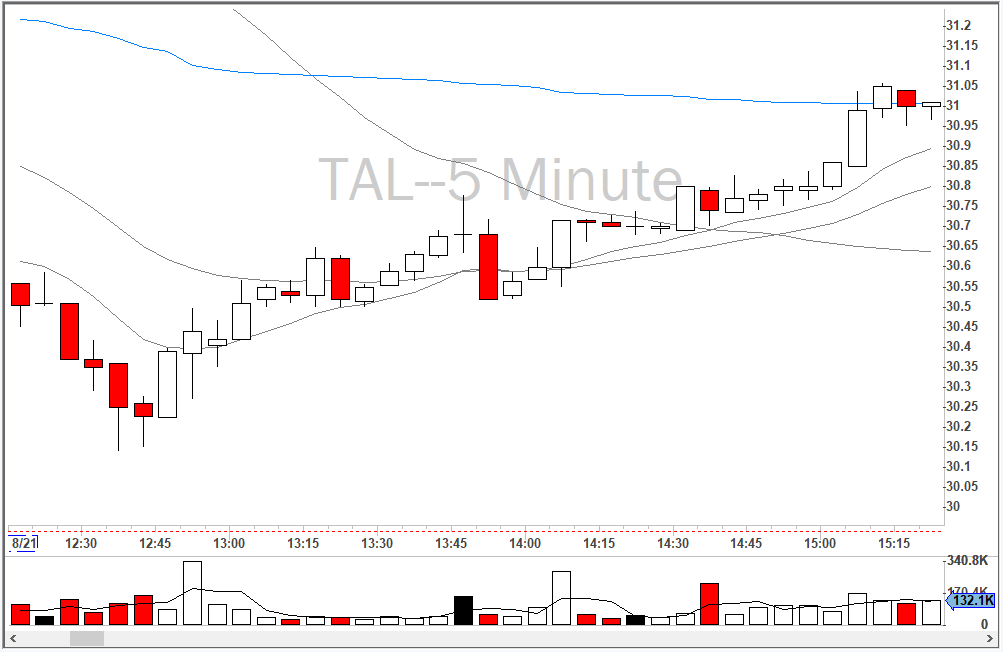
5-min chart clean run to VWAP.
-
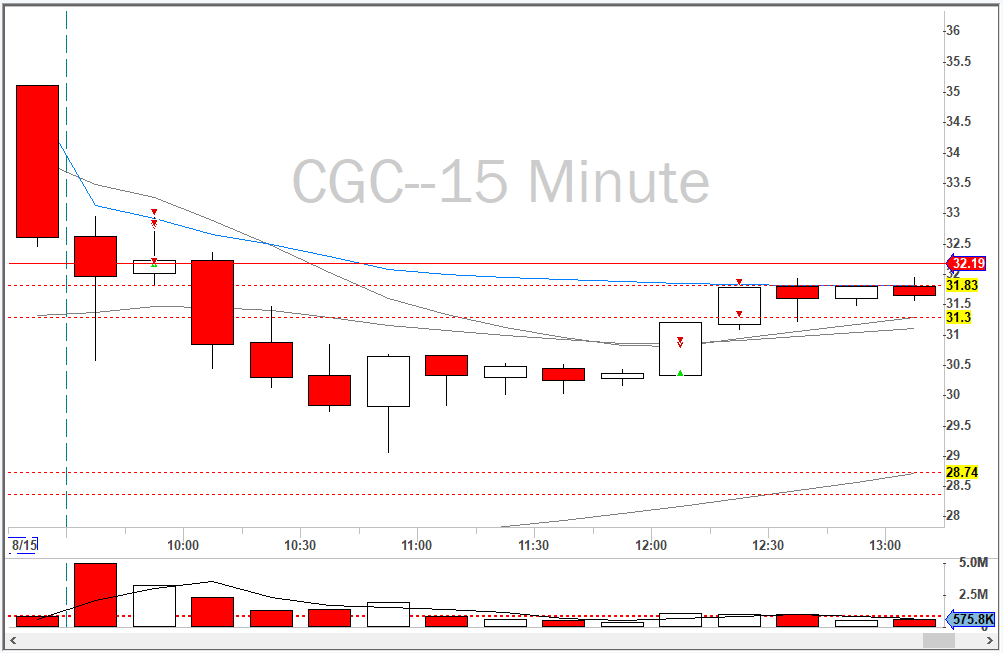
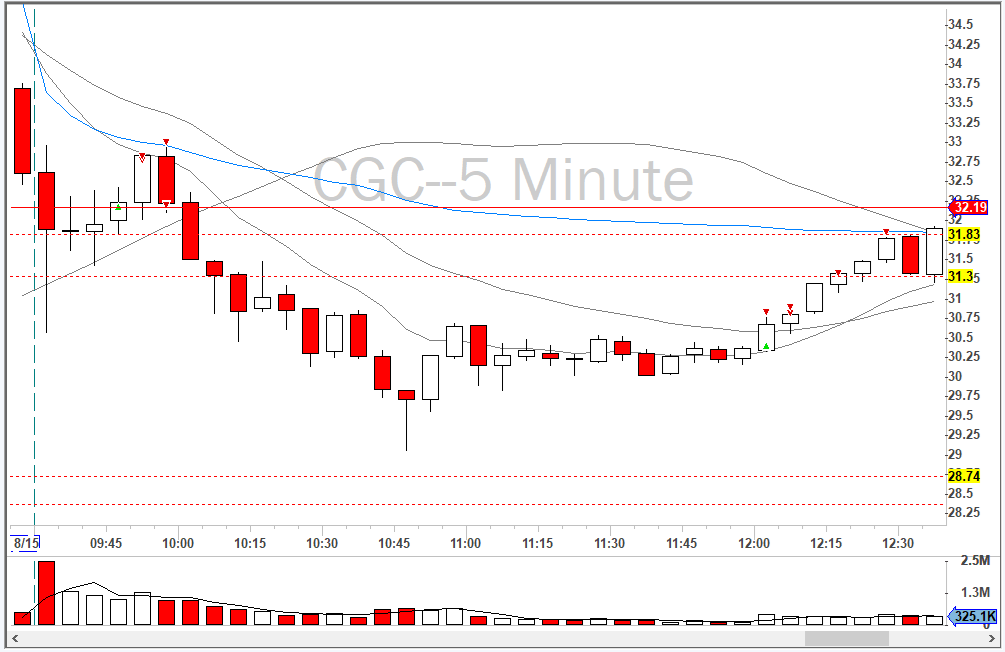
$CGC - Aug 15, 2018: Booty Reversal Breakout
15-min chart couldn't make new low. Wedge formation consolidates to a point then breaks out.
New 5-min high is a popup candle and then runs to VWAP.
-
I don't use any special hotkey to short SSR. As @onosendimentioned, the order sits as pending until an uptick. If the price goes below 0.05 of what the ASK was, then I don't get filled. I have to cancel and try again.
I've been skipped probably 5-10 times in the past 6 months.
-
Not that I'm aware of.
-
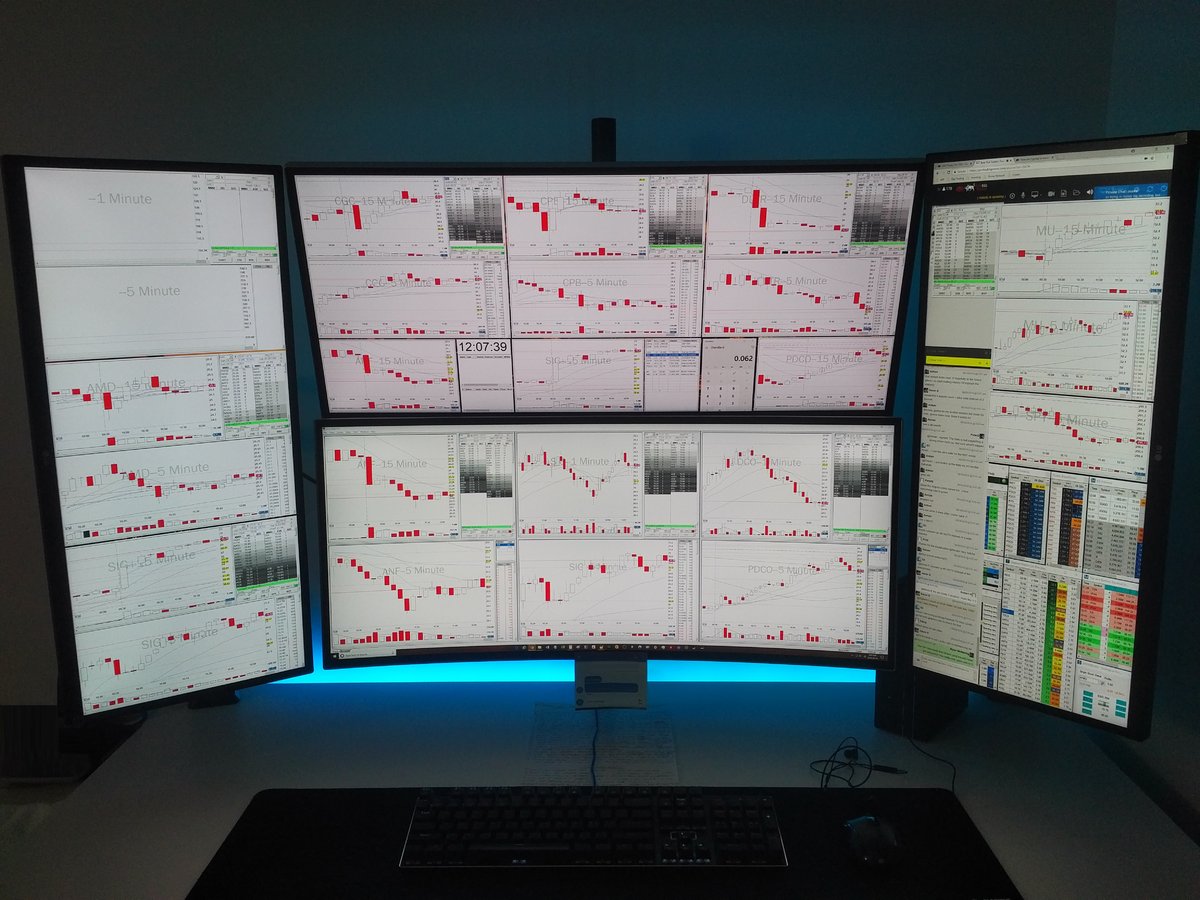
Got another monitor to balance out the setup. Not perfectly aligned, but I can live with it.
-
 1
1
-
-
I shared my thoughts on the classic ABCD/Flag strategy. This pattern presents itself in virtually every move, across multiple timeframes. The formation consists of:
1. Run-up/sell-off
2. Profit taking/consolidation
3. Continuation
Let me know your thoughts!
-
12
-
 3
3
-
-
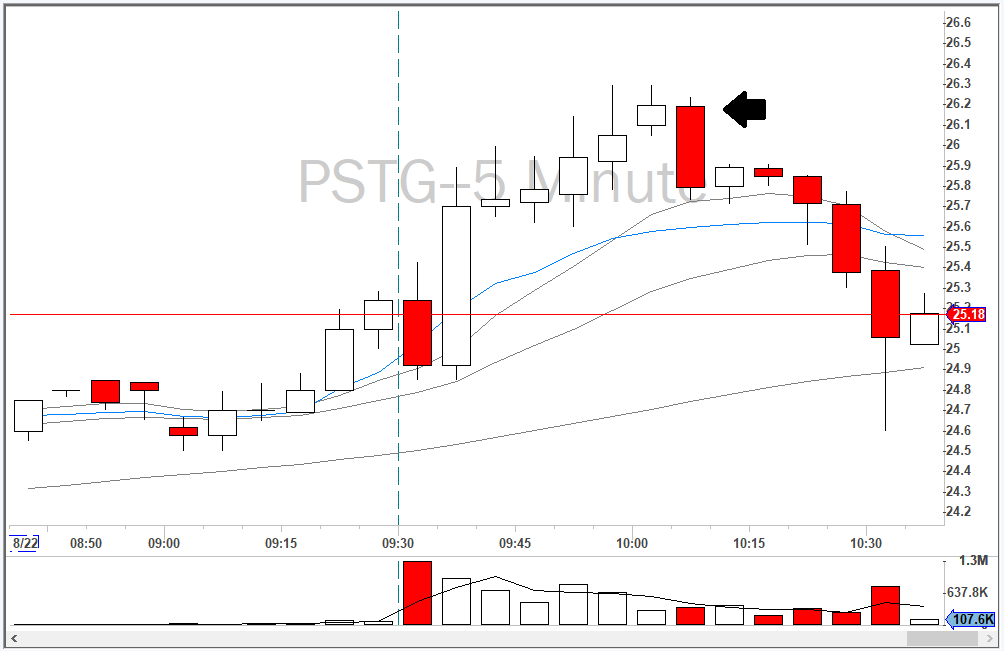
$PSTG somewhat of an engulfing crack. Made it to LOD.
-
Thanks for checking.
Yeah, a horizontal line that I've drawn. Sometimes I can't select it at all.
-
Interesting. Has anyone tried uninstalling .31 completely and then reinstalling .21 from the download link? Wonder if new features still exist. Could be possible that DAS messed up the install packages. Highly unlikely, but possible.
Is anyone else experiencing the issue where you are unable to remove a horizontal line? Clicking it does nothing; it's being treated like a Price Marker line.
-
Probably hidden behind other windows. Go to menu Windows > Accounts. It might be listed in Other Windows.
If not, go to File > Clear Desktop and see if you can open a new Accounts window.
-
You need to right-click from the Account window, not Account Report window (Trade > Accounts).
-
1
-
-
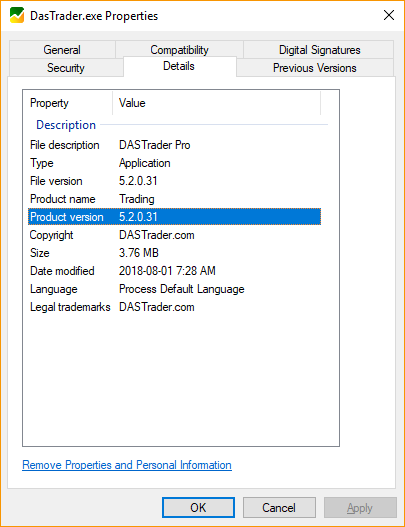
I suspect that installing .21 over .31 overwrites some files, but not others. This leads to the program incorrectly reporting the version number. In the DAS Trader Pro folder, right-click DasTrader.exe > Properties > Details. The true executable version should be displayed:
As with any software, the cleanest approach is to uninstall, restart, then install. This method ensures that all files and registry entries are removed and reduces the risk of corruption.
-
4 hours ago, True said:I appreciate you continually posting these. I feel like repeatedly seeing different examples really helps reinforce the idea. Thank you.
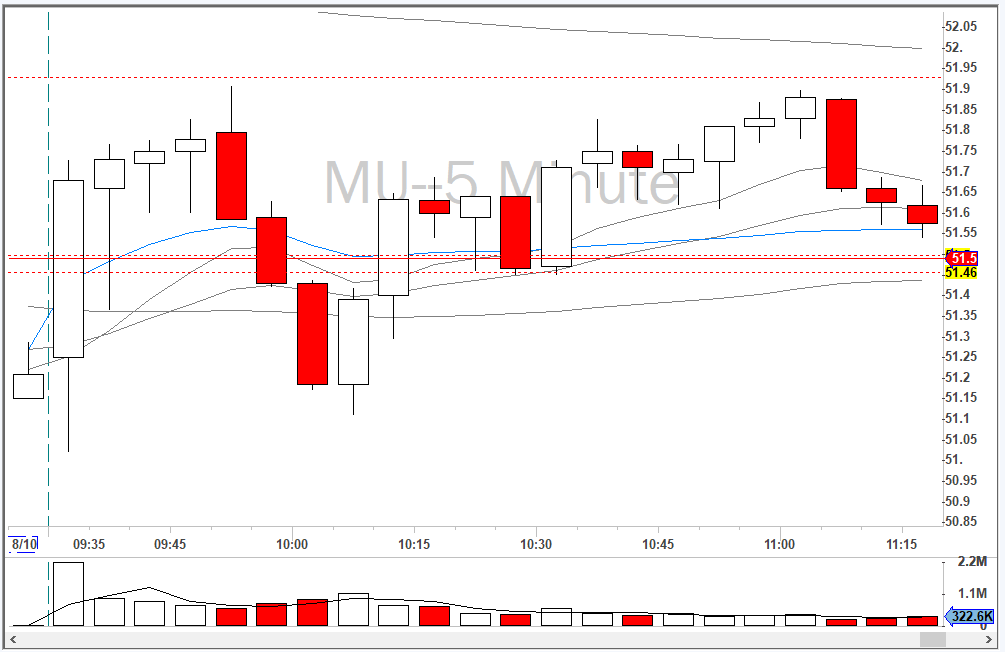
There are literally dozens of these setups everyday. I saw it on EGN, MU, CRZO, CGC, and M to name a few.
I invite all members to add to this post!
-
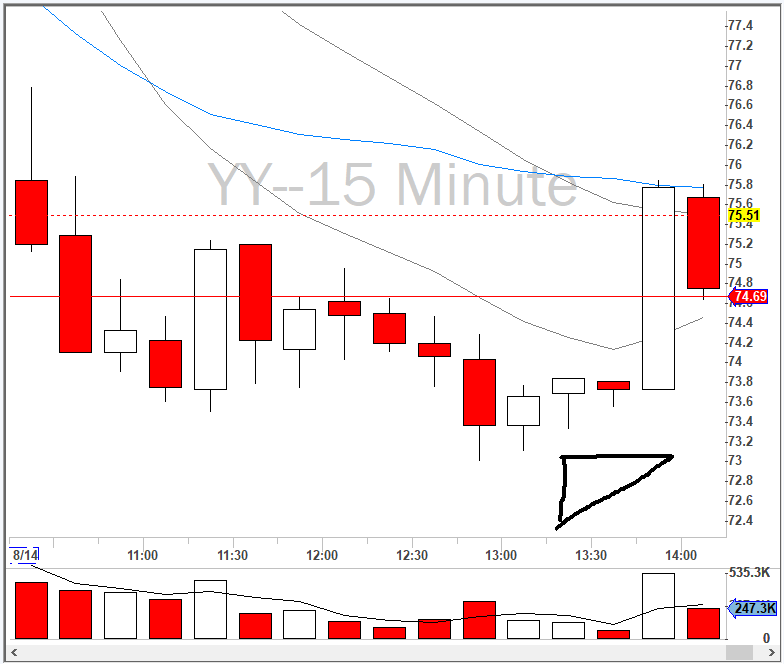
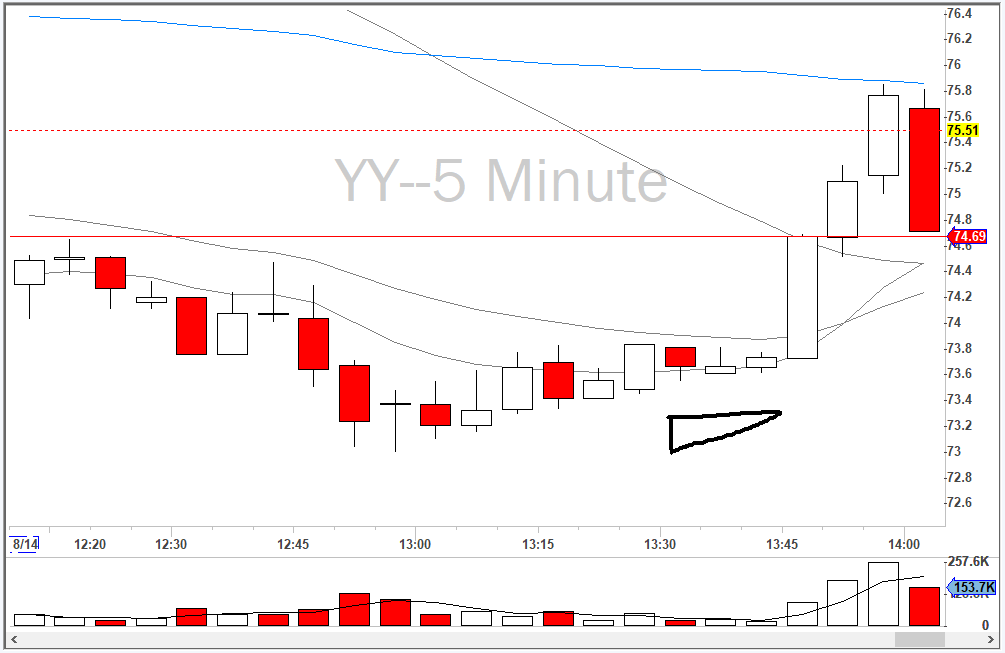
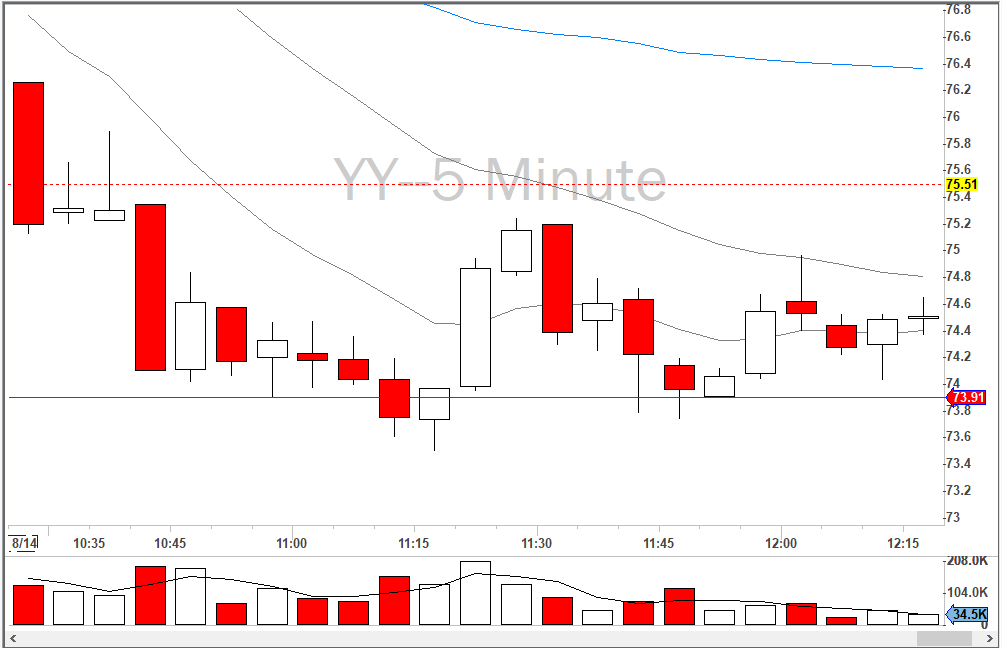
$YY - Aug 14, 2018: Boot Reversal Breakout
15-min chart reversal. Then stalled on some sort of a wedge formation. Note the higher-lows and the flat-top pennant formation. Pressure is getting built up for a breakout to the upside (converging to a point).
5-min chart similar consolidation and convergence to a point. New 5-min high leads to new 15-minute high. Off to the races.
-
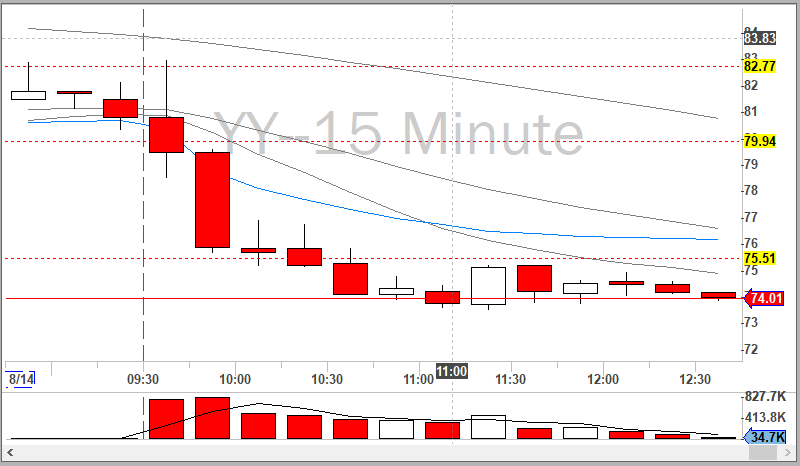
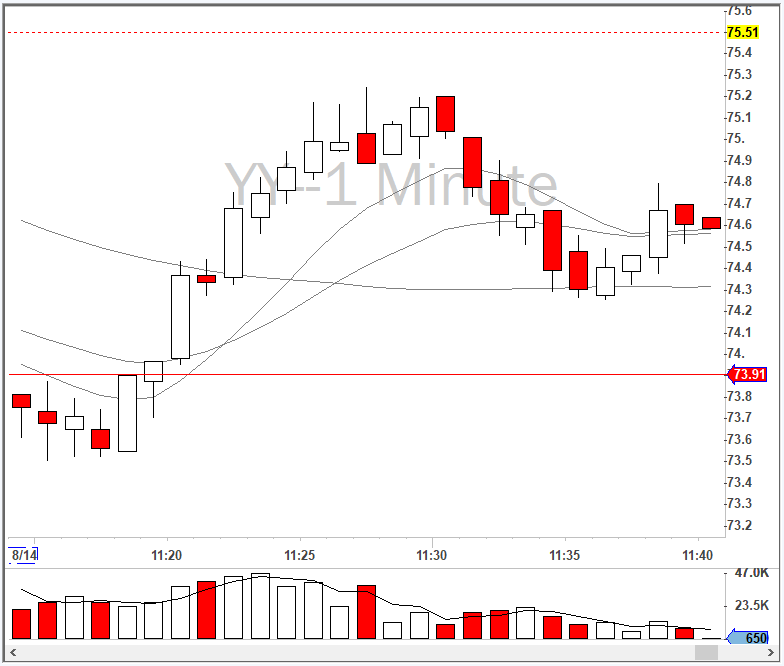
$YY - Aug 14, 2018:
15-min chart nice spinning top, then double bottom.
5-min chart huge 5-min candle after it bottomed.
1-min chart gave a nice MA cross after the bull flag.
-
1
-
-
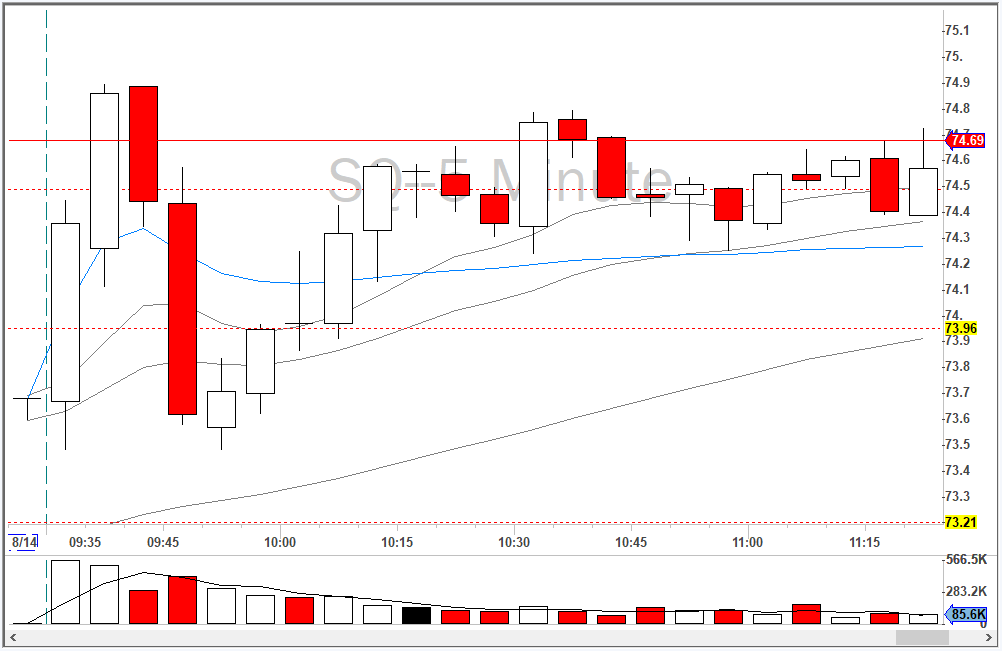
$SQ nearly engulfed but came up short. On the next candle, there was a pullback, then continuation dump toward LOD.
-
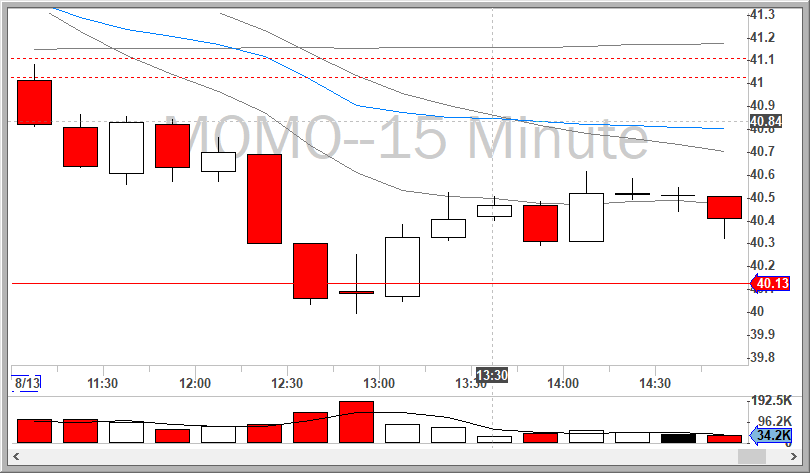
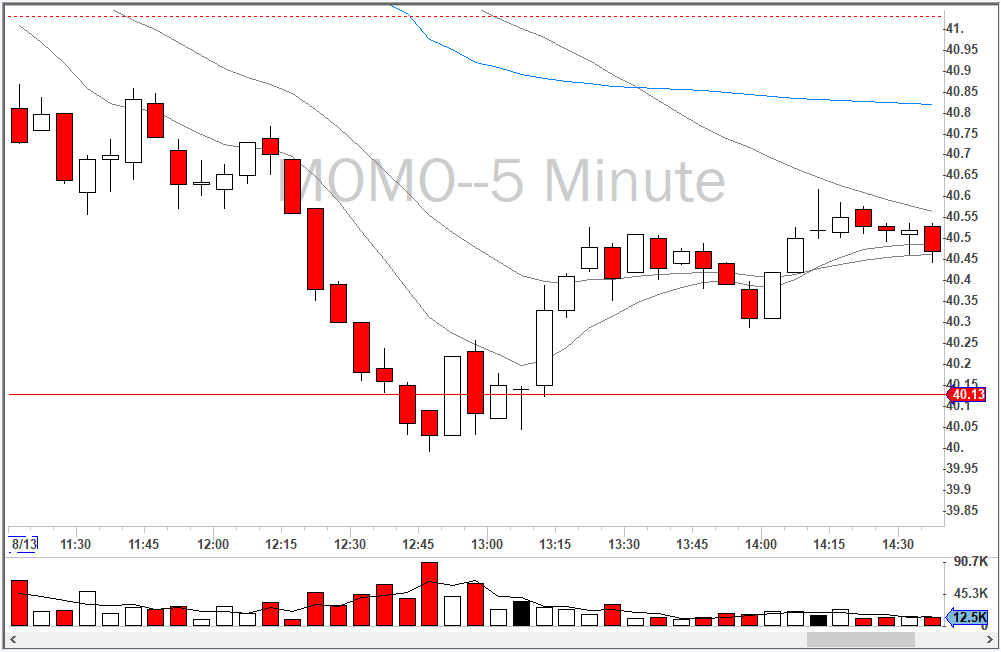
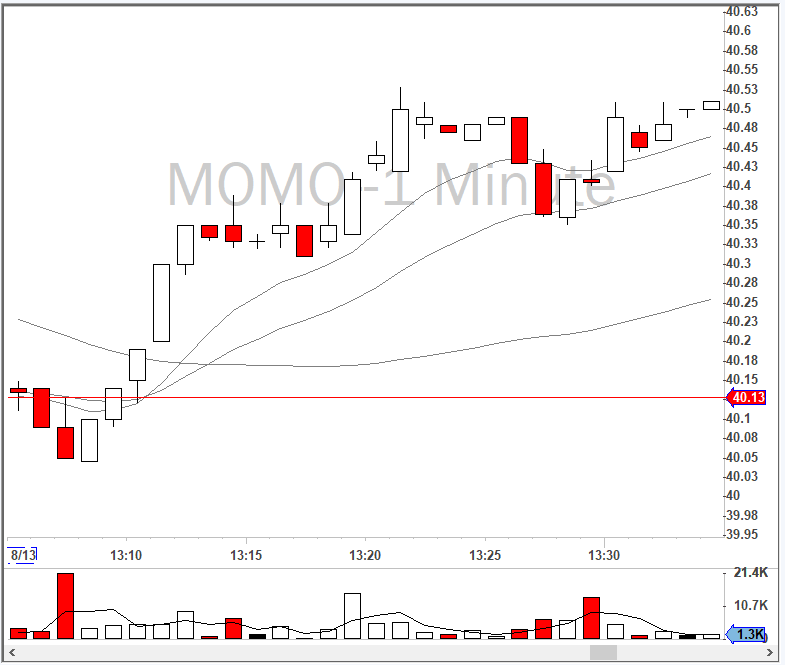
$MOMO - Aug 13, 2018: Reversal to the 50 SMA on 5-min chart.
Nice doji on the 15-min chart
Pop on new 5-min high
MA cross on the 1-min chart
-
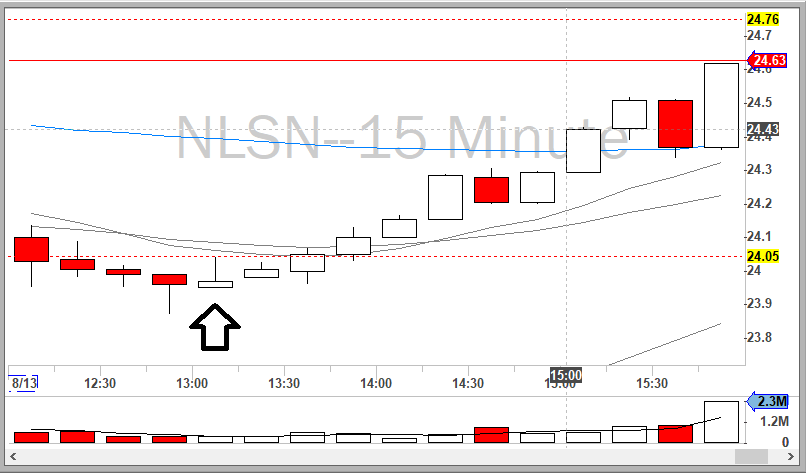
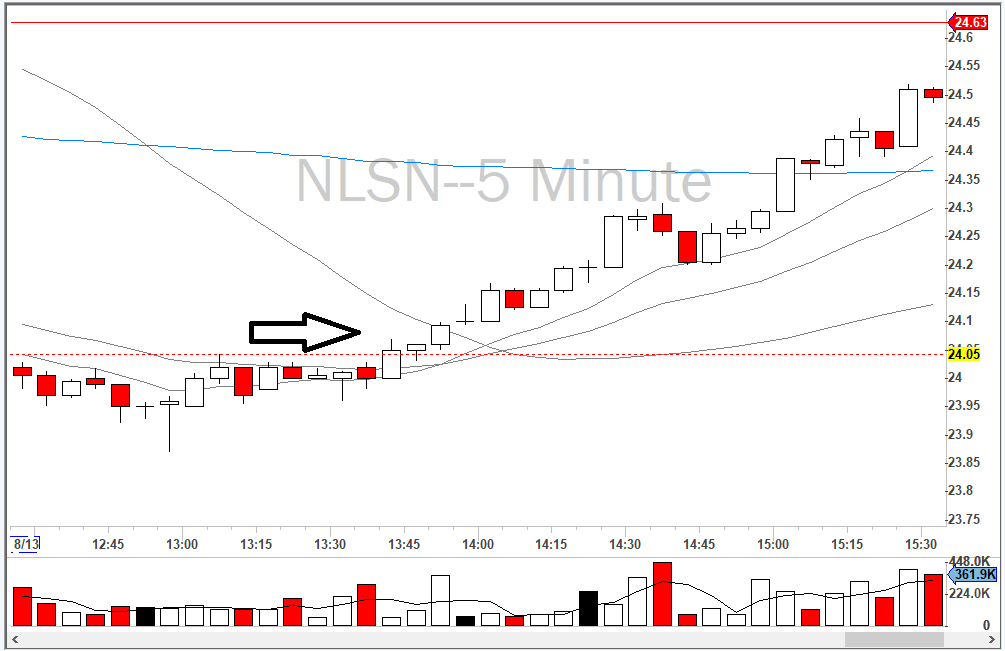
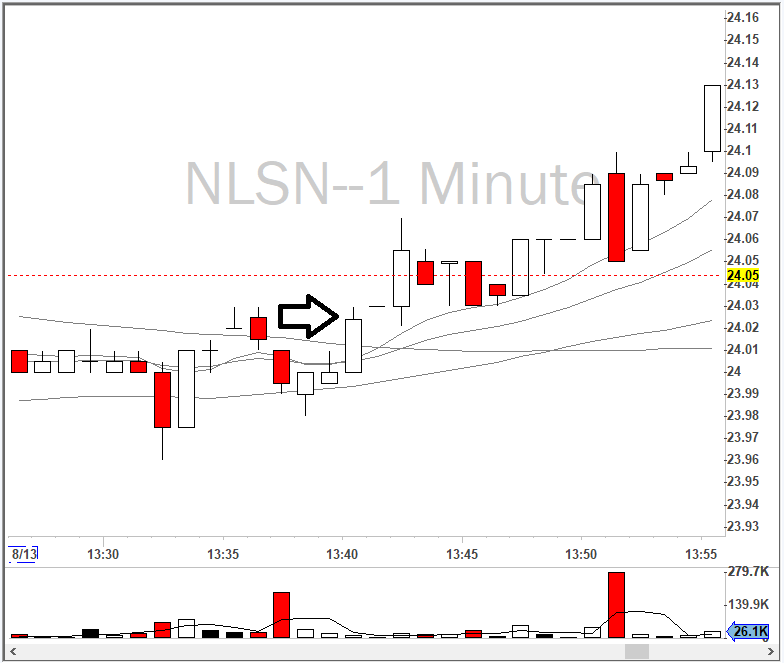
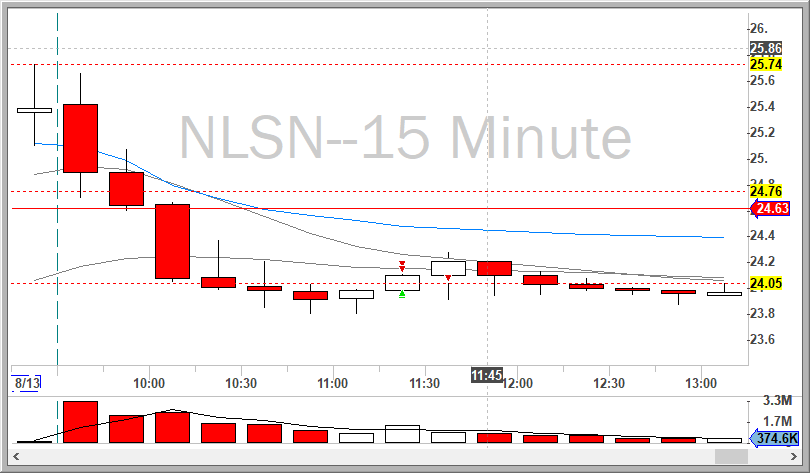
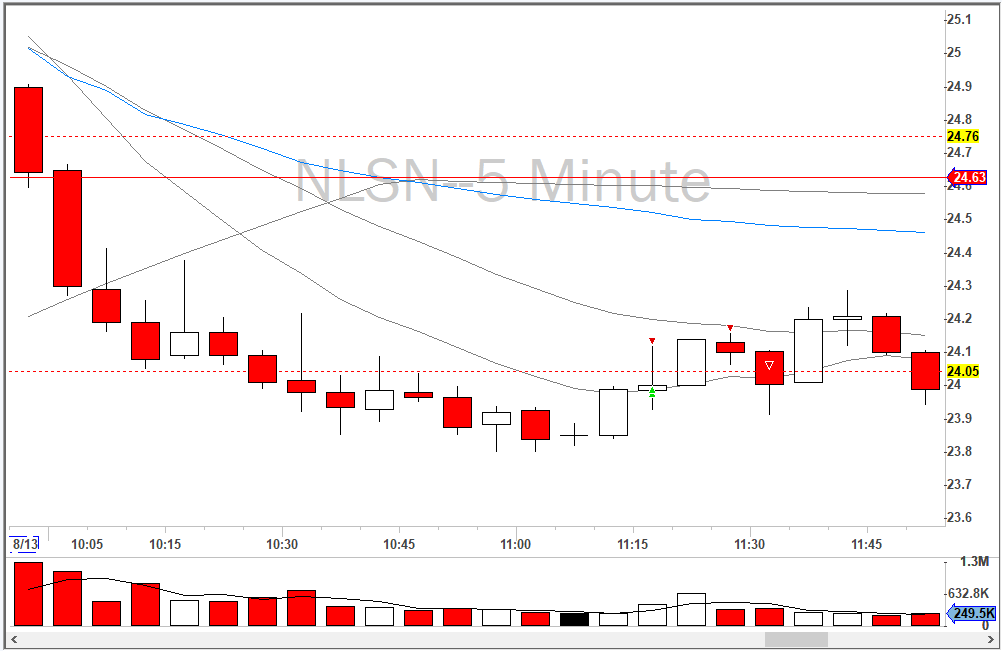
$NLSN - Aug 13, 2018: Reversal continuation back to VWAP.
15-min chart hammer, then inverted hammer for new 15-min high.
5-min chart breakout on new 5-min high.
1-min chart 9, 20 cross the 200. Then 50 crossed 200 for extra trend confirmation.
-
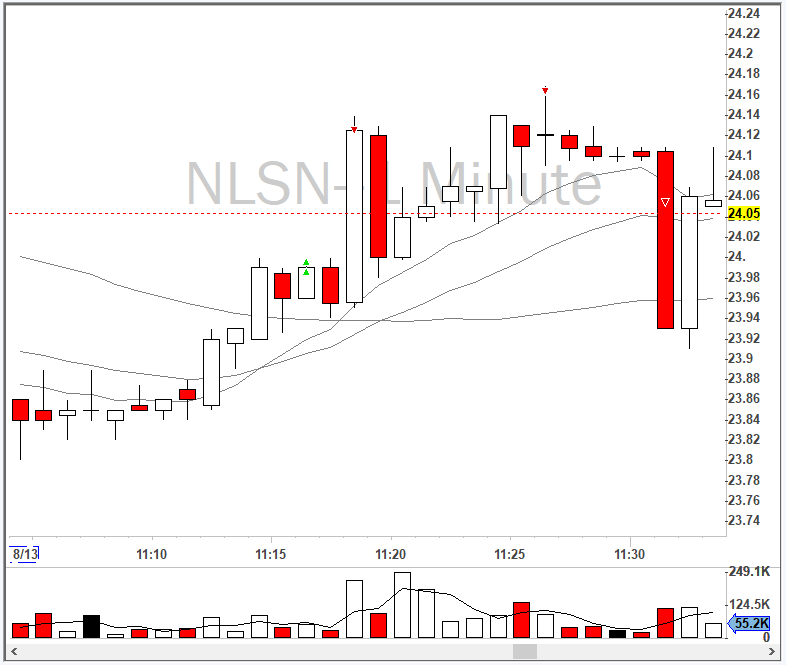
$NLSN - Aug 13, 2018: Reversal back to the 20 EMA on 5-min chart.
15-min double hammer bottom.
5-minute pop-up candle on new 5-min high.
1-min chart 9 and 20 EMA cross above the 50 SMA. Started riding trend before collapsing.
-
1
-
-
2 hours ago, keen246 said:Great tip. Do you think it would be possible to configure a Hotkey to change quickly, say, from 10% to 40% and viceversa?
I highly doubt it. You can try asking [email protected]
-
Not exactly A1 setup, but similar signals that it was going to crack.
-
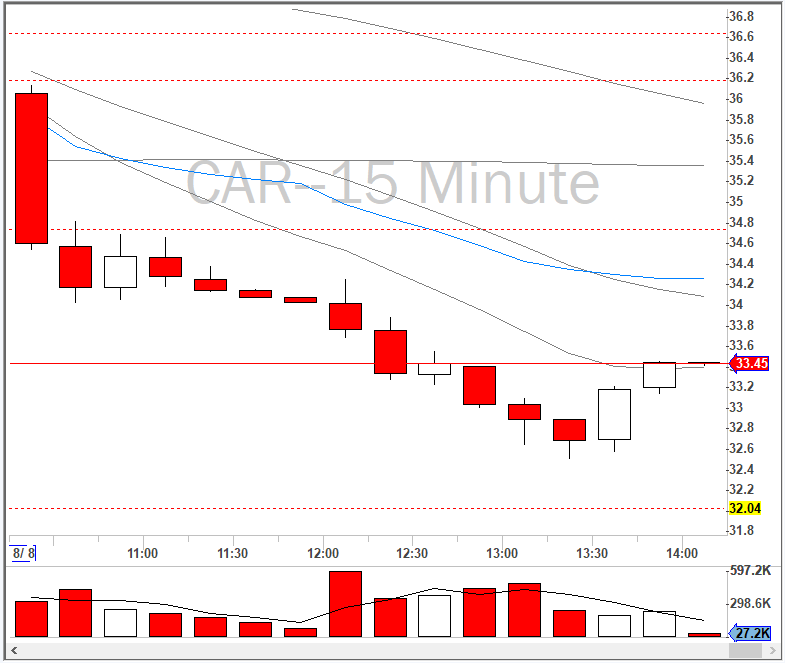
$CAR - Aug 8, 2018: Reversal in-progress. May make it back to VWAP.
15-minute chart bottom on some sort of hammer. 32.50 nice half dollar for support.
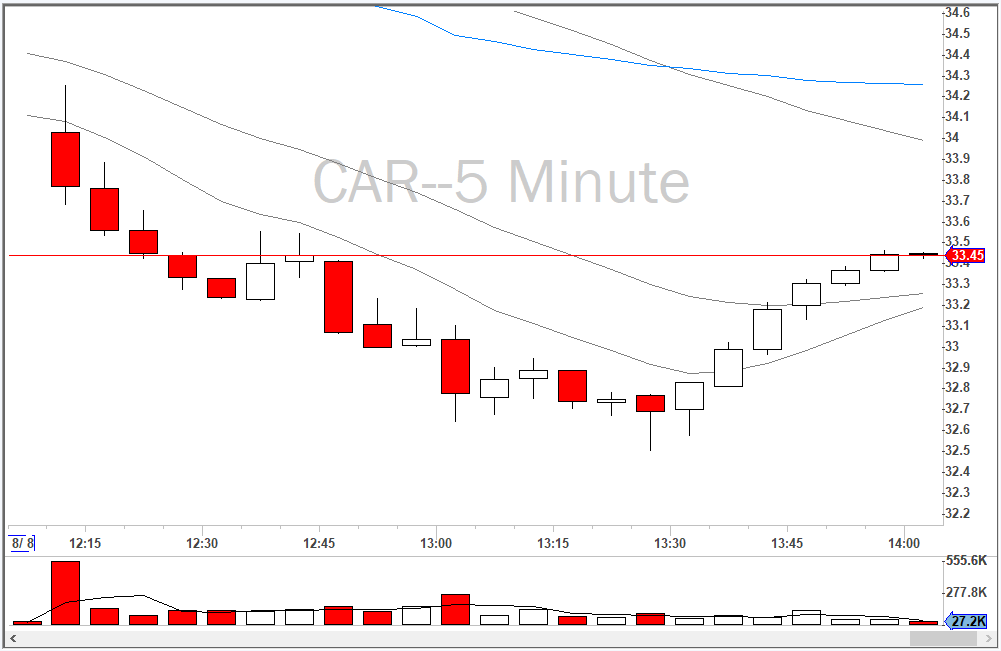
5-min chart hammer and then new high.
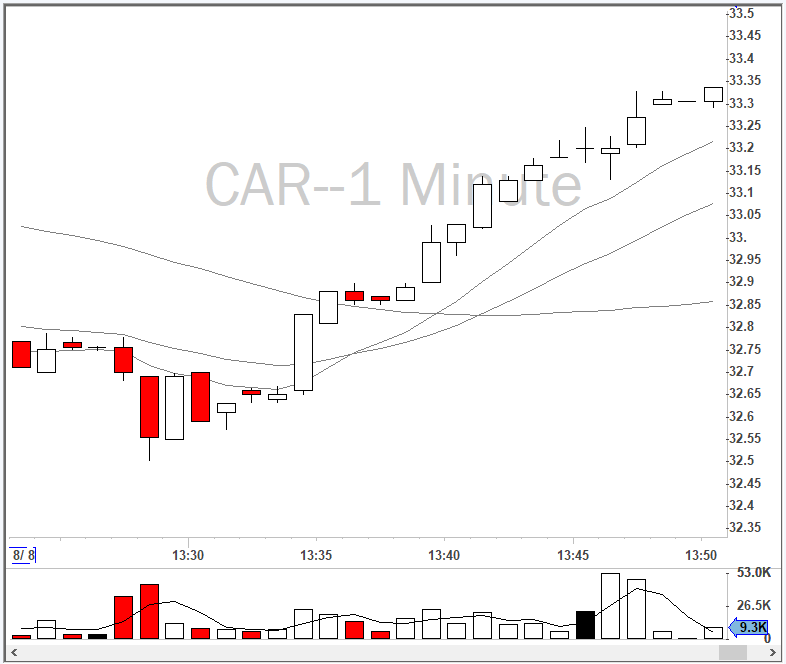
1-min chart MA's crossing after a bull flag.
-
2
-
-
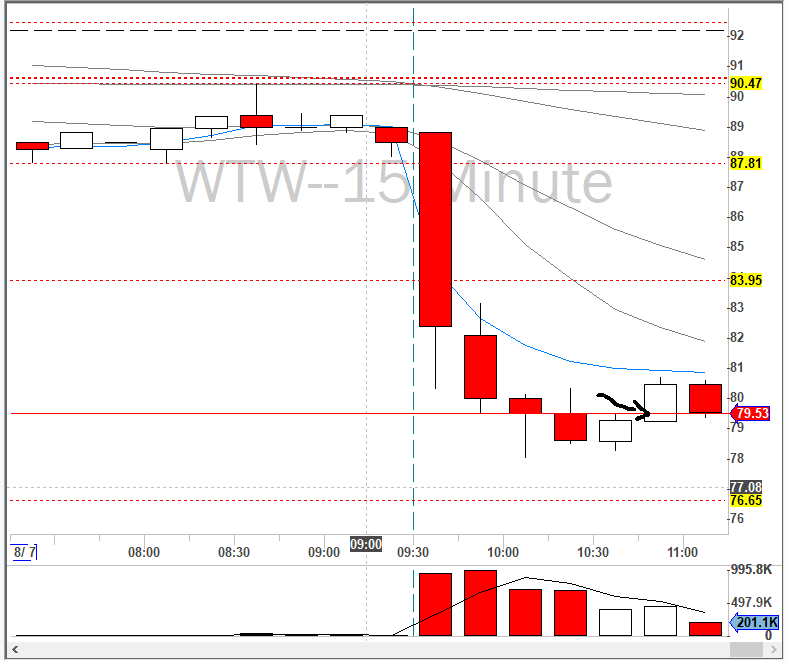
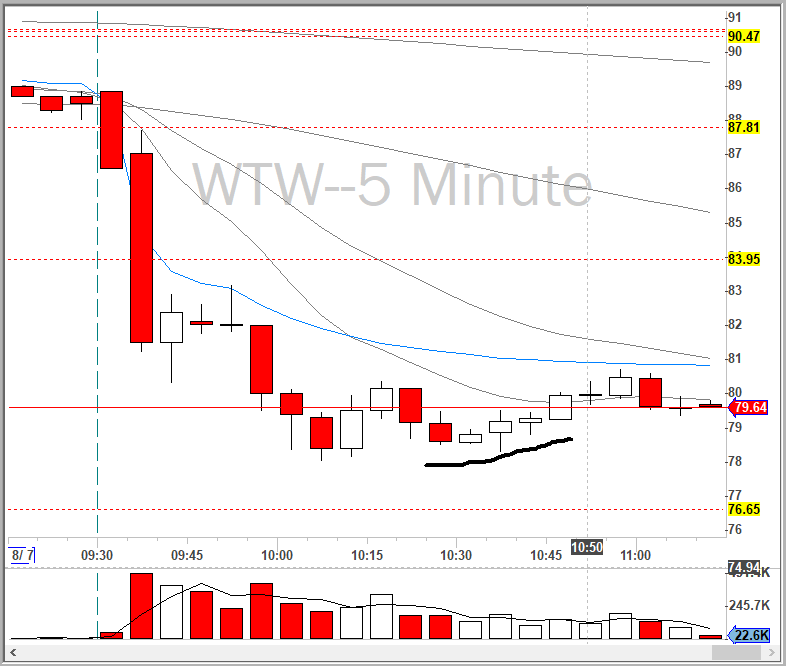
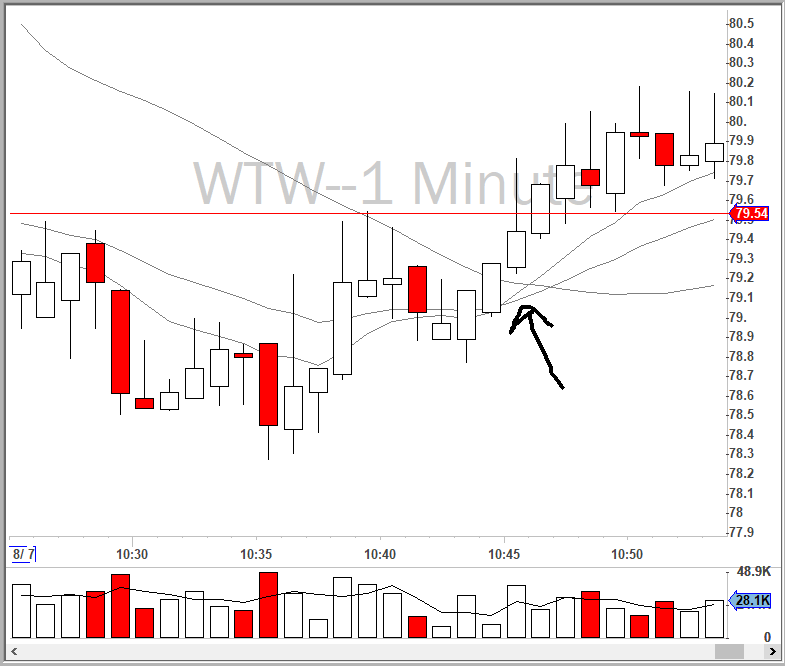
$WTW - Aug 7, 2018: Reversal almost made it to VWAP.
Good consolidation on the 5-min chart,
MA's crossed on the 1-min chart.


15-Minute Chart Reversal Strategy
in Day Trading Strategies
Posted
$AMD - Sep 5, 2018: 10:30 AM Reversal to VWAP
15-min chart solid double hammer then new high.
New 5-min high at around 10:35 AM.
MA crossed over on the 1-min chart later at 10:42 AM.