

Zack Zarr
-
Content Count
128 -
Joined
-
Last visited
-
Days Won
1
Posts posted by Zack Zarr
-
-
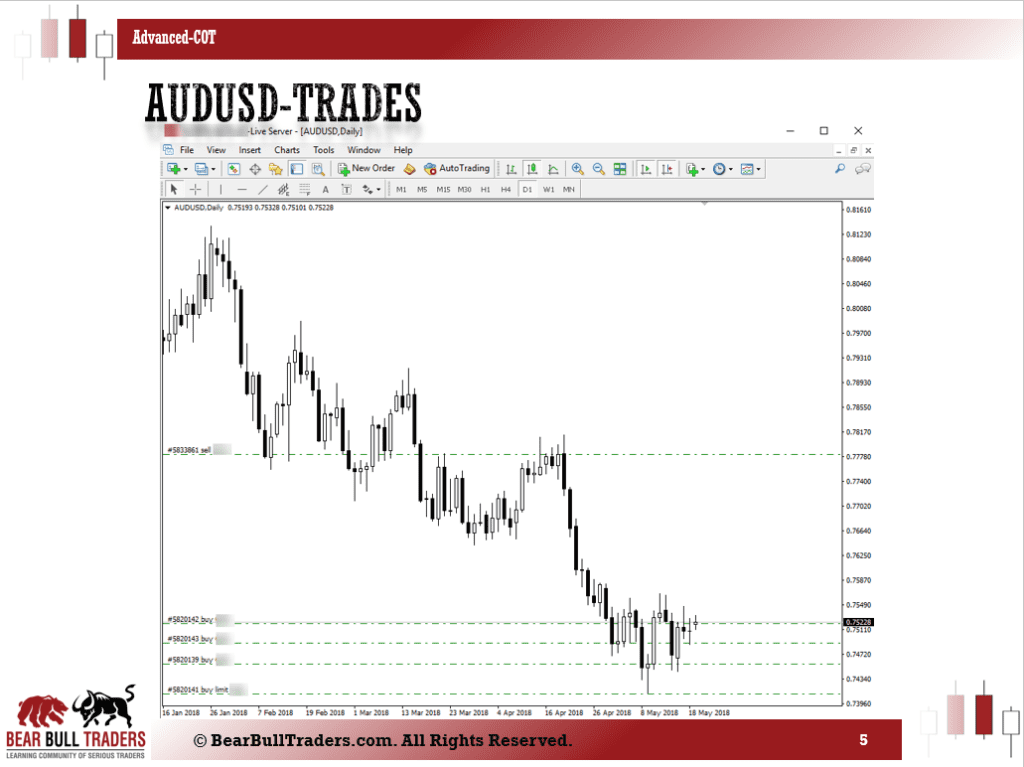
AUDUSD Trades based on May-01-18 COT Report
Below are the active trades based on my analysis of the COT report at May 15th, 2018 which I posted here.
More updates will come in the coming weeks on the results of these trades.

-
AUDUSD Analysis based on May-15-18 COT Report
I am trying to add some non-forex related photos to my posts just to lighten up things a bit. Data analysis should still be performed when the mind is in its clearest state. Taking a walk outside always helps me clear my mind. These photos are little reminders I take with me from these long relaxing walks; I hope you enjoy.
Snapshots of my AUDUSD analysis after the COT data on May 15th are shown here. I noticed some interesting levels in the calculated parameters on my chart which I highlighted. the explanations should give you some ideas of what I am thinking on this pair. The trade based on this analysis is posted here.
For more information on this type of analysis check out the previous posts in the education section of the forum here, here, and there.
If you want to discuss further and clarify things, please send me a message to [email protected]
Zack
-
CADJPY-Supply & Demand- From March 21, 2018
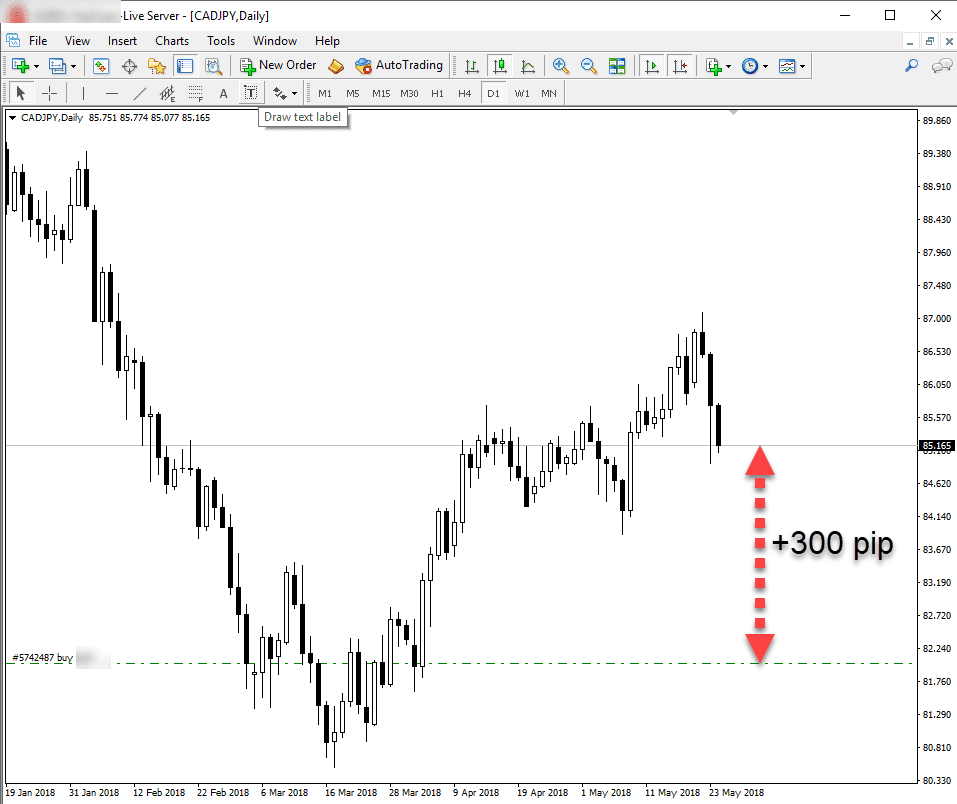
Status: Open
Profit: >300 pips
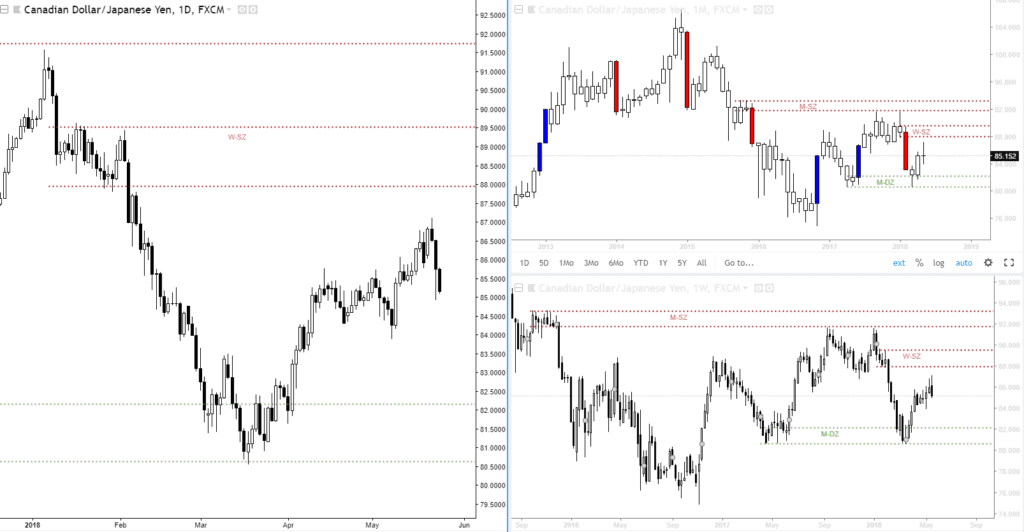
This is a trade based on the Supply and Demand analysis which I explained in a previous post as well as my book. Despite some draw down in the early days, the trade is well into profit. I am looking at the weekly SZ for next profit target. I had about 5 different positions around the same area which I already took out for profit. I am letting this one run to the SZ.
Here is a snapshot of my three time frames windows for analysis.
Below is the trade I left open aiming for the next weekly supply zone.
If you want to discuss further and clarify things, please send me a message to [email protected]
Zack
-
Gold Trades based on May-01-18 COT Report
As I explained in my post, the Gold traders have a very interesting and straight forward mindset. I attribute this mindset to the fact that Gold is a physical commodity/asset. There is a literal supply and demand dynamics across the world for it.
I have been able to make a case for a short term downturn in the gold and have been able to profit from it. Although most of my short trades have been closed with profits, I still have some open. On the week of May 1st, I anticipated some short term upward movement in Gold and opened few longs. The trades were either closed with some profits or at BE. However, the following weeks brought more downside which made me open more short as well as longs on the way down. I will make some more updates regarding these trades in the coming posts.
For more information on this type of analysis check out the previous posts in the education section of the forum here, here, and there.
If you want to discuss further and clarify things, please send me a message to [email protected]
Zack
-
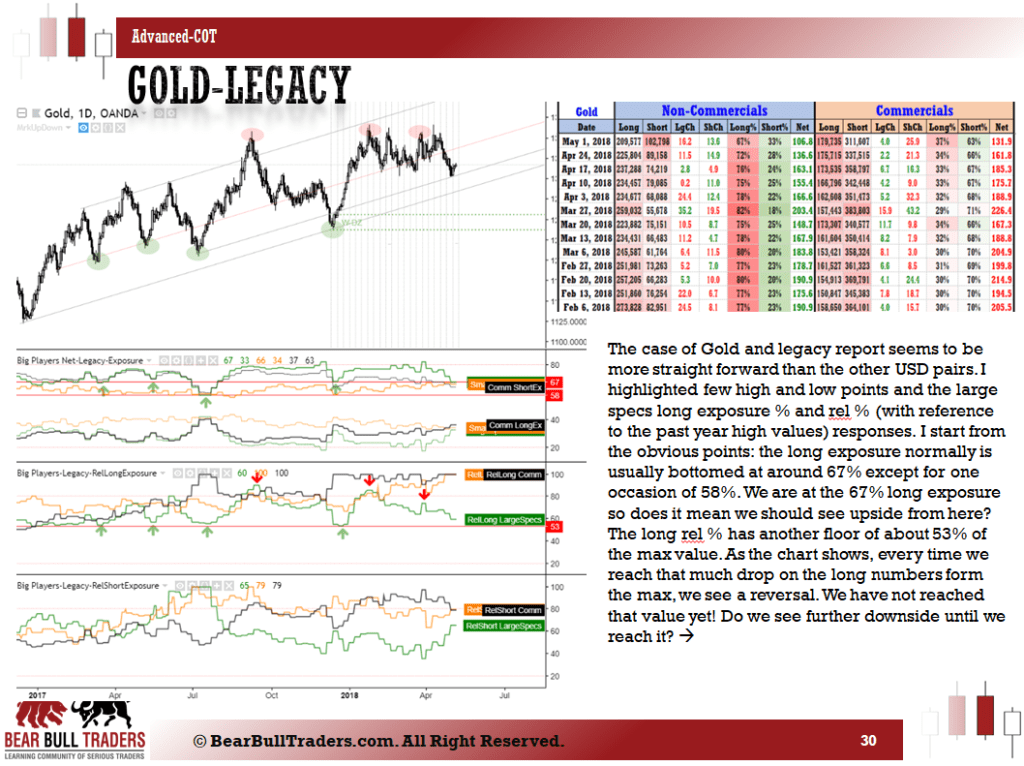
Gold Analysis based on May-01-18 COT Report
A snapshot of my journal from May 1st 2018 for Gold is shown in this post.
Big players trading Gold have somewhat different behavior than the currencies. This is because of the fact that Gold is a physical commodity. There are certain levels in the long and short position sizes than they follow. In these screen shots I show few of their particular habits when trading Gold. The bullish case for Gold has been running for about two years now. As I mention in these notes from my journal, I have seen few signs of the swing low on the Gold which is why I have been short for quite a while. You can see my trades in this post.
However, we are approaching some key positioning levels which I cannot ignore, and the reason for starting few long trades. Several more levels must be broken until I am convinced of a bearish trend in Gold. More of this type of analysis will come.
For more information on this type of analysis check out the previous posts in the education section of the forum here, here, and there.
If you want to discuss further and clarify things, please send me a message to [email protected]
Zack
-
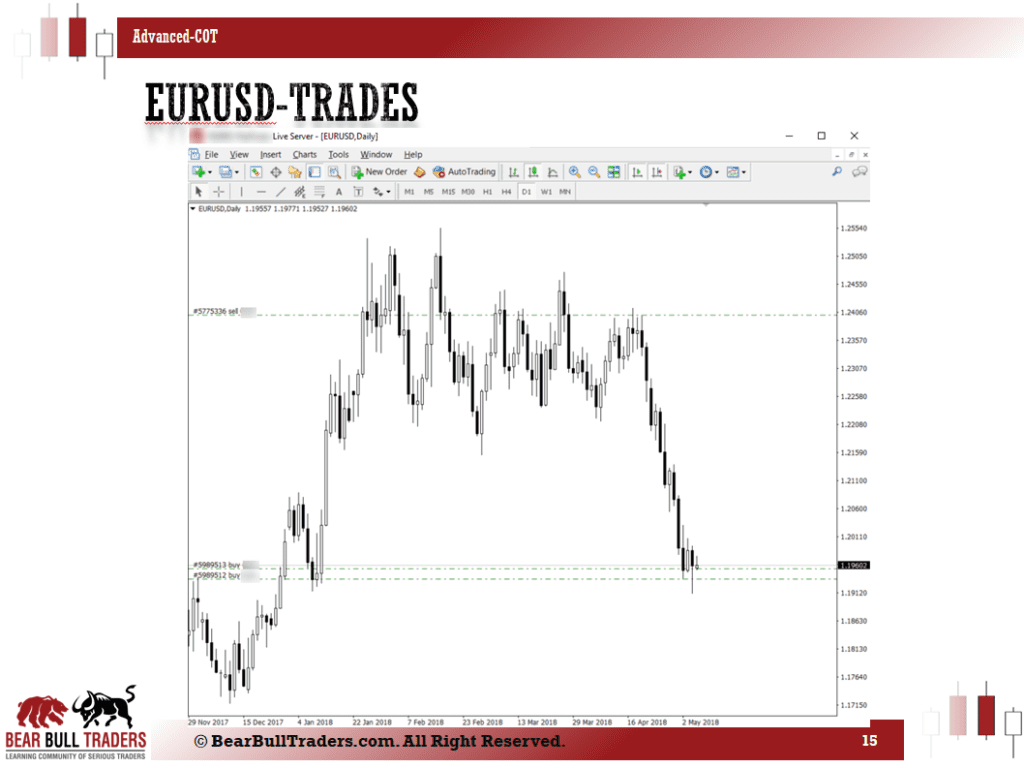
EURUSD Trades based on May-01-18 COT Report
As I explained in the analysis post, I have been looking for a bearish case on EURUSD for a while. The past few weeks have been very rewarding in my short positions on EURUSD. At the same time, I started few long trades for short term profit on the way down. Although I had to exit those trades you see here at the BE, there are more levels that I add more longs until a bearish case gets confirmed. More analysis and trade updates will come in the upcoming posts.
-
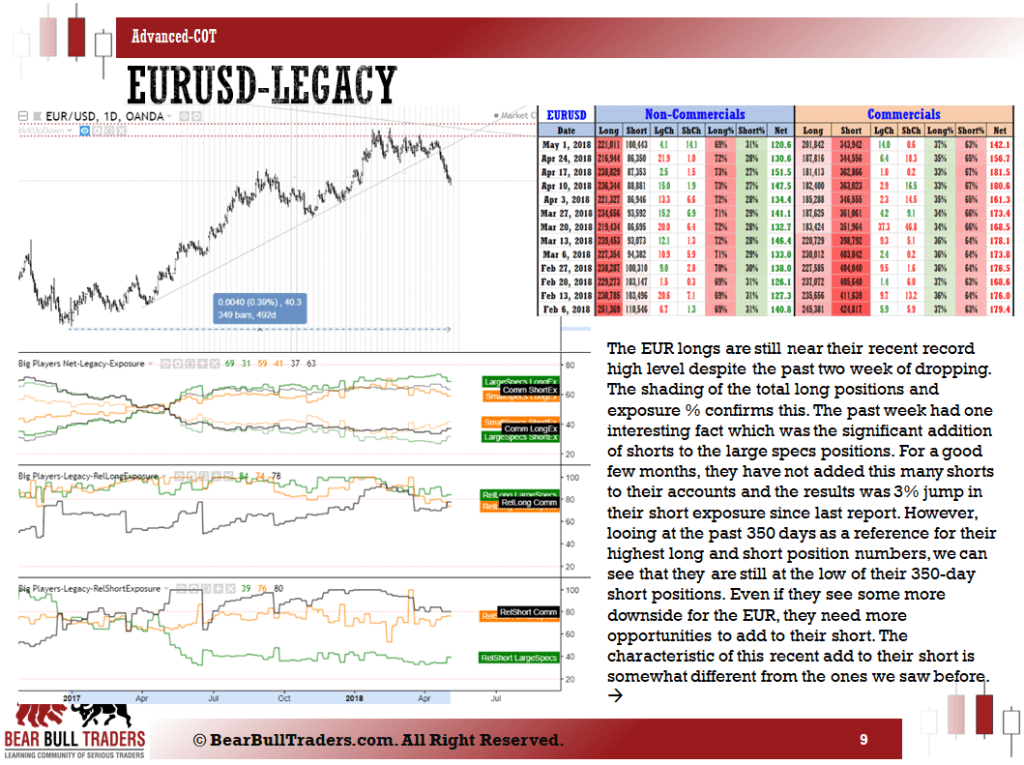
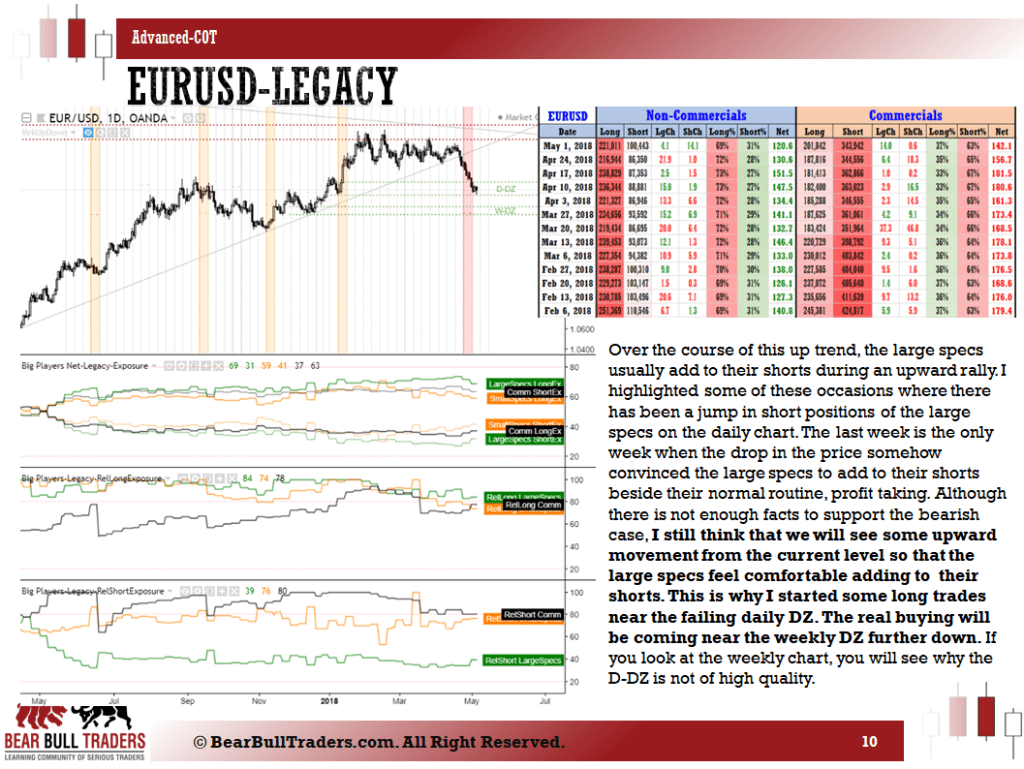
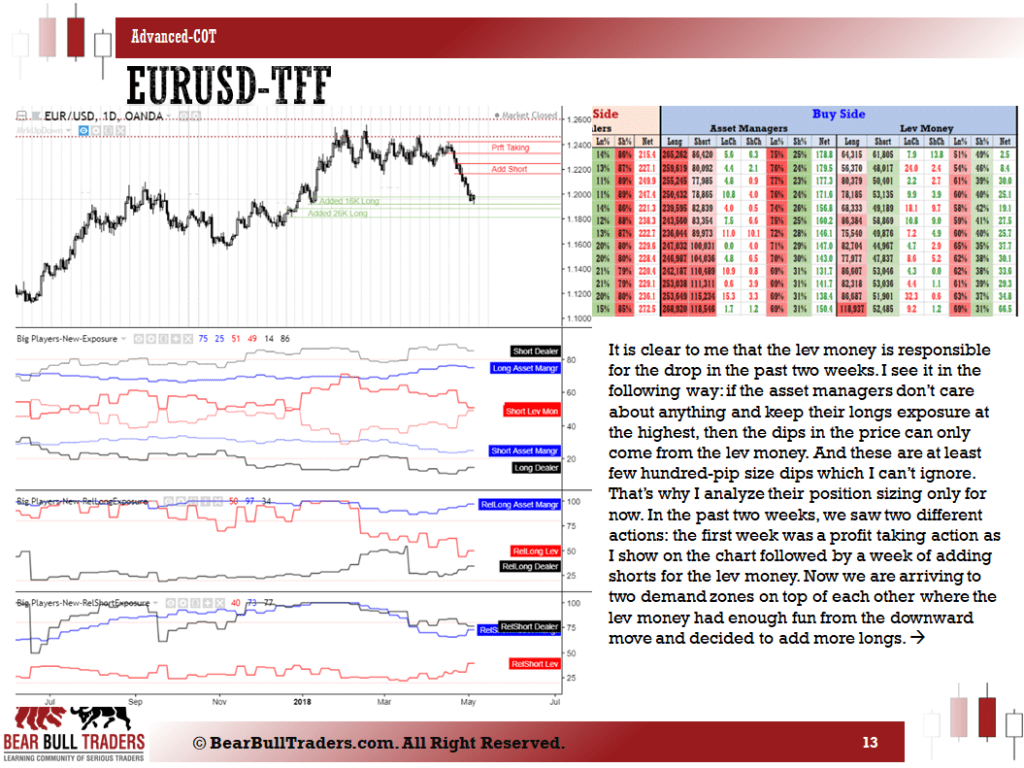
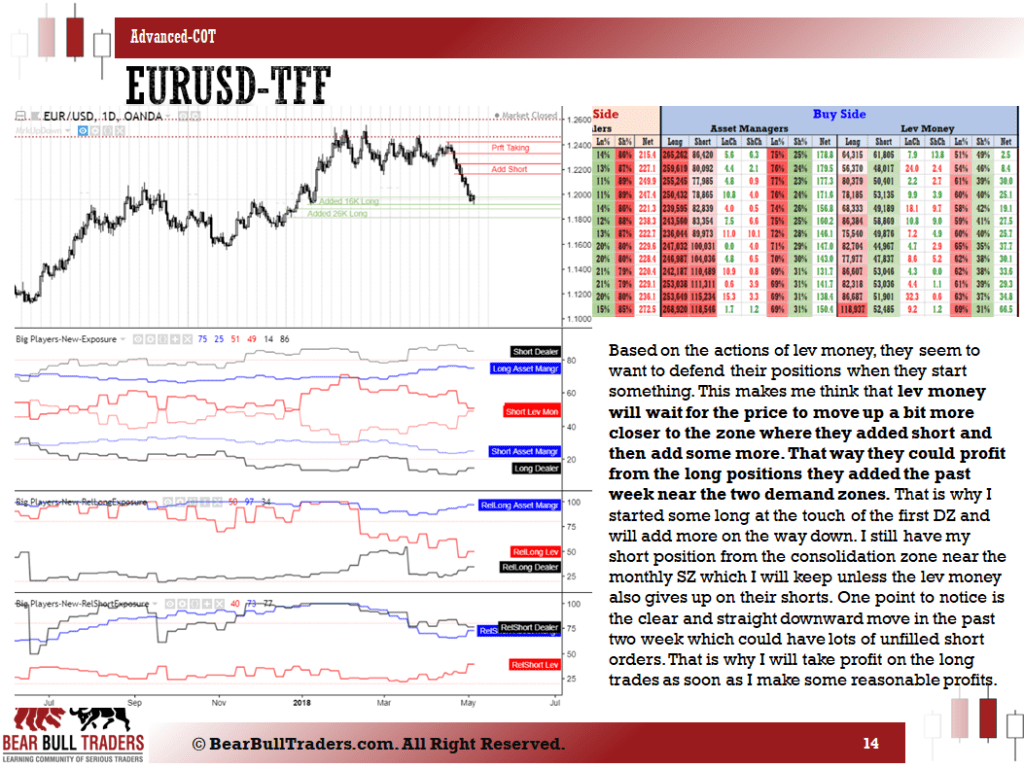
EURUSD Analysis based on May-01-18 COT Report
This is the first post in a series of post I will be adding to our forum which provides some snapshots from my weekly trade journal. The current post belongs to the week of My 1st when I saw signs of EUR weakening. At the same time I wanted to take advantage of some short term long trades. The snapshots are self explanatory so I leave you to it.
The trades based on this analysis are also posted in a separate topic.
The analysis is organized based on the legacy and the TFF COT reports. For more information on this type of analysis check out the previous posts in the education section of the forum here, here, and there.
-
Commitment of Traders Data Analysis- Data Meets the Chart 2
The previous post covered my methodology of placing the COT Legacy data right underneath the charts as guiding tools for deciphering the big players’ actions. In this post, I will show similar methods using the new format of reports including the TFF (for currencies) and Disaggregated (for commodities).
The parameters for each window are similar to what I intruded in my previous post. These include the Long% and Short% exposure (window right below the chart) and the RelLongExposure% (second below the chart) and RelShortExposure% (the bottom window).
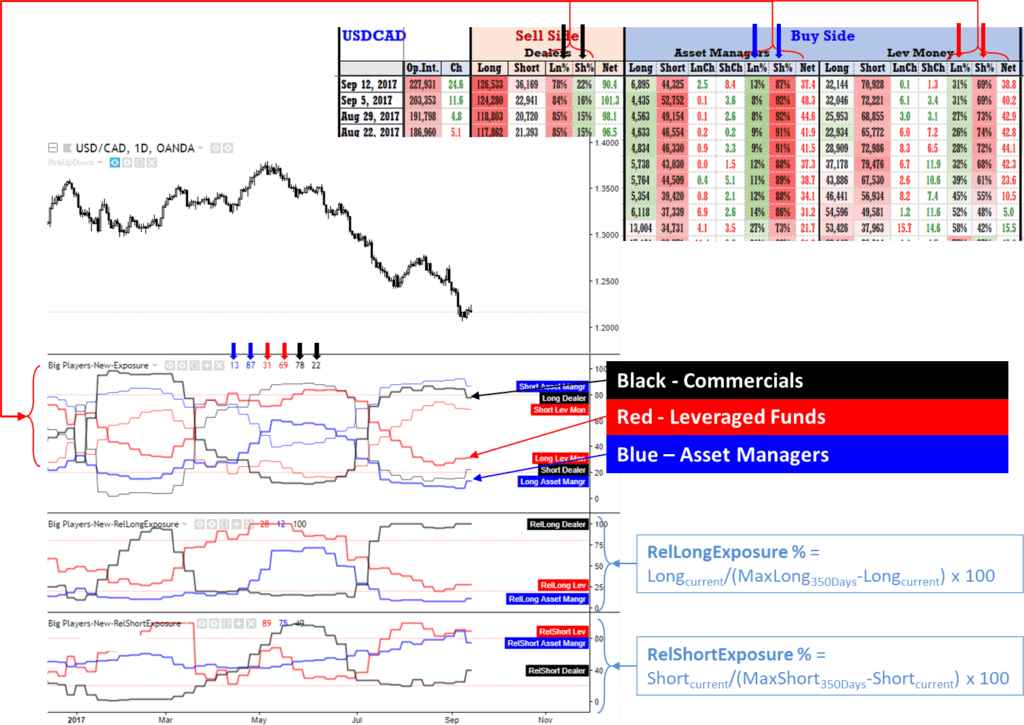
The figure below shows, the TFF format includes two major groups of traders on the buy side which are asset managers and leveraged funds. Here I picked the color blue (for asset managers) and red (leveraged funds) beside the black (for the dealer on the sell side).
The values calculated in the excel template match those shown in the top window below the chart for the Long% and Short%. One thing that I always have to look for is who is in control. That depends on the sizing of each group’s position. Although they are both large traders and have noticeable position sizes, one group is sometimes larger than the other. The table always is useful to remind me of the position size difference.
The data refers to Sept. 15, 2017 for the daily chart of the USDCAD. In the previous post, we saw the decreasing in the LargeSpecs or Non-Commercial short positions (profit taking) was the main action during the past few weeks. In the current chart, we see how the two different group of traders are taking profit off their shorts. Up to the first low point in the price near 1.25, both groups were adding to their shorts and the price kept dropping. The first group to start the profit taking was the leveraged funds. The asset managers waited for another dip in the price to make their decision for taking profit from their shorts. Similar situation occurred for their longs during this period. Asset managers were the latter group to decide to add to their longs.
This type of information is crucial when combining the supply and demand with the data analysis of the COT data. By now, I hope I have been able to provide a picture of how my weekly analysis routine looks like. In the coming posts, I will share some of my previous and current trades taken based on the similar analysis I presented in the past few posts. Understanding the concepts explained in this post, and previous posts are essential in better identifying the rationale behind my trades. I am very excited to share with you some of the trade ideas I come up with after each week’s report.
If you need further information or want to clarify something, please do not hesitate to drop me a message at [email protected]
Zack
-
Commitment of Traders Data Analysis- Data Meets the Chart
As I mentioned in the previous two posts here and here, looking at the big traders positions on each currency and commodity for the previous week is the only tool I add to my supply and demand trading methodology. Since the first time I started analyzing the COT data, several changes have been added to make my analysis more optimized. The last step was to take the analysis right in the charts because it saves me time going back and forth between the tables and the chart.
The programming capability of the MT4 platform was the most useful tool I could use to insert the COT data onto the charts. Although I was able to put most of my calculated parameters on the charts, the MT4 platform was not the best one that could save me analysis time. Fortunately the entire charting dynamics in the world of trading changed when the tradingeview.com web-based charting became available. The first time I used it at around early 2014, I immediately stopped using the MT4 for my charting. Later on, I started coding in pine script which allows me to implement my analysis on their charts. Pine script is the coding language used in tradeingview. Switching to tradingview definitely changed the quality of my data analysis. It became even more convenient as they added direct access to multiple databases of COT reports from their platform.
There are several formats of calculations I perform on the COT raw data to come up with the best visual results. Among them, there are three separate analysis windows I add underneath my chart nowadays. The first window contains the Long% and Short% exposure percentage. As I mentioned in my previous post, these two related parameters are calculated using the following formula:
Long% = Long / (Long+Short) x 100
Short% = 100 – Long%
The other two windows are also related but they calculate the relative long % and relative short %. In short, the relative long % is the percentage difference in the long positions compared to a desired historical maximum number of long positions. Let’s take a period of 2 years which is 104 weeks or about 720 days. The relative long % is calculated as:
RelLongExposure % = Longcurrent/(MaxLong720Days-Longcurrent) x 100
Similarly, the relative short % is
RelShortExposure % = Shortcurrent/(MaxShort720Days-Shortcurrent) x 100
The two parameters above are in fact a way of graphical representation for the color coding of my tabulated excel template (see previous posts here and here) combined with a differential factor. I found out that during the long term trends in a currency or commodity, the institutional traders take profit or add to their positions at around certain points relative to their past historical number of positions.
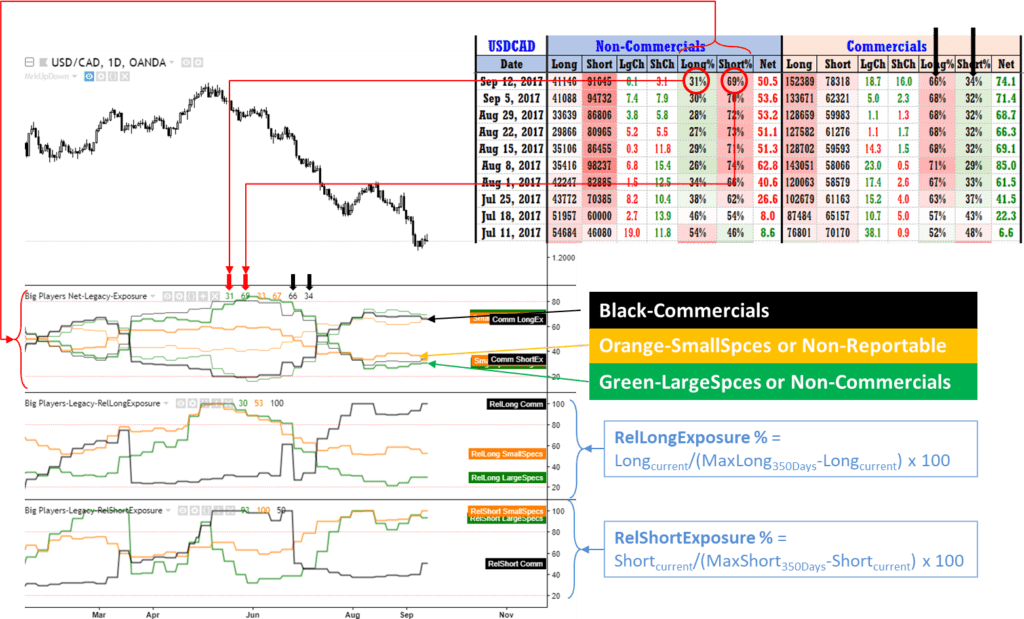
To avoid excessive text, let’s look at each parameter window and compare it with what I had in the excel template. Figure below is a snapshot of the daily USDCAD and the related COT data extracted from the legacy report. The tabulated excel data is also shown in this image.
The first window underneath the chart shows the exposure percentage numbers. These are the same as the Long% and Short% numbers calculated in my excel template. As I highlighted on the table, the latest Long and Short% for the Non-Commercials or the Large Speculators match the values shown on the top data window indicated by the arrows. The Commercials percentages are also indicated by the two black arrows. The Non-Reportable group is what I don’t display in my tables but I have it shown on the data window.
The two other data windows are what I refer to the relative long and short exposure percentages. I have found these calculated values are sometimes very useful in identifying turning points in the price. The second window below the chart shows the RelLongExposure% parameter. Here, I use the largest number of long positions held by each group of traders in the last 350 days as my reference point. As you can see, the LargeSpecs reduced their long positions down to 20% of their largest long positions within the past year and then started to add to their longs.
At the same time, the LargeSpecs have been at their largest short position (based on the bottom window showing the RelShortExposure%) prior to the latest low in the price. The next time the price hit a new low, their short positions were not as large as the previous low. What does this mean? It means that they are taking profit off their shorts and starting to add to their longs.
These are some of insights I can easily get form the graphical demonstration of the COT data which is otherwise more difficult to grasp from the tabulated data. As I mentioned, there are more parameters that I can put on the charts if I find them more useful at certain times.
I finish my post here to keep it brief. In the next post, I will demonstrate the graphical illustration of the TFF format. That report has also sometimes more insights which I use to my advantage.
If you want to learn more about the coding in pine script and how to develop your own analysis tools on charts, stay tuned because I am planning to develop a short course on that topic.
If you need further information or want to clarify something, please do not hesitate to drop me a message at [email protected]
Zack
-
Commitment of Traders Data Analysis- Traders in Financial Futures (TFF) Report
A snapshot of the techniques I implement for analyzing the COT reports was demonstrated in my previous post. This current post is a continuation of the same technique expanded to the new reporting format, the Traders in Financial Futures (TFF).
Again, I use a similar excel template developed through the years to make sense of the changes in positions of the big institutional traders every week. I consider these reports the only source of data available to forex traders beside the price action. The main difference between the legacy (traditional) and TFF (new) format is the addition of subcategories in the reports. This was done with the aim of further transparency to the public regarding the position reporting. Many argue that the new changes did not add much if not further complicated things. I actually find both reports useful and sometimes complimentary to each other when doing my analysis.
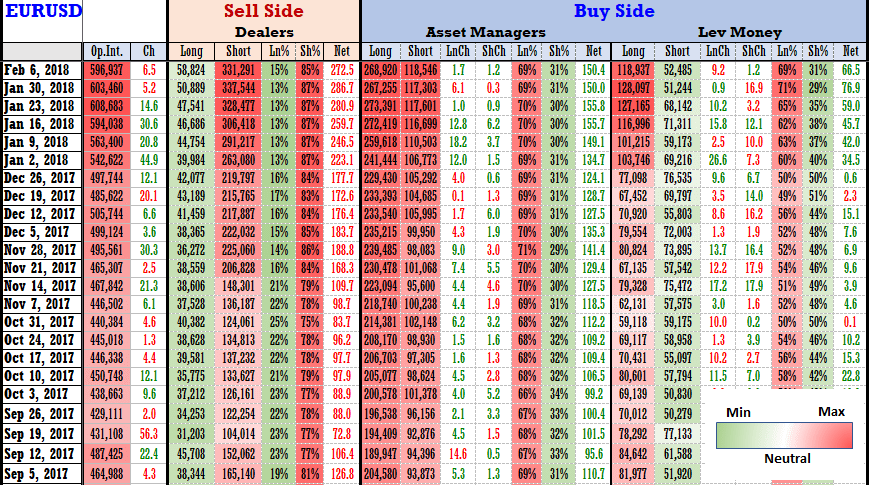
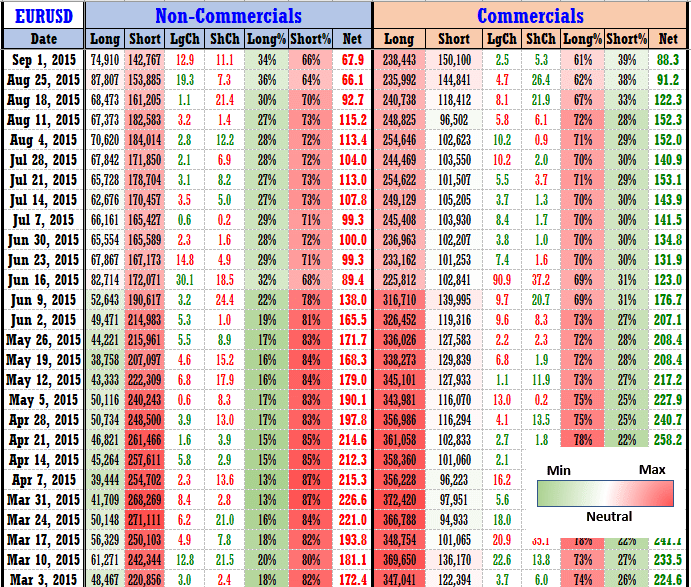
There are two type reports with the new format, one belongs to the currencies and the other is related to the commodities such as gold and oil. Figure below shows an example of my data analysis template for the EUR futures based on the TFF format.
These new formats identify the role of each institution in terms of acting in the sell side or buy side of the market. I have covered the sell vs buy side topic in a prior post. In these tables, I am looking mostly at the buy side, which includes the investment entities speculating on the futures of the instrument being currency or commodity. For the currencies, these include two groups of asset managers and leveraged funds. By comparing the sizing of the positions for each group, we can see who is the bigger player on each currency and has the control. In some cases, both groups have comparable sizes and equally contribute to the direction of the market.
I have the open interest also included in these tables just to gage the interest in the market towards each instrument. Open interest increasing near some level means there is new contracts are being opened during that week.
For the case of EUR, as you can see the asset managers are clearly the bigger player between the two during the past years. In fact, the shading of the long and short positions of the asset managers clearly shows they have never been this interested in EUR over the past 10 years.
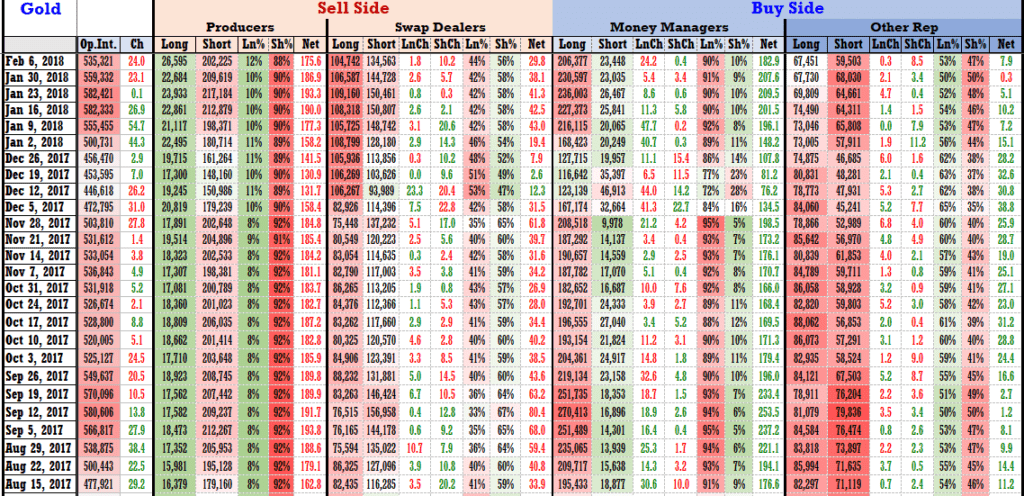
The commodities including gold and oil are reported for slightly different subcategories. This is shown in figure below.
For gold and oil, the sell side consists of producers and swap dealers. On the other hand, the buy size includes the money managers as well as other reportable. I am mostly interested in the buy side traders. In the case of gold these days, you can see that the money managers have the larger sizing.
When I started using the TFF data in my analysis, the analysis became even more time consuming. So I decided to implement some graphical representation of these datasets in my routine analysis. It was the right decision and I will expand on this topic in the next post. Nevertheless, the raw data in these tables is still what I look at every week regardless of how much time I have to spend. After all, trading is or must be considered a full-time job in my opinion.
If you need further information or want to clarify something, please do not hesitate to drop me a message at [email protected]
Zack
-
A Deep Dive into Commitment of Traders Data Analysis- Part 1
It has been while since the last post because I have been putting some of my data analysis techniques together in a format presentable here. As we saw in the previous post, the COT report is the ONLY source of data directly coming from the institutional traders. Beside the charts, COT is the major source of information I use on a weekly basis. Remember, news and hyped prices are only opportunities for the big players to fill their orders and nothing more. It is very rare that a news release changes the direction of institutions’ mindset. Rare, but not impossible. In this game of probability, I always go with the high probability trades not a single rare occasion.
How do I organize the data?
Short answer, in Excel.
At the end of each week on Friday afternoon, I compile the data released on CFTC website in my excel template because it is the easiest way for me to see the long term directions and decision making points in time. Below is snapshot of what I started with about 6-7 years ago.
In short, I simply copied and pasted the data from the CFTC website for each currency and performed some basic analysis on them. In particular, I was tracking what the non-commercial traders were doing each week. One of the factors I was interested in was the percentage of short and long positions, the exposure %. Its simple calculation is as follows:
Long% = Long / (Long+Short) x 100
Short% = 100 – Long%
I was looking for extreme points where these traders had the maximum or minimum exposure for over a period of time like the past year, or 2 years. I will discuss more about what time period to look at in later posts.
Later on, I found easier ways to display my data using built-in excel features. I had to take such steps because looking at multiple data series for different pairs and two different formats (legacy vs. TFF format) was tiring.
The current format I have on my excel is not that different from the old one except there are more coloring based on the historical values of the positions and extreme points in position sizing. Figure below is the most recent format that I have been using for few years now. I have not implemented more sophisticated excel features because I simply don’t need to. Besides, I have put my efforts on some time series coding on the charts directly. That will come in the coming posts.
It looks nicer, in my opinion. Now, instead of looking for extreme exposure and position data, the color coding allows me to see them much faster. The legend shows how I applied my color coding. The smallest number in a range gets the green and the highest values gets the red. Numbers in between the two take a gradient color with white being right at the middle. Being too green or too red is extreme!
Net positions!
The net position number is the one you see in most websites that report the COT data in a graphical right below their charts. See this one for example
https://www.barchart.com/futures/commitment-of-traders/technical-charts/E6*0
My personal experience with the net positions has not been satisfactory. For some reason, I want to see the actual long and short contracts rather than the net. I can get a better vision of what the traders did over the week using their actual long and short position changes. For that reason, you see me often not paying too much attention to the net positions. I thought I should clarify this here.
Example of Analysis
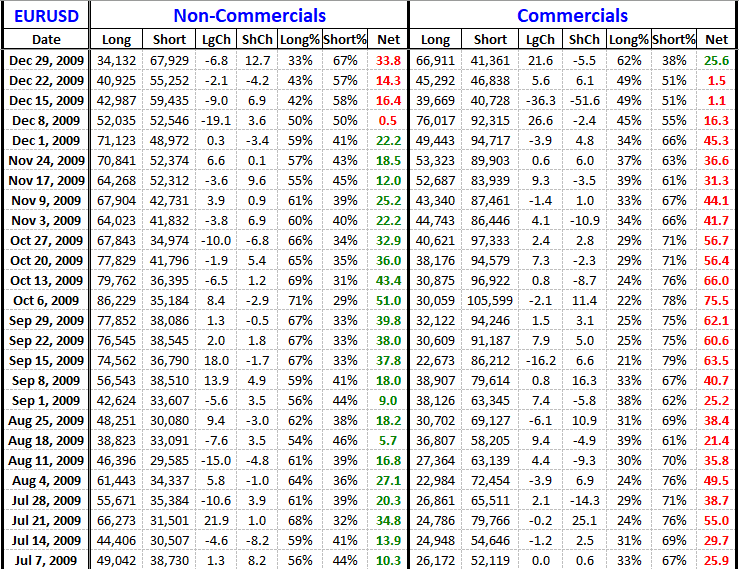
Figure below shows a snapshot of the EURUSD chart and the tabulated COT data during the year 2015.
I have highlighted few datapoints on the chart and their corresponding number of short positions held by the institutional traders. Just tracking the short positions, we can see that during each swing low, the number of shorts has consistently decreased. The shading of the absolute short positions and the exposure % suggests that these traders where at extremely high short exposure prior to March 17th. Over the next few months, they have been taking profit off their short positions which is why the number was decreasing. Seeing this, looking for a long trade is not a bad idea. And as you can see, after the Jul 21st, the previous high was broken. The long trade after the May 26th or Jul 21st data would have been a really good trade.
Another insight: since the Dec 2014, they have been adding to their shorts as the price was going down. Now, they are not adding shorts during each period that the price goes down. The is a change in behavior. And a SIGNAL.
Please note that this is only an example of using one parameter to see into the mindset of the big players. The more we analyze the numbers including the % exposures and long positions, the better we understand their trades. Eventually, we want to trade with them. The data is delayed (and you hear everyone saying that about the COT reports), but these traders are also SLOW! It took them 5 months to get rid of 72,000 short contracts each worth EUR 125,000.
How to survive the turmoil
The process of decision making after you figure out some pattern in the data is still complex. Here, I provide some key notes that helps you get better entry points and also test out your analysis in real time. These are my experience over the years and of course, every situation demands its own decision making steps which depends on the market dynamics at the time.
Once you see a pattern in the data, benefiting from it is a matter of how you place your orders. There will be ups and downs before the giants make their final decisions so:ALWAYS split your orders into smaller portions.Test out the idea with smaller orders and try to think as If you are working with the big players.Use the time of news to your advantage.There will be times when all your orders are in negative, but you need to learn to trust the data. You will build a sense of how to spread out your orders to get the best price for yourself.Mark up your supply and demand zones. Make sure you do that using at least three timeframes.These big players report their positions on weekly basis so allow yourself at least a week to test the idea and observe what they have done in the past week.Also remember, you are only seeing the data up until Tuesday so what they did in the three days after that day is not in your report. But you can always go back to the charts and observe the price action. Depending on the nature of each institutional trader’s behavior, you will learn if they will be adding shorts on the way up or down. Similar for the long positions.
Overall, this is a quick review of your journey into the realm of data analysis and why you need to understand the positioning of the big players in the market. As I have been using these data series for a long time, I feel my analysis will be incomplete without them. More of this sort of data analysis will come.
If you need further information or want to clarify something, please do not hesitate to drop me a message at [email protected]
Zack
-
Sell Side vs. Buy Side
I mentioned about the importance of understanding the role of sell side vs. the buy side in the previous post. I would like to expand a bit more on this topic because I think it is an important concept which should be understood when analyzing the COT data.
The two categories of sell side and buy side are the common terms used in the investment banking industry. Half of the entire financial market comprised of the sell side entities while the other half belongs to the buy side, very obvious. But what are these two sides of the market? What does it mean to be on the sell side or the buy side?
What is Sell Side? What is Buy Side?
Sell Side is the commonly used term for the firms and institutions that facilitate the decision making process for the Buy Side.
Buy Side are the firms and entities who actually make the investment decisions for either themselves or their clients.
The Sell side is comprised of the firms including investment bankers, commercial bankers, large corporations which physical assets, stock brokers and market makers.
The But Side includes the money and asset managers, hedge funds, institutional and retail investors.
Structure of the firms
On the Sell Side, the structure of the firm consists of the director, vice president, associate and analyst. On the other hand, the Buy side firms have marketing people, researchers/analysts and portfolio managers.
The role of each side is what makes it very important to understand when looking at the CFTC reports. The Sell Side is the one who monitors the performance of each asset class and individual assets, creates models based on the data to predict future performance and makes recommendation and target prices. In brief, the Sell Side promotes their idea in order to sell them to the Buy Side. These ideas are often publicly available for FREE. This is an important bit.
The Buy Side utilizes the ideas from the Sell Side as well as the public recommendation by the Sell Side, and also does their own analysis to come up with their investment decisions. The results of the Buy Side analysis and research are NOT public. It is only available to their clients. So, weather the Buy Side decides against the Sell Side recommendation, or when they do and do not decide to act on the Sell Side recommendation remains unknown until they make that decision. In other words, we only see the results of their research after they make that decision. That is the essence of understanding the role of institutional traders when looking at the chart data and analyzing the position size reports. We ONLY see the aftermath of the Buy Side decision process.
Think about it
So whenever you see an analyst recommendation or a bank report on the future performance of a certain currency or stock, think about it in terms of the interaction between the two sides of the market. For example, when Citi Bank says the CAD has still some potential to the upside, i.e. sell the USDCAD, it does not mean that they are not telling the truth. It also does not mean that you sell USDCAD right now. All it means that the Citi analysts have done their research and still see some potential in CAD. They obviously have a potential client which benefits from selling the CAD. It could be a big corporation with some business in CAD and wants to hedge against its risks by selling the CAD. So they need to find buyers. You and I and every retail traders are not the main target. They are presenting their research results to capture the Buy Side’s interest. If you are a money manager and also think there is upside potential in CAD, would you buy right now? With a large amount of money at risk and under management, you rather wait for the right price to get long in CAD, or sell the USDCAD.
This is a hypothetical example and only represents a thought process when hearing such recommendation. All you need be aware of is the dynamics of the financial market and how the two sides think about their goals. Thinking in the mind of these big institutional traders is always a good practice to perform on a routine basis. It will help change your mindset on the long term.
Zack
-
Traders in Financial Futures and Disaggregated Formats -New COT Format
In the previous post, I went over introducing the CFTC and the role it plays in bringing more clarity to the public from the futures trading world. The conventional style of reporting is the legacy report which I explain briefly in that post.
Since early 2010, CFTC decided to bring more transparency to the reporting methodology of the large institutions by introducing the Traders in Financial Futures (TFF) report. This is essentially a breakdown of the two major categories, commercials and non-commercials into four separate categories depending on the nature of their business. The CFTC staff use the Form 40 which is submitted by the large traders to determine the appropriate classification of each traders. This new format was created due to the fact that some of these large institutions have separate trading entities for handling different parts of their businesses and therefore, require separate analysis. More details about the TFF report can be found here.
In summary, the new TFF report divides traders into 4 major categories as follows:
Dealer/IntermediaryAsset ManagerLeveraged FundsOther Reportable
In their explanatory notes, CFTC specifically splits the traders into two types based on their function in the whole market structure. A trader is either on the “buy side” or the “sell side” of the market. The first group, Dealer, is on the sell side while the rest of 3 are on the buy side. I encourage you to read these explanatory notes which provide useful information about the definition of these 4 categories. I copy some of these notes here for convenience:
From CFTC explanatory notes:
“The category called “dealer/intermediary,” for instance, represents sell side participants. Typically, these are dealers and intermediaries that earn commissions on selling financial products, capturing bid/offer spreads and otherwise accommodating clients. The remaining three categories (“asset manager/institutional;” “leveraged funds;” and “other reportables”) represent the buy side participants. These are essentially clients of the sell side participants who use the markets to invest, hedge, manage risk, speculate or change the term structure or duration of their assets.”
While there are some commonalities between the legacy and new TFF format, CFTC specifies that the traders in each of these 4 categories could have been drawn from either commercials or non-commercials classifications in the legacy report. The new TFF format is intended to provide more clarity on the role of each trader and is therefore, more informative. However, many forex traders still use the legacy format because it gives them enough clarity and removes the complexities involved in the new TFF format.
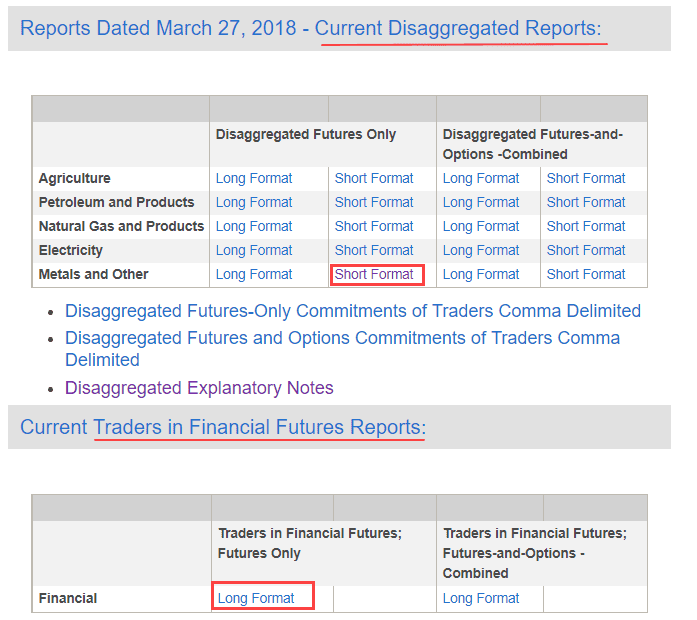
Where to find the new formats of COT reports?
Above the legacy reports part, you can find the reports for the new disaggregated (see more below) and TFF format. See picture below:
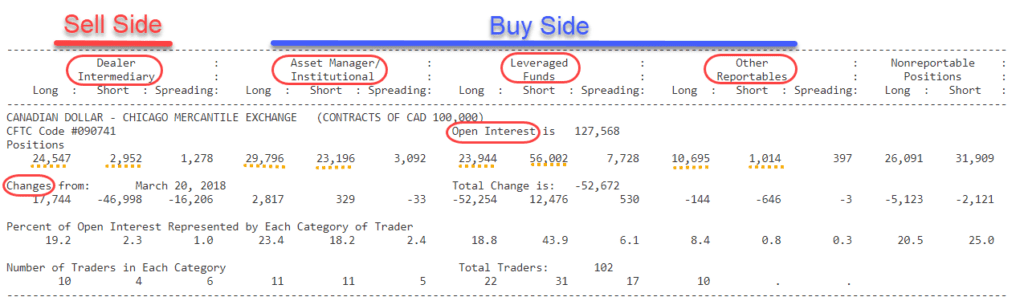
Below is an example of the TFF report for the CAD:
As you can see, this is similar to the legacy COT format with only different categories. The long and short position as well as the changes in those positions compared to the last week and open interest are reported for each class of traders. Similar conclusions can be drawn from these number as to what I explained in the previous post.
Along the same line of action, CFTC created a new format of reporting the commodity positions under the title of “disaggregated COT”. Similar to the TFF report, this is intended to bring more clarity to the role of traders in the commodity sector. See the explanatory notes for this form of report here.
The major four categories are as follows:
Producer/Merchant/Processor/UserSwap DealersManaged MoneyOther Reportables
The explanations regarding the definition of each category is provided by CFTC in their explanatory notes. I encourage you to read over these definitions just get an idea of their roles in the market. Below I copied the main difference between the legacy and disaggregated COT forms according to CFTC:
“The legacy COT reports divide reportable traders into the two broad categories of “commercial” and “non-commercial.” The “commercial” trader category has always included producers, merchants, processors and users of the physical commodity who manage their business risks by hedging. It has also included swap dealers that may have incurred a risk in the over-the-counter (OTC) market and then offset that risk in the futures markets, regardless of whether their OTC counterparty was a commercial trader or a speculator. Those two categories of what has been reported as “commercial” traders are separately reported in the Disaggregated COT. The “non-commercial” category of the legacy COT included professional money managers (CTAs, CPOs, and hedge funds) as well as a wide array of other non-commercial (speculative) traders. These two categories of what has been reported as “non-commercial” traders are separately reported as “money managers” and “other reportables” in the Disaggregated COT.”
As you can see, the old commercial traders have been divided into two groups of producers and swap dealers. The non-commercial traders have been split into money managers and other reportables.
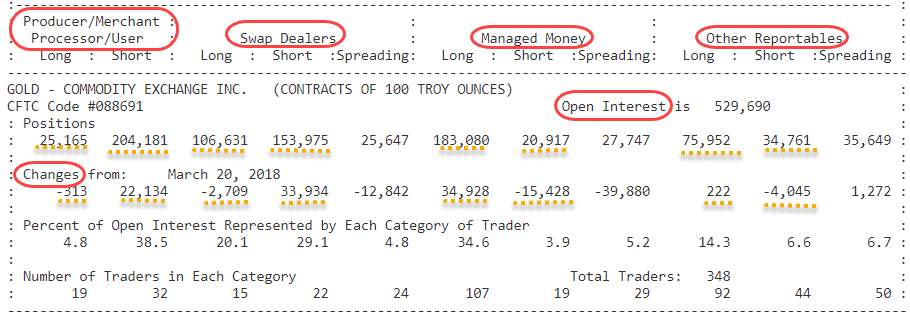
Below is an example of the disaggregated report for Gold:
The format is similar to the legacy report with only different categories of traders. In fact, you can sum the positions of the first two categories (producers and swap dealers) to reach the same number as the commercial traders.
While these new types of reports provide somewhat more clarity on the nature of different institutions and their impact on the forex market, looking at a single report does not provide sufficient data to make any useful conclusions about the next move in the market. Looking back at the past data instead, can provide some useful information on what each type of trader has done and what they might do in the future. This is where the data analysis on the past report plays an important role. The COT data analysis methodologies are the subject of my future posts. We will go over some basic concepts as well as more advanced analysis in the upcoming posts.
There is another important concept which needs further attention before we jump into the details of data analysis. It is the role of two side of the market structure, sell side vs. buy side. This seemingly simple concept has not found enough attention among retail traders. However, I feel some basic understanding of these two sides of the market is necessary when analyzing the COT report along your forex trading career. In the next post, I will discuss in brief about this important concept.
Zack
-
Information about Big Players’ Trades-COT
I have mentioned about the importance of following what the Big Players are doing over and over in my book and here in our forum. As I mentioned in the previous post, the chart is the first and most trustworthy source that provides information about the actions of the institutions. Many things can be learned by just looking at the right places on the chart. As you see in this post, the large body candles are the most prominent features that should be paid attention to. However, the method of approaching towards a possible reversal zone is also important as I explained in the book.
There is also another piece of information which contains useful information and is readily available to the public. Every week, the Commodity Futures Trading Commission (CFTC) releases data about the size of trades taken by the large institutions. These large institutions are required to report their above certain size positions on futures of certain commodities, indices and currencies on a daily basis. The CFTC then compiles all these data up to each Tuesday of the week and release to public at the end of Friday trading day around 3:30PM EST. Why would they do that? “To help the public understand market dynamics” they say on their website. This report is referred to as the Commitments of Traders (COT).
Where to find the reports?
Open the CFTC website here and head to the Market Data & Analysis tab and select the Commitments of Traders. There page contains all the necessary information and explanatory notes for further study and understanding the terminology. Below is a snapshot of the current layout of the COT page which was changed a year or two back:
Important parts of this page are the explanations as well access to the historical data dating back to 1986.
The CFTC provides this information in a categorized format (as categorized as they can) based on the purpose of each trader when opening these positions. The nature of each trader's business which is also reported to CFTC determines the dominant classification of each institution. In its most conventional format, the Legacy report is what has been around since almost the beginning. Scroll down the page to see the types of reports and some explanations related to each classification:
In the legacy report, there are two major classifications of traders: Commercials vs. Non-Commercials. The internet if loaded with information about the role of each class in moving the price and how they operate. I want to keep my post short so I keep it brief. Commercial traders are those who are “engaged in business activities hedged by the use of the futures or option market” according to CFTC. This group includes the large producers of commodities or financial institutions hedging against future prices. These are the people who actually sell their products in the market at high price and buy it back at a lower price. In essence, these are the people who know the most about their products and what those products are worth.
On the other side of the market, there are non-commercial traders who are often referred to as “large speculators”. These are the institutions such as banks, investment and money managers and hedge funds who take the other side (buy side) of trade. These entities are highly profit driven and speculate on the future prices. They tend to be trend followers and are most bullish at the end of a bull market and most bearish at the end of bear market.
In the legacy report, there is another category called non-reportable. This is referred to as a class of traders who their position size does not meet the CFTC criteria. Essentially these are “small speculators” who are often on the wrong side of the trade. That being said, the numbers in this category represent the “retail” sentiment since you and I also part of the retail traders. Similar to the non-commercials, these are also trend followers and due to the smaller size of their positions, they can change their positions in much faster way than the large speculators.
Another important piece of information in the legacy report is the “open Interest”. This is the total number of futures contract entered into the market. Think of it as the total number of shares outstanding during each week [in the world of stock trading]. It could be seen as a gauge of the market sentiment.
Where to get the legacy COT report?
Scroll down the page until you see the table titled “Currency Legacy Report”. The table looks like the picture below. The Chicago Mercantile Exchange (CME) is where you find the most relevant report for currencies and commodities.
What does the legacy COT report look like?
The picture below is a snapshot of a legacy report for March 27, 2018 for the GBP. As you scroll down this report, you will see the numbers for futures position of different currencies. This is a text based tabulated file which contains the size of positions (long, short) for each category of traders as well as the change in those positions compared to the last reporting week, the open interest and some other information.
The basic conclusions from this weekly report are as follows:
The net position: the net difference between the long and short positions will tell you the bias direction of each classification of traders. For instance, in the snapshot of the GBP above, the non-commercials are net long (larger size of long vs. short positions). Expectedly, the commercials are on the other side of the trade and are net short. The small speculators or non-reportables also follow the large speculators and are net long.
The change: Another important piece of information is the change in positions from the past week. In the example above, the non-commercials added above 18K contracts to their longs while they only added around 8K to their shorts. By just seeing these two numbers, it is easy to deduce that the non-commercials are adding to their exposure hoping for more upside movement in GBP; they are increasing the percentage of long GBP contracts in their portfolio. The commercials are doing the opposite: they decreased their longs and added to their short. The non-reportable group added to their both long and short with longs being slightly higher.
The percent of open interest in each category is also shown in this table. It is simply the number of each position divided by the total open interest which signifies the relative size of trades in each category.
Is this information enough to make decisions for the upcoming week?
There are many articles regarding the fact that the COT is not much useful because it comes with a delay. The information belongs to the past week and what might have happened has already happened. That is a true statement when looking at the price in a short-term perspective. You CANNOT make intraday decisions based on the COT report.
Also, looking at a single report does not make much of a difference in making trade decisions. It is very helpful to know whether if the big institutions have changed their mind within the past week or not. However, such changes do not occur in the period of a week as the size of their positions requires much longer time and much smarter process. I will go over more details of how to utilize the COT data to our advantage in the upcoming posts. We need to cover the basics first and foremost before that though. Next is the new format of reporting the data which has more categories and different structure.
Zack
-
Forex Trading Strategy – Power of Parallel Lines
[With a 240 pips example]
This is a favorite strategy on mine which I cam across with few years ago. I have been testing it for a while now and have seen tremendous potential in it. This is why a portion of my book is dedicated to explaining its basics where I showed a real-life example of my trades in the EURUSD pair.
The method has gained significant attention since a guy named Alan Andrews started compiling findings of several people who used similar concepts in the past and came up with his own method. Hence, the name Andrews’ pitchfork was coined. In its core, the method relies on the key concept of balance and imbalance in the market. If you go over the chart of any instrument being a forex pair or stock chart, you could find a “median line” around which the price clearly fluctuates. The price might go above and below the median line, but it always comes back to it as if the line is a magnet.
Personally, I got interested in this method because it relies on this fundamental concept of the market. There is always a price where the buyers and sellers are somewhat in agreement for a certain period of time. It has much deeper implications if you think of it in terms of economics of that instrument for the institutions that are controlling its movements in order to meet certain criteria in their financial books. In short, the median line is there for a reason, and it IS NOT because it is a good looking trendline respected by many traders. This is an important concept which most retail traders do not pay attention to. Instead, retail traders see the Andrews’ pitchfork on a trader’s chart and think “oh, I can draw that”; I let the rest of story to remain untold. See an example of a fork below:
Essentially, the chart is split into two regions: below or above the median. The market intends to remain above the median line as long as it is economically feasible (to the big players in the market of course). So, you want to trade above the median line as much as you can during this period. Once the market giants decide to move the price below the median line, you also want to trade with them below the line. The high and low swing lines are there to indicate market extremes. The bigger theme is determined by the direction of this median line. So, if are trading against the overall theme, be prepared to position yourself in a way to minimize your risk, and not to get stopped out preferably. Key point: these are not rigid and unbreakable lines so' so don't treat as such.
I went over the details of this method in the book, so I keep it short by only showing another example that I recently tried on EURCAD.
Here is an example of how I positioned my trades in an area where I thought institutions would start re-adjusting their accounts towards the general theme of the market. That is in the long direction.
As you can see, I spread out my trades to minimize the risk and maximize profit. The trade went against me for a few days so be prepared for emotional times. Always remember: trust yourself and be patient.
Two key findings which I like to point out when looking at this chart are as follows:
The institutions clearly decided to dump their long positions and added serious short orders judged by the large body candle you see at the time I placed my limit buy orders. So, I have that in mind when I place my buy orders. I cannot expect the price to go above that level because these big players most likely have more short orders to fill. They also do not flood the market with all their short orders at once. That is just not possible.
There is another set of large body bullish candles at the left side of the chart at the touch of the low line. This is where the institutions added to their longs. In order for them to reduce their long exposure, one big drop does not cut it. They most likely pump the price further up and slowly reduce their long exposure.Knowing these key concepts, I would not get out of my long trades unless the prices shot through the previous low level. And that is not something that happens often in the forex market. We are talking about the exchange rate between two G10 currencies.
I waited over the time when institutions positioned themselves to have another push higher. I used the large body bearish candle and the median line as my exit points. Overall profit of 240 pips was reasonable for me so I closed the trade.
I hope you could see that there are times when you doubt yourself and analysis and want to close your trades so that you don’t see those big negative numbers in your terminal. If you have learned the key fundamental concepts, have thought about the dynamics of the market and made your decision, do not give up on yourself. Let the market to prove you wrong. It is normal and OK to make mistake. Every mistake is an important lesson so learn from it. Manage your risk and position your trades in a way that you can absorb the necessary pain to succeed.
Zack
-
Supply and Demand – The Only Force
As I mentioned in my previous posts, the only force that moves the value (or price) of anything in our lives is the Supply and Demand.
Do a quick google search on Supply and Demand Trading right now, and I bet you would be reading pages and pages of useful materials on the internet. This is not a secret methodology of trading that I, or any trader alive have discovered very recently. This is a concept that people have been aware of for centuries.
How to use Supply and Demand in our daily trading?
If you have read my book and the previous post, you might have some hints about this type of trading. Without getting into the basics, I want to clarify one important concept.
YOU and I and perhaps every retail trader like us, DO NOT create the Supply and Demand in the forex market. We have no impact in the overall picture of the market for that matter. You might argue that is not 100% true, and you could be right. I believe that in a marketplace where the average daily turnover is about $4 trillion (according to the Bank of International Settlements, BIS) in April 2013 and $5.3 trillion based on BIS report in 2014, it is extremely unlikely that a retail trader can have any impact in such a daily volume. About 90% of this daily volume is controlled by the large financial institutions such as asset managements and hedge funds.
Side Note: About 75% of this trading volume is conducted in the G10 currency pairs, i.e. the major pairs you can all name as the usual suspects.
Side Note: Check out the daily size of the stock markets in North America and across the world (here, here and here) to get some perspective of the forex market size.
Back to Supply and Demand Trading: key point that many traders forget when following the Supply and Demand methodology, or Supply and Demand traders, is that identifying a supply and demand “zone” is not something that is done mechanically.
Note: I hope you have read about the “zone” either in the book or other online sources. The supply or demand occurs within a zone, or a range, rather than a single level (such as support and resistance)
It is important to realize that highlighting an area off a big body candle does not always tell the whole story. Such large candles do indicate the presence of an “imbalance” between the buyers and sellers. However, does that mean we can use a zone to place trade in our advantage? Yes and No.
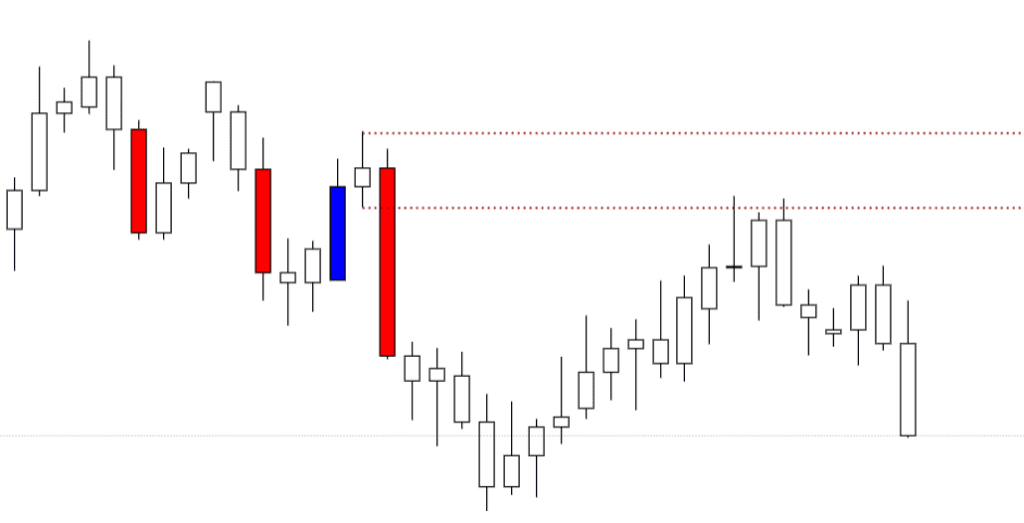
Yes, because you can always count on the massive amount of orders being left “unfilled” during the creation of a big body candle. See the image below as an example:
You would place a short somewhere near the supply zone based on the red big body candle, and yes you would have made good profit from it. But how about the two other big candles on its left? How about a long order based on the blue candle?
These are all questions that come up in your daily forex trading life. And I can tell you that there is no certain answer to any of these questions. The forex trading is the game of probabilities. You place your orders based on the statistical data you have in your hand. So, the more data you have, the better you can evaluate the probability.
The chart has it all!
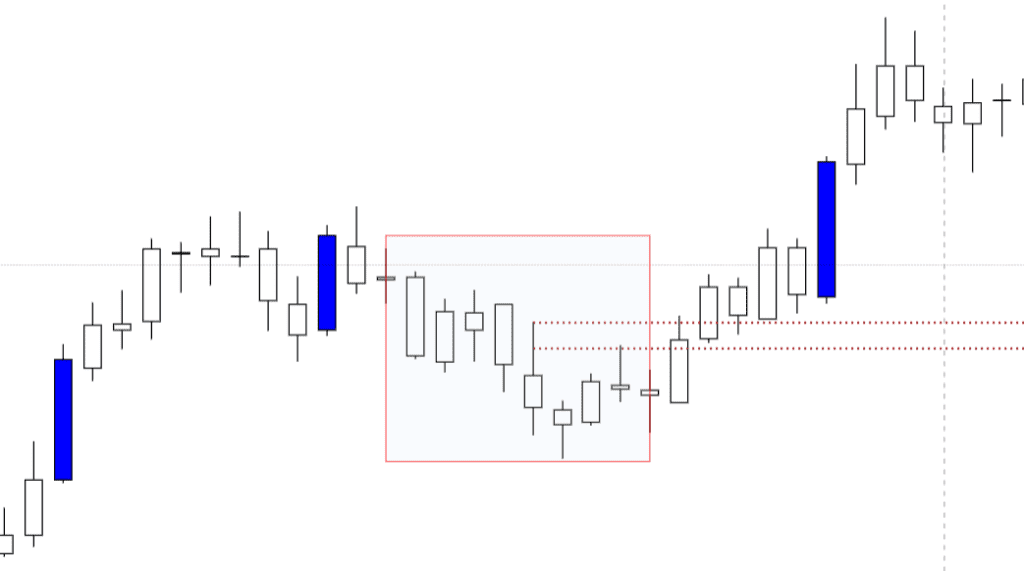
As I have mentioned before, the chart is your first source of information. The fact that a big move from a certain level has happened in the near past, does mean that some institutional orders have been placed in the marketplace. We can certainly benefit from these unfilled orders next time the price reaches such levels. But how far? Have a look at the same chart from a different perspective, i.e. a higher time frame:
Think about what happened over the time period indicated by the red box in this image. The box resembles the exact area that was shown in the previous image. Do you see what happened? In this chart, you only see three giant blue candles. Think of them as the "dinosaur’s footprints" as they moved across the forest. These are “smart” dinosaurs. They created that area shown in the box only to place their foot one step ahead.
To put all these in perspective, do not underestimate the power of multiple timeframe (TF) analysis. Also, do not overanalyze, 3 TFs is enough to give you the overall theme.
I also mentioned “more data” is always good. By that, I DO NOT mean adding more indicators to your chart. I meant looking at the actual footage of the institutional orders. More of this concept will come in the next posts.
Zack
-
Thank you for your feedback.
The knowledge sessions are in the works, will happen in the coming weeks. Go over the book, practice with demo account and learn the basics. There is much more in forex trading, so your basic knowledge is necessary.
Zack
-
MT4 Tricks- One Click Trading
Metatrader 4 or MT4 is the most common platform for trading forex and commodity futures. It is free and normally comes with the registration in your broker of choice. Although it is possible to use the same platform and use your login information from any broker, it is recommended to stick with the version of MT4 that comes with your registration. In many cases, some pairs or instruments are not tradable when you use an MT4 platform from another broker.
An interesting and extremely useful feature of MT4 platform is its One-Click Trading panel. As the name suggests, it allows placing orders with only one mouse click and avoid typing entry and exit price levels manually.
In most typical cases, you should be able to find this feature upon installation and logging in your MT4 platform. Open a chart and simply click on the smaller down arrow beside the pair symbol at the top left corner of the chart. See below:
Using this panel, you can place “market order” by pressing the buy or sell button with the selection of your lot size.
In some cases, after the MT4 installation, the One-Click Trading feature might not be already activated. In such situations, you can do one of the following two methods to activate it:
Press Alt+t to activate this feature
Go to the Tool>Option>Trade and check the One-Click Trading option. Agree with the terms and you will have the arrow showing near the symbol.Another useful feature of the On-Click Trading is being able to place and move orders on the chart at the desired price. If you have traded long enough, you would know the pain of having to type in the entry levels, and the stoploss and target profit levels. With this option activated, you can right-click and place any type of order being market, limit or stop order. See image below:
On an already opened order, you can click on the order level and drag up and down to define stoploss and target profit right on chart as you see below:
There are some more tips and tricks about the MT4 which I point out in the coming posts. Overall, it is an easy to work application which makes it very easy to trade forex. The particular feature I mentioned in this post is something that I heavily use and rely on for placing my orders.
Zack
-
Thank you magik570.
Audiobook is in production right now.
I will discuss with Andrew regarding your suggestion. Thank you.
The book is "tip of the iceberg" per se. My plan is to expand on it here in our community. More advanced analysis coming.
Z
-
Institution Footprints
Supply and Demand is the only force in the market, everything else is the noise.
We buy “stuff” on a regular basis in our daily lives. Things we need and things we think we need. (George Carlin’s description of “stuff” is much better, so I stop here).
The price of anything we purchase, from our grocery to our iPhone or house, is determined by the fundamentals of supply and demand. A bottle of coke is $2.50 because we are willing to pay $2.50. If 70% of population decides not to pay that much for the coke, then the supplier must decrease the price until the customers come back and buy it. An iPhoneX is $1,000 because we are willing to pay that much for it. If more people want to buy it and Apple cannot increase their production capacity, then the price would have to go up. Because there is demand for it.
Anyhow, our lives are affected by this single rule of economics so why shouldn’t it be the single rule in trading? Trading sits at the extremity of the world we live in where everything has a price. There are no human morality principles in this part of the world. You cannot ask a favor from your broker, imagine this conversation:
You to your broker: Could you do me a favor, close my order at breakeven, I got stuck cleaning the bath tub and forgot to move my stoploss there. I owe you one buddy!
In the case of an institutional trader, supply and demand is THE ONLY game in town. They must buy or sell at the best price or else they lose money. And they NEVER lose! If an institution was willing to pay for an instrument, a stock or currency pair, at a certain price level, what makes them stop doing it again next time?
As I mentioned in previous posts, the only signal you get from institutions is their big orders flooding the market. And you see it on the chart as big body candles similar to what you see here:
This is different way of looking at a chart, there is not green/red or white/black coloring of the normal candlestick charts. I programmed the chart so that it only shows the giant body candles (it’s a code, so there are always flaws). What if you always see the chart this way. What if you have never ever seen the conventional type of chart and this is the first candlestick chart you see in your life. I can assure you that you would think different than 99% of traders in the forex market. Does that mean you would think as an institutional trader? No!
But, you are one level closer to their game than the rest of retail traders. In my opinion, these large body candles are the RESULTS of big players deciding to move the market in a particular direction. Whether it is a direction of their interest or not, is something for future posts. My point here is that you and I, and every single trader in our community all together would not be able to create such a move in the forex market. The key concept here is PROBABILITY!
It is more probable that the giant candles have been create by the institutions rather than retail traders.
So, if you know where an institutional decision has been made, you know where they might make similar decision again. That is the basics of finding the institutional footprints but, there is more to it. My book covers these concepts in more detail and I plan to provide more insights here on our community platform. So, stay tuned and communicate your questions here. I’m more than happy to help in any way I can.
Zack
-
Institutional vs. Retail Traders
This is a topic which has been the main focus of my forex trading career and I always wanted to know the difference between the two categories. In particular, the difference between the mindsets. And I believe it is this single difference that makes us, the retail traders, fall into the game of the institutional traders. I believe the way to trade forex is to think as an institutional trader, see the charts from their perspective and react to the market action in the way they do. My last statement might not be even possible because they create the market action, not us.
Over past years, I have tried to put myself in their shoe and learn where and when they have caused a big market reaction. A BIG MARKET REACTION. That is all you can see from your side of the table. We could never see the actual traders behind the scene who create tops and bottoms, patterns, trendlines, etc. to move around the immense amount of money they possess. All we see is the RESULTS of their big moves AFTER the move has happened. That is the only thing they cannot hide. And how did they get around this big problem? They introduced technical analysis, trendlines, indicators, … to distract retail traders.
You might ask, why would they even need retail traders? If you have looked at the structure of forex market section, you would find the answer. The answer is they need the liquidity. And the structure of forex market provides that. The way the forex market is structured today has come a long way. It is not something that can be created in a year or 10 years. It has been a long and time-consuming journey. But, the internet helped this growth process A LOT! The fact that you and I, as retail traders, can sit behind our computers or cell phones and imagine ourselves trading with a gigantic pool of traders across the world is insane.
With an “unlimited” access to money and a pre-determined agenda, the job of an institutional trader is to create ups and downs in the market in a way that they could force their agenda and fill their massive orders. So, as you can imagine, institutional traders must know everything retail traders know in terms of technical trading and then some more. If you want to trap millions of traders into buying what you want to sell, you must have control over their minds and their decision-making process. You give them indicators. And if you think an institutional trader sits behind a desk and hits buy and sell buttons every minute or hour, think again. It is funny picturing an institutional trader trying to catch a move in the market. If that is not funny to you, this picture should do it.
I am trying to keep my posts short. My key point is that if you want to survive in the forex market, you must change your mindset. See the charts from a different perspective. And you could still benefit from the noise of the market, captured by all indicators and technical analysis because they do work to some extent. I use technical analysis in my short term trading but barely rely on them for long term trades. And the long term trading is what you want to be doing 10, 20 years from now or perhaps for the rest of your life.
Zack
-
Best Times to Trade Forex
Forex market is open 24 hours a day, 5 days a week. So, does that mean you can trade forex throughout the day, wherever in the world you are?
The answer is “it depends”!
It all depends on your style of trading. For a long term trader, the time od the day is irrelevant. Long term forex trades, who are looking for days and weeks of building their positions, the time of the day is not important. However, the times of high volatility serves them the benefit of being able to fill their orders at the price they want, and not at the price market forces them.
In contrast, short term traders are heavily relying on the time of the day. Why?
For this type of trading, high volatility in the market is a must. Another important factor in short term forex trading is the spread. During the times of low volatility, the spread become wider because brokers always have to make money from your trades! So, when the market is volatile?
This image demonstrates a snapshot of major forex markets around the word with their open and close times in both GMT and EST time zones. As one can imagine, the times of overlap are best for ensuring high volatility and low spreads. However, depending on the time of the day, some pairs might be preferred over others. This is the case during the Asian session when the JPY, AUD and NZD pairs are most active. During the London session, all the pairs are tradable. This is due to the big portion of the London market in the entire forex market (about 37% of the entire market). To put in perspective, New York and Tokyo are responsible for 17% and 6% of the overall market share. So, essentially sticking to the London session can be a good choice for starters. The most volatile session is the overlap of the two biggest markets, London and New York. This the most volatile with lowest spread during the day.
So, if you are planning to start short term trading in the forex market, pay attention to these times of overlaps to take advantage of the low spreads.
Another important factor impacting the volatility is the economic news. These are large central banks decisions on the rates, inflation reports, job reports, etc. While the volatility is extremely high during the news release, it does not mean they are tradable in terms of short term trading. The spike in the volatility comes with the large spreads in all the pairs involved and affected. This is also to ensure the brokers make their share of profit during these times. This is more explained in the structure of forex market in our education page as well as our book.
You can find the information regarding the exact time of these news release, the expected numbers and previous release number in many forex news outlets. Common outlets that I use on my PC and mobile are listed below:
https://www.myfxbook.com/en/forex-economic-calendar
https://www.dailyfx.com/calendar
Zack
-
Short vs. Long Term Forex Trading
There are two general styles of forex trading, which are distinguished by their time periods: short term trading (similar to day trading and scalping) and long term trading (similar to swing trading or position trading). For someone new to trading who has only heard about the wall street in the movies or news, the idea of trading most likely is something close to the long term trading style. This style of trading includes buying or selling a security, stock, or a currency pair over a relatively extended period of time. What is a relatively extended period? It depends. For a stock, a swing trade could take a few hours, days and even months. The goal is to benefit from the long-term swings in the price without worrying too much about the noises in the minute charts. A swing trader would open a trade with a defined stop loss appropriate to the trade timeframe. They would perhaps check on the status of the trade once a day and analyze the market sentiment. In the case of a good opportunity, they could add to their position to maximize profit. They would eventually exit the trade once they have made their target profit.
In the forex, swing or long term trading could expand from 30 minutes to hours and few days. There is also another category of traders with this style who are “position traders”. They add to their position along the way and watch the market carefully to extend their profit for months or even as long as a year.
In contrast to the first style, day trading or short term trading has different implications. A big portion of BearBullTraders community are focused on day trading in stocks and many useful materials could be found in our community online platform.
In forex, short term trading has a similar definition. Based on the time of the day, such as London market, New York market or Tokyo market, forex traders choose to trade only in these volatile sessions. They often open and close trades within few minutes (usually less than an hour). A subcategory of the day trading style is “scalping”. Scalpers are those who benefit from any small movement in the price action. They enter and exit a trade within seconds and at most a few minutes. This style of trading requires a large amount of capital or leverage, besides uninterrupted presence in front of the trading station.
Both styles of trading have their own pros and cons. I trade both styles and try to post my ideas in the forex trade ideas section of our forum. My personal preference is long term trading because it matches my life style and requires less intense and spread out attention.
Zack
-
My Forex Trading Journey
The world of foreign exchange trading or forex trading is not much different from other types of trading such as the stock market, the housing market or any asset or equity trading. I was introduced to this world a while back in mid-2009 when the whole world of finance seemed to be falling apart.
I was a science student in a PhD program between 2008 and 2012, like many PhD students, I was always curious about how things work. It had become a habit for me not to be afraid of any new concept, either a pure scientific problem or a real-life ordinary event. The path I have chosen for my life and career has made curiosity and learning a normal item of my daily routine. The financial markets and stock market came up on my radar multiple times during routine conversations with friends, and so, as with any other topic, I started searching online about it, reading blogs and “free” documents (I was a student, remember?) and watching YouTube videos. After a few months of studying, I decided I was ready to go my bank and open an investment account. I quickly got into my demo account and started replicating in my trading all the trading strategies I’d learned about. It was mostly swing trading at that time. Indicators, and in particular those with the most complex mathematical formula and their cross correlations with each other, were fascinating to me. Once I became confident in myself, I put in $500 that I saved from an on-campus part-time job. Getting into real trading quickly, rather than spending months and years on demo account, was one of the best things I have done, even considering the eventual results. Unfortunately, and probably predictably, my account kept going up and down, and it didn’t take long before my commissions caught up with me. I closed that account with only $100 left in it.
But I refused to let go, and I started back on the demo. What irritated me the most was how indicators can contradict one another. Whenever a trade did not go my way, I could justify it in terms of another indicator that I discovered later. That might sound familiar to many of you. My problem was that I was not used to this type of illogical methodology and this peculiar approach to decision making. After all, my main daily job was to design systematic methodologies to test a hypothesis, to analyze the data, to correct my method, to develop solid theories and, of course, to publish them in academic journals. That last part, incidentally, is not easy, because these journal articles are evaluated by at least three leading scientists around the world before getting published. I have been doing this for a good part my life, so figuring out why things work the way they do has been part of my way of living. Honestly, I do not know much else because I have not been trained for anything else.
I got back on the stock market, trading back and forth, until the day a friend came to me and asked me about forex. I had only heard about it and had no idea how forex trading works. It was a new concept to me, so again I started searching and learning. I remember the first time I opened the metatrader 4 (MT4) platform. I almost fainted. I thought to myself, “Do I have to learn all these crazy indicators and understand all these lines that show up in the default setting of MT4?”
This is where my story begins. In the coming forum posts, I will go over the steps I took, from the most basic tasks like opening an account right up to the trading strategies I use these days.
Zack


FX Trade Analysis: EURUSD-May-15-2018
in Forex Trade Ideas
Posted
EURUSD Analysis based on May-15-18 COT Report
I walk along the same beach most days. Now the beach clears my mind without me even knowing it.
Despite breaking few demand zones, I still cannot make a bearish case for it. I need to see more zones being broken before making that decision. Which is why I am still adding to my longs while keeping the short trade open incurring more profits on it.
Here is the snapshot of my analysis on EUR based on May 15th COT data. The trades opened based on that analysis are posted here.
For more information on this type of analysis check out the previous posts in the education section of the forum here, here, and there.
If you want to discuss further and clarify things, please send me a message to [email protected]
Zack