

Zack Zarr
-
Content Count
128 -
Joined
-
Last visited
-
Days Won
1
Posts posted by Zack Zarr
-
-
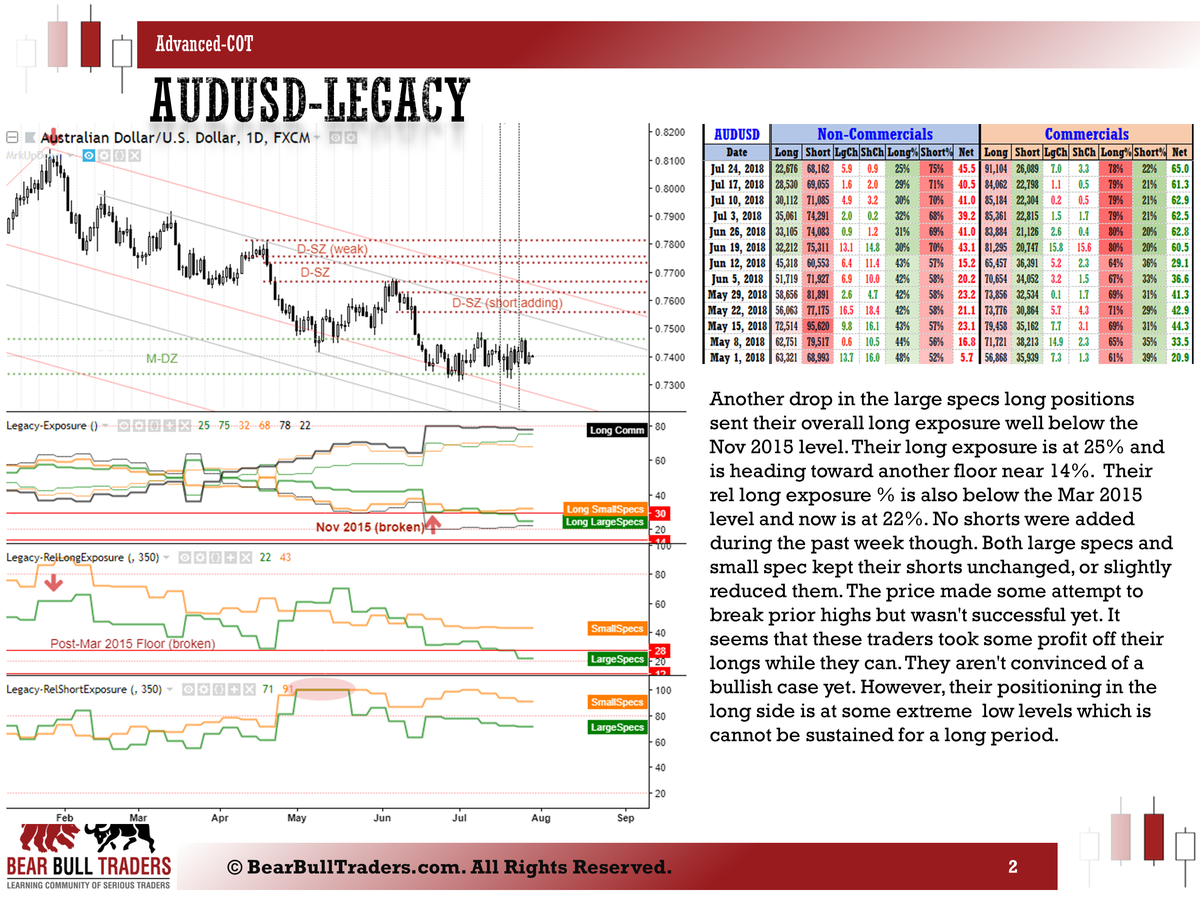
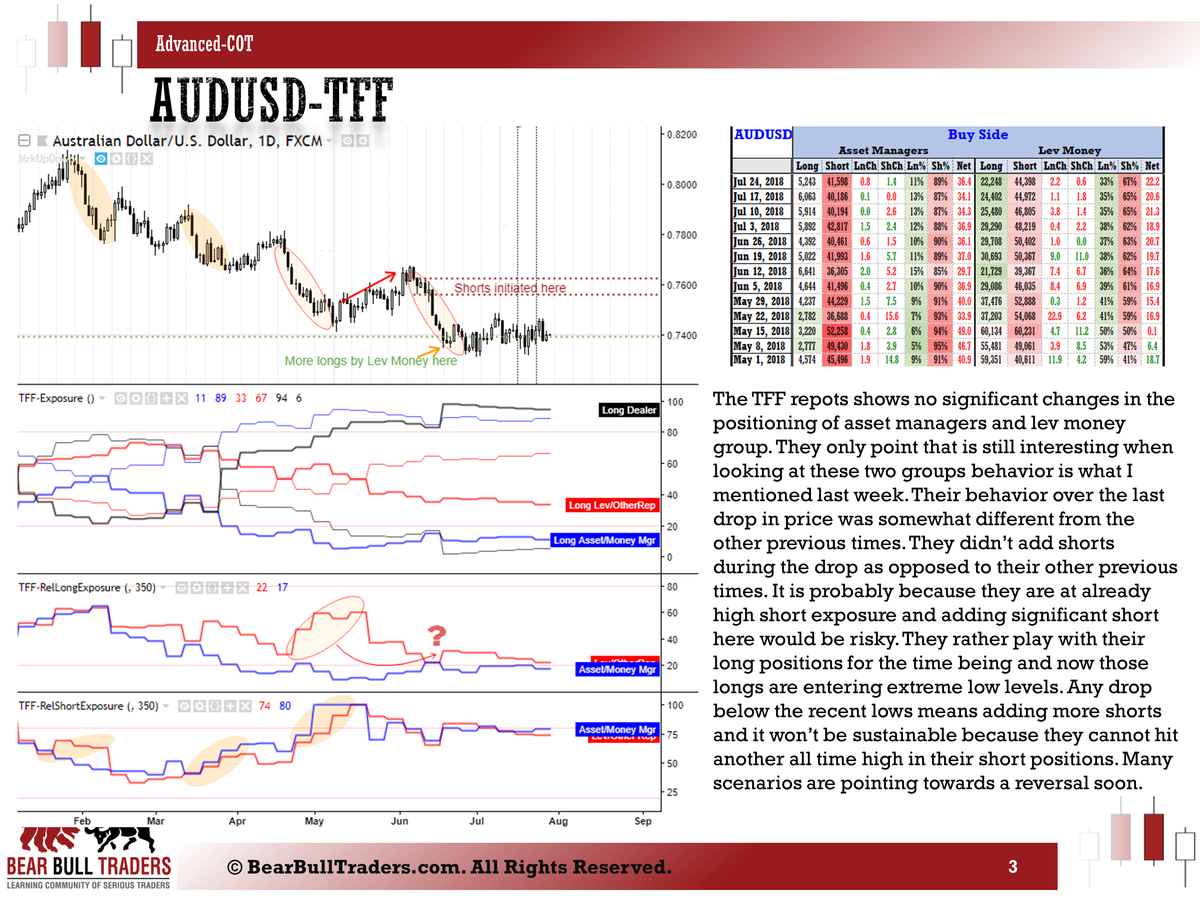
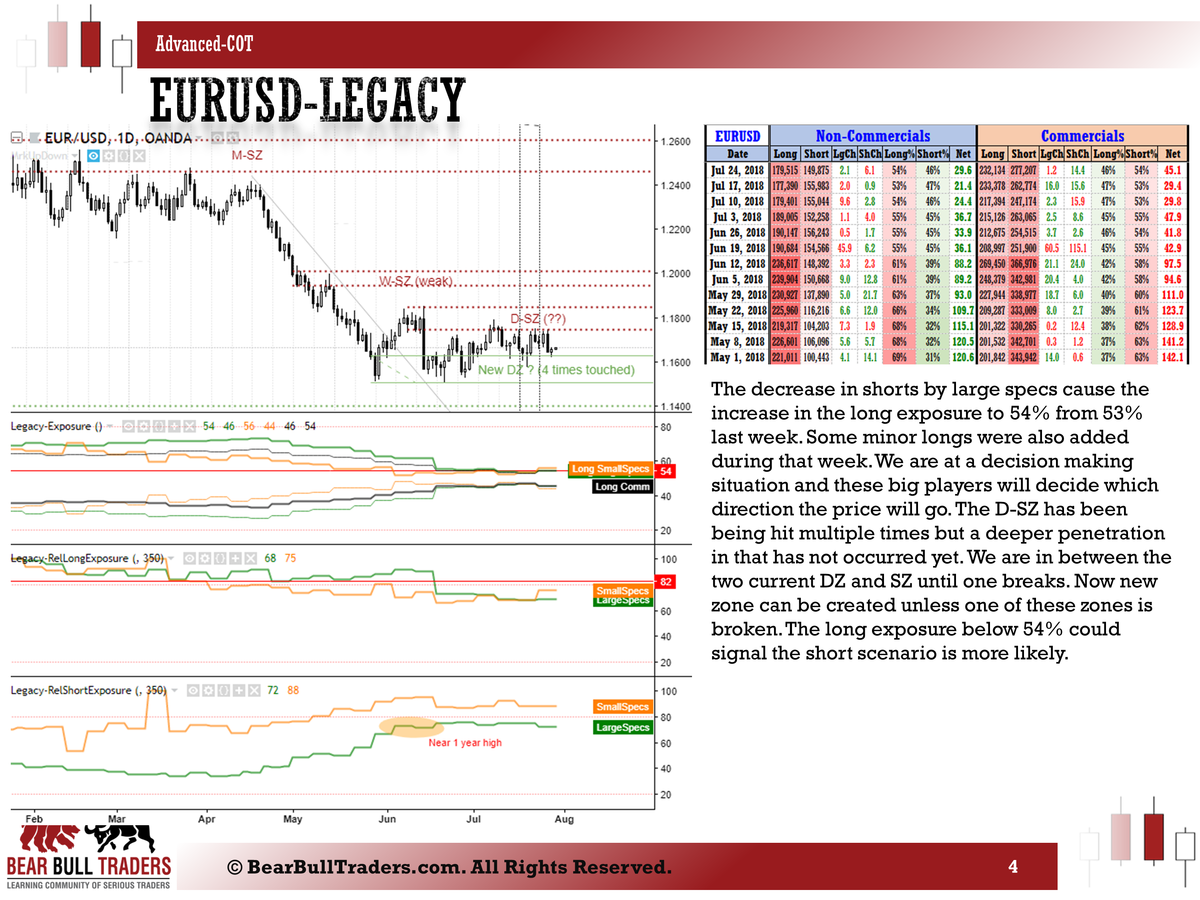
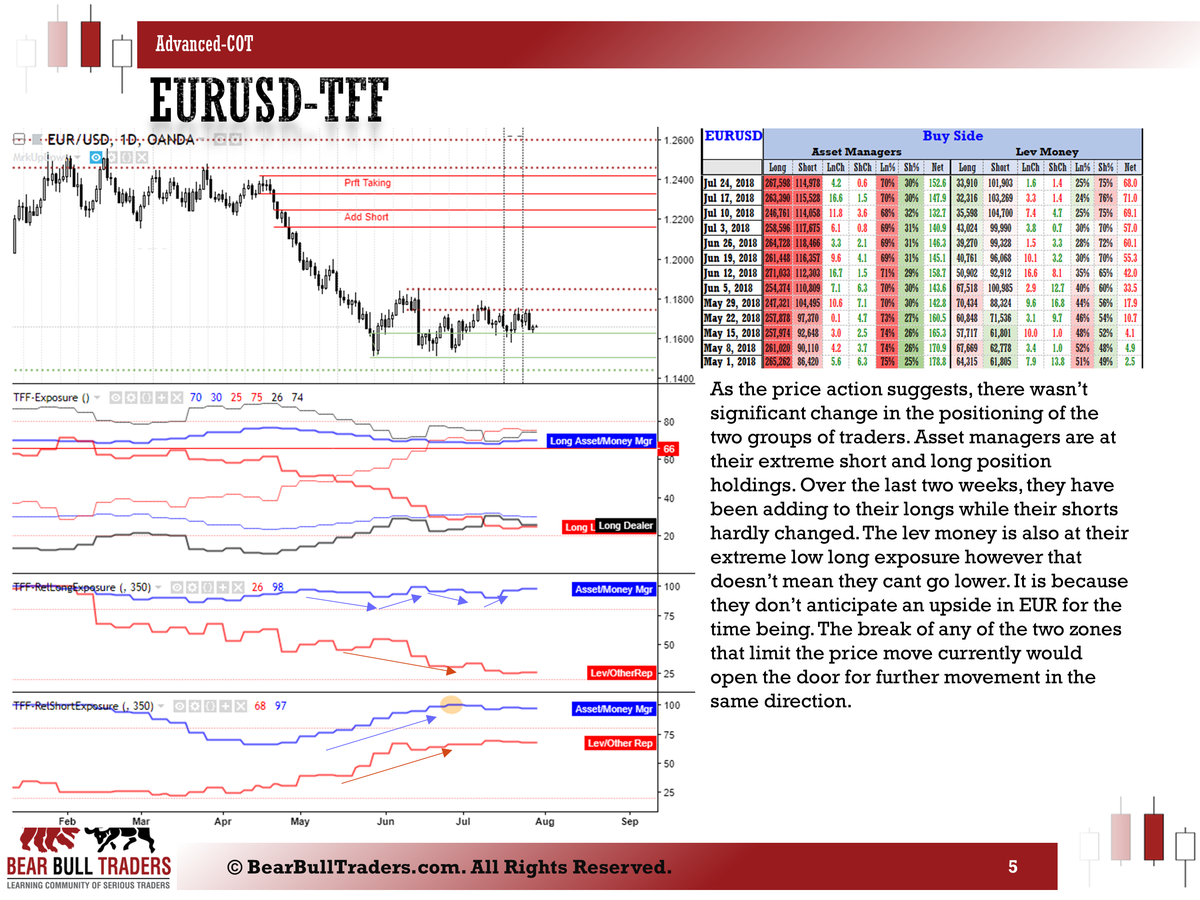
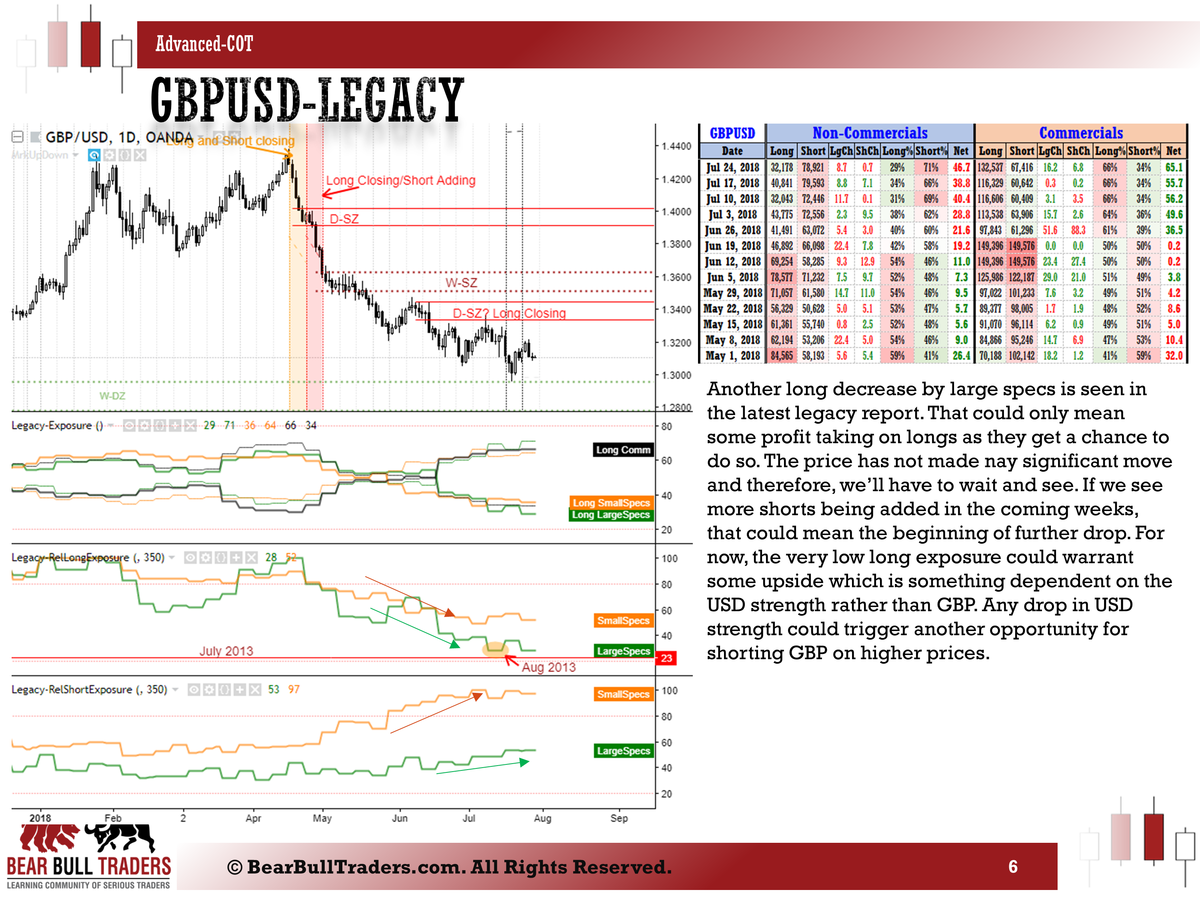
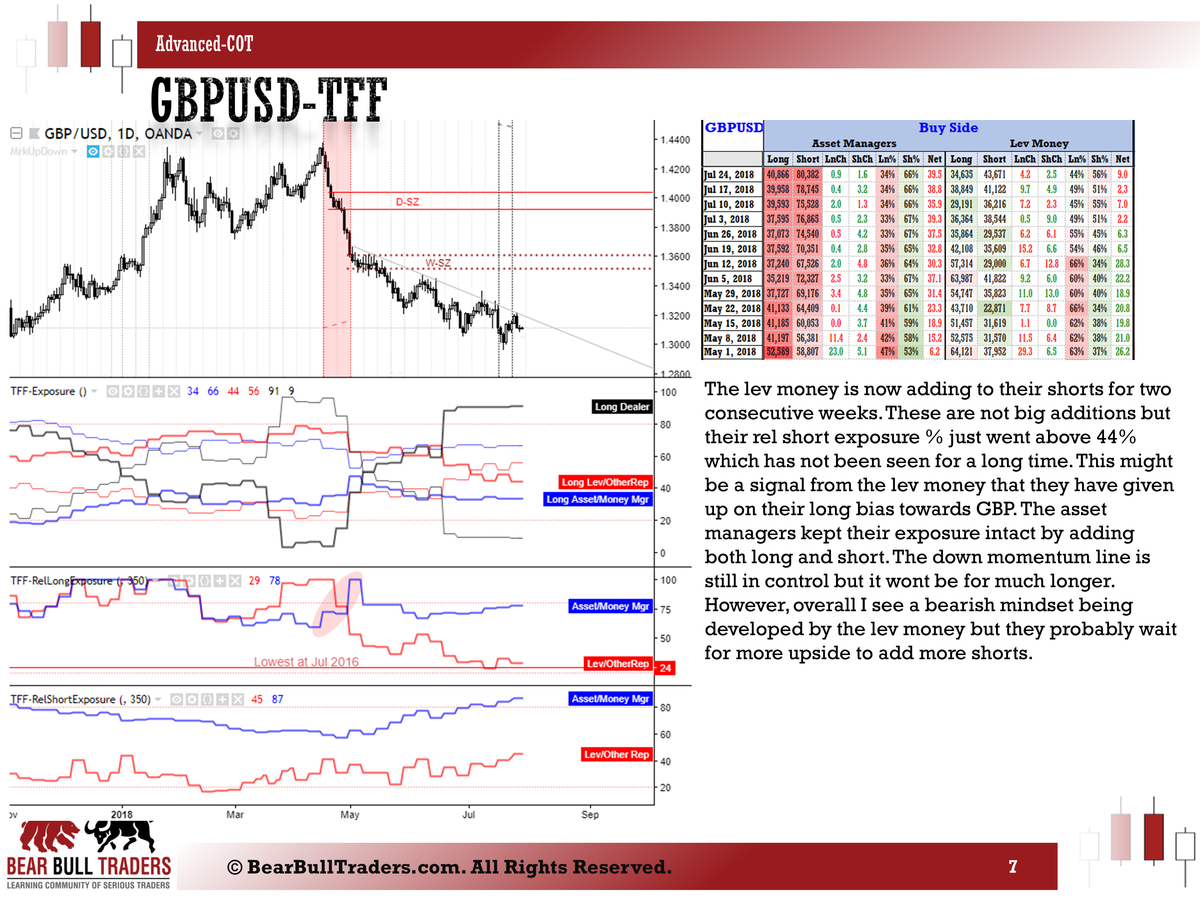
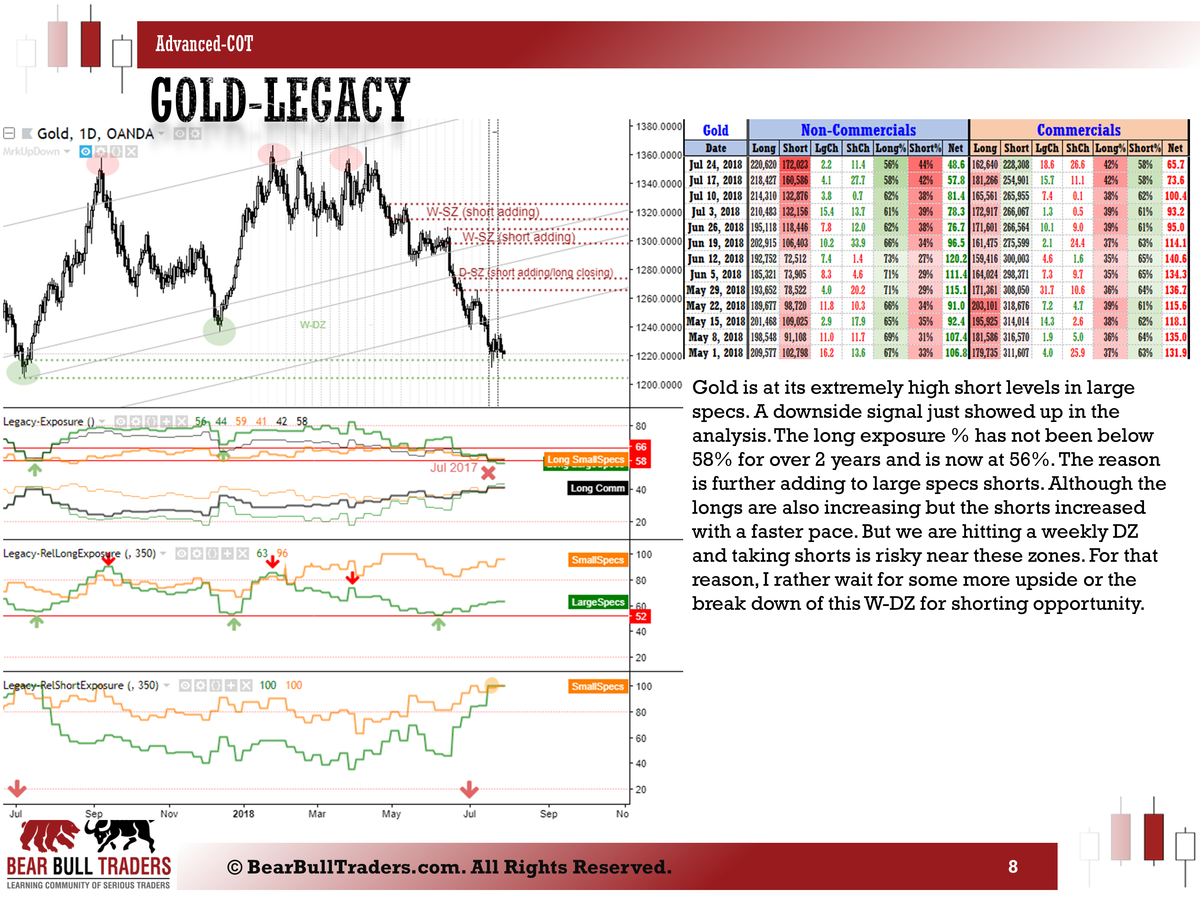
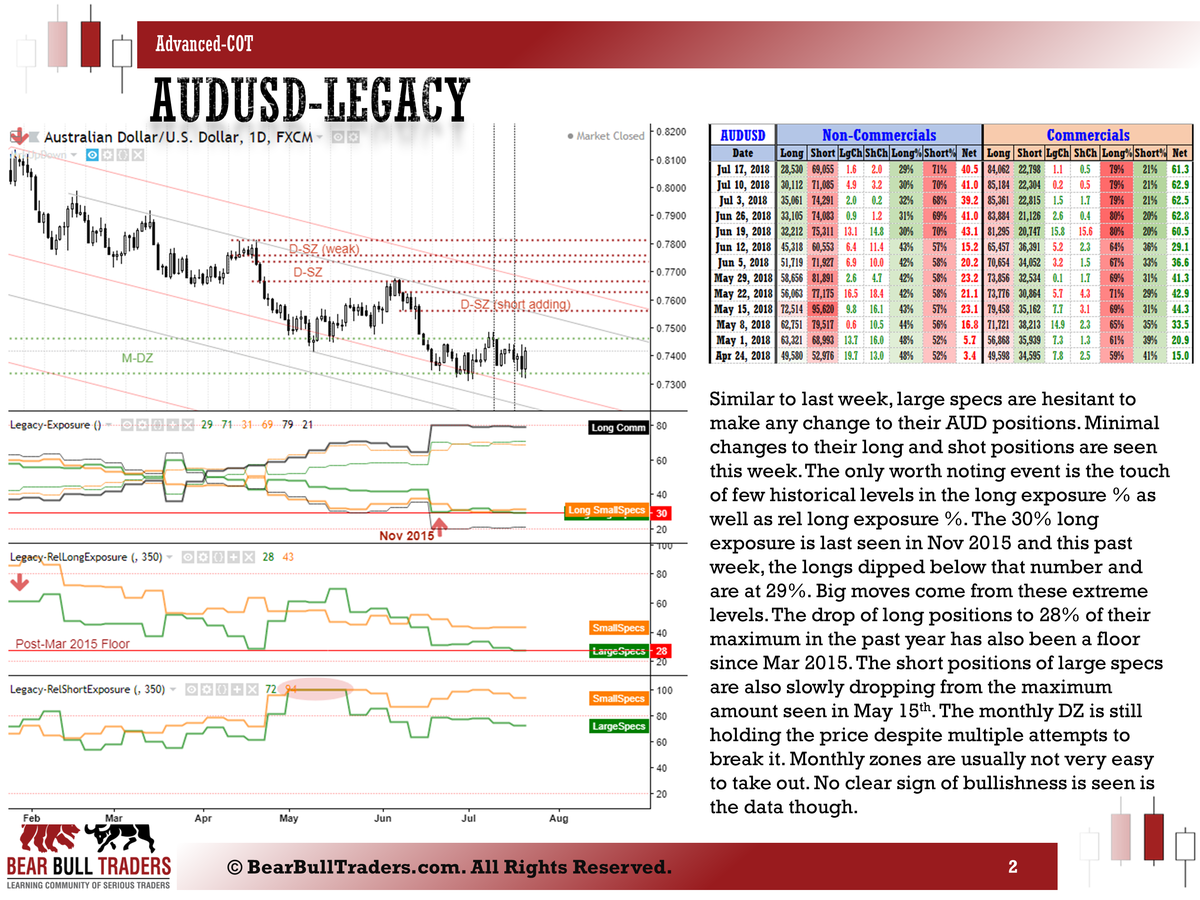
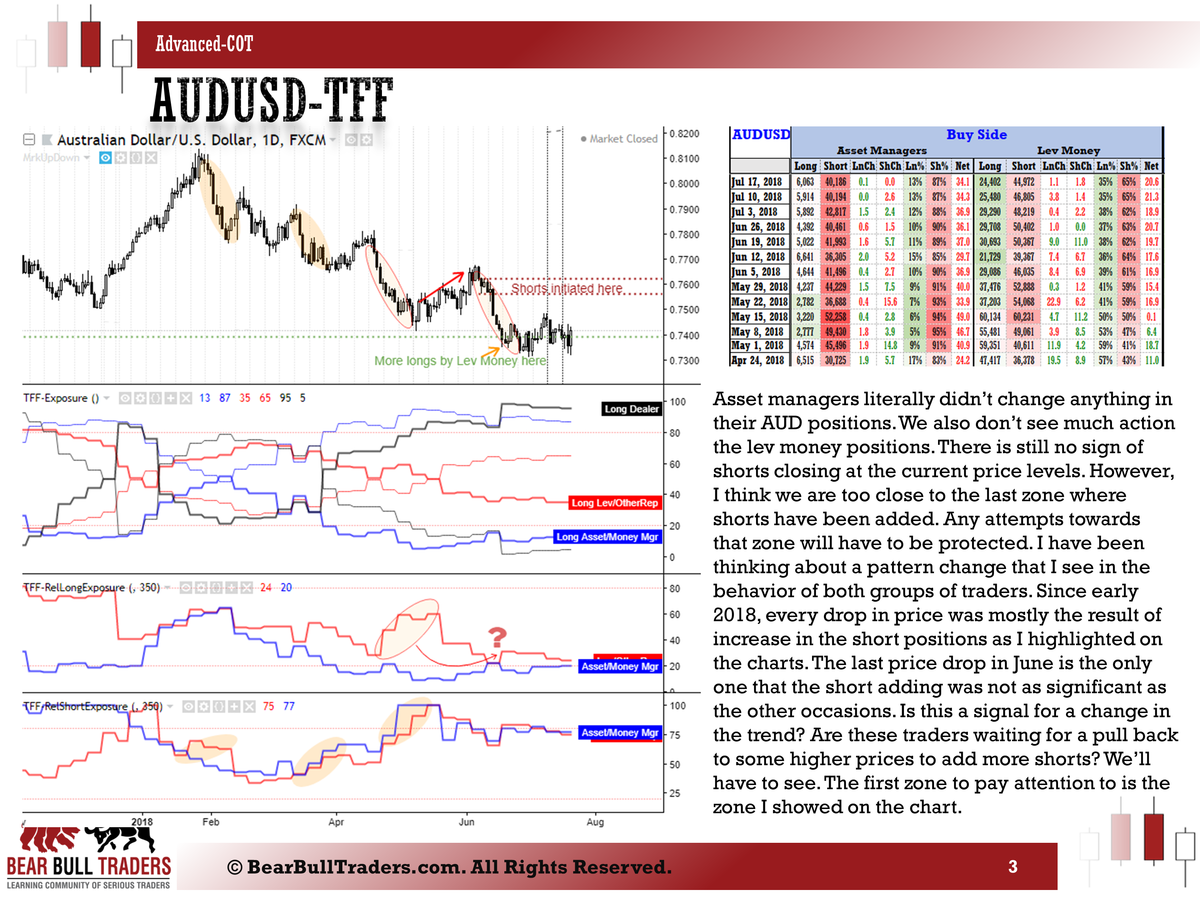
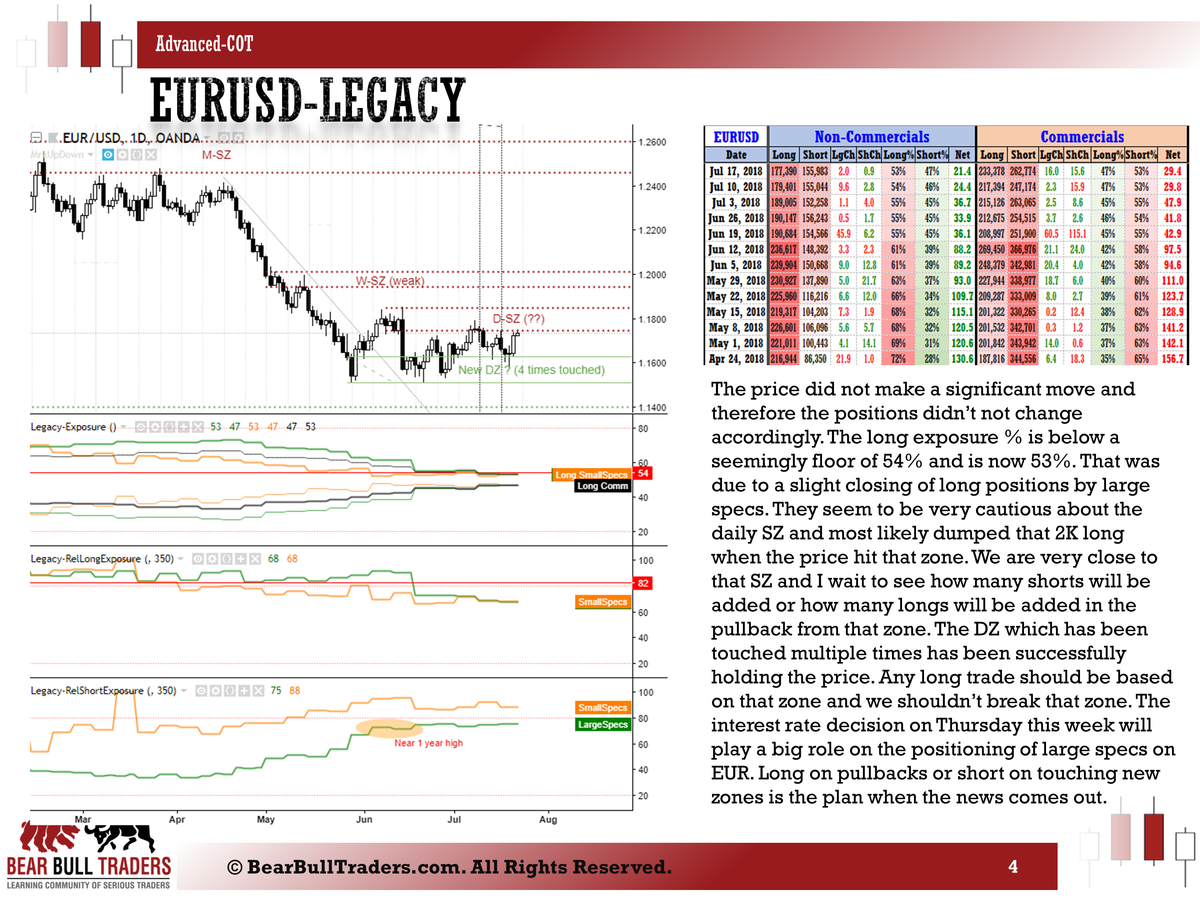
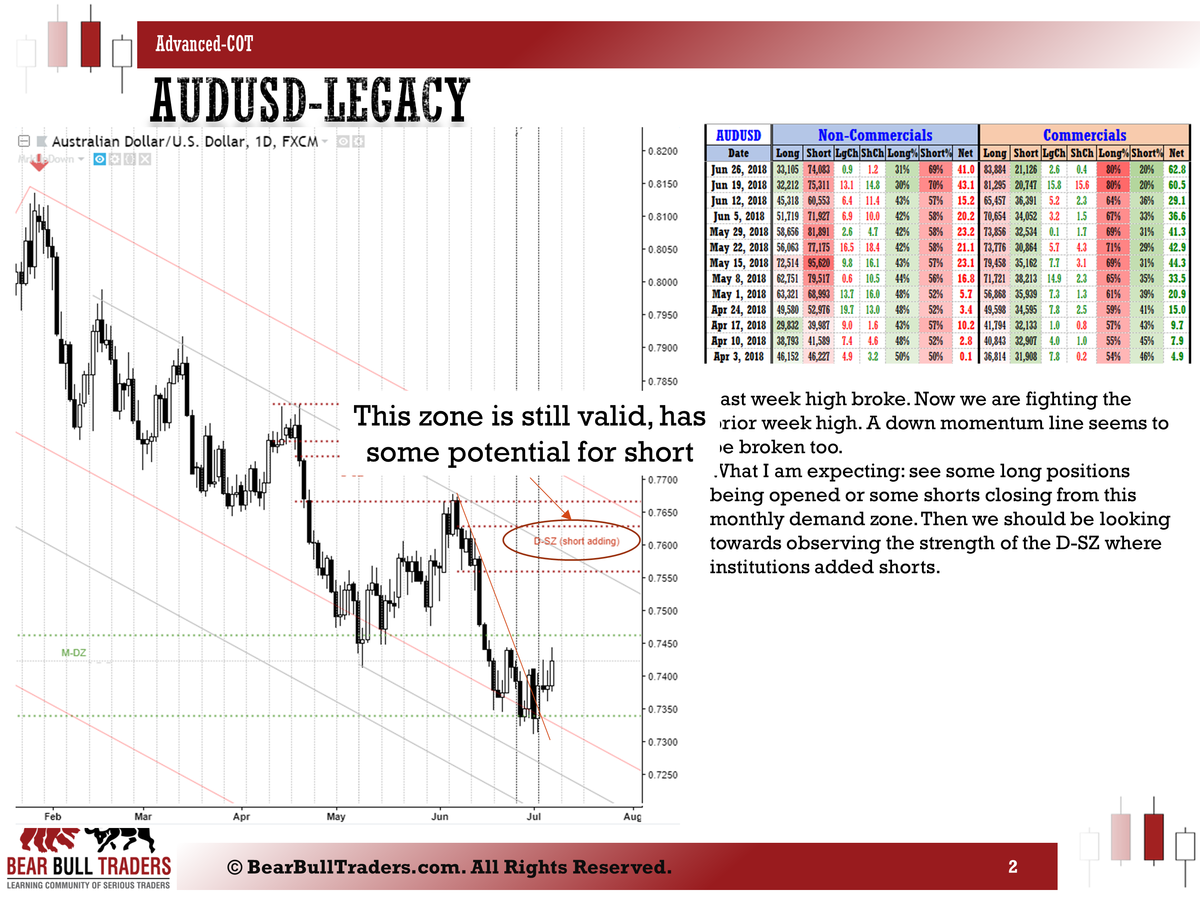
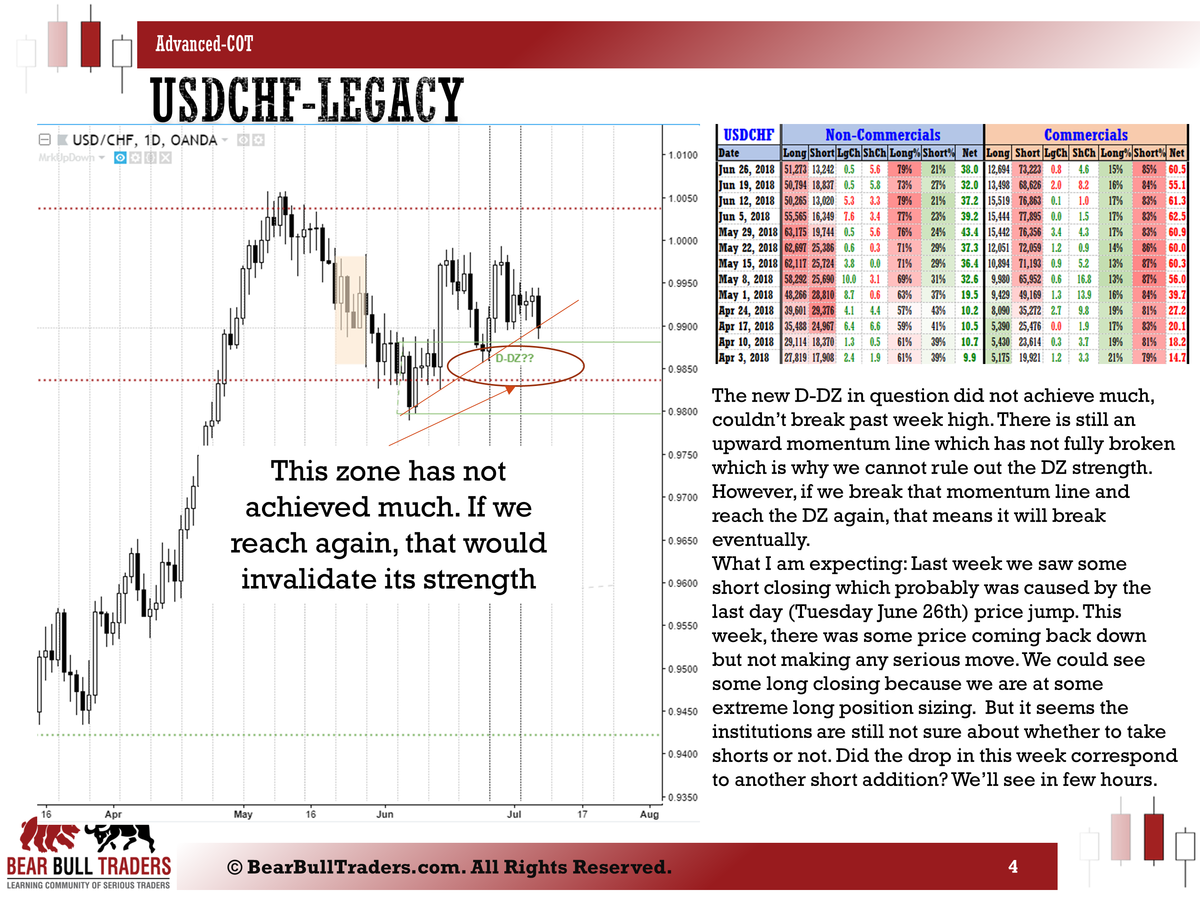
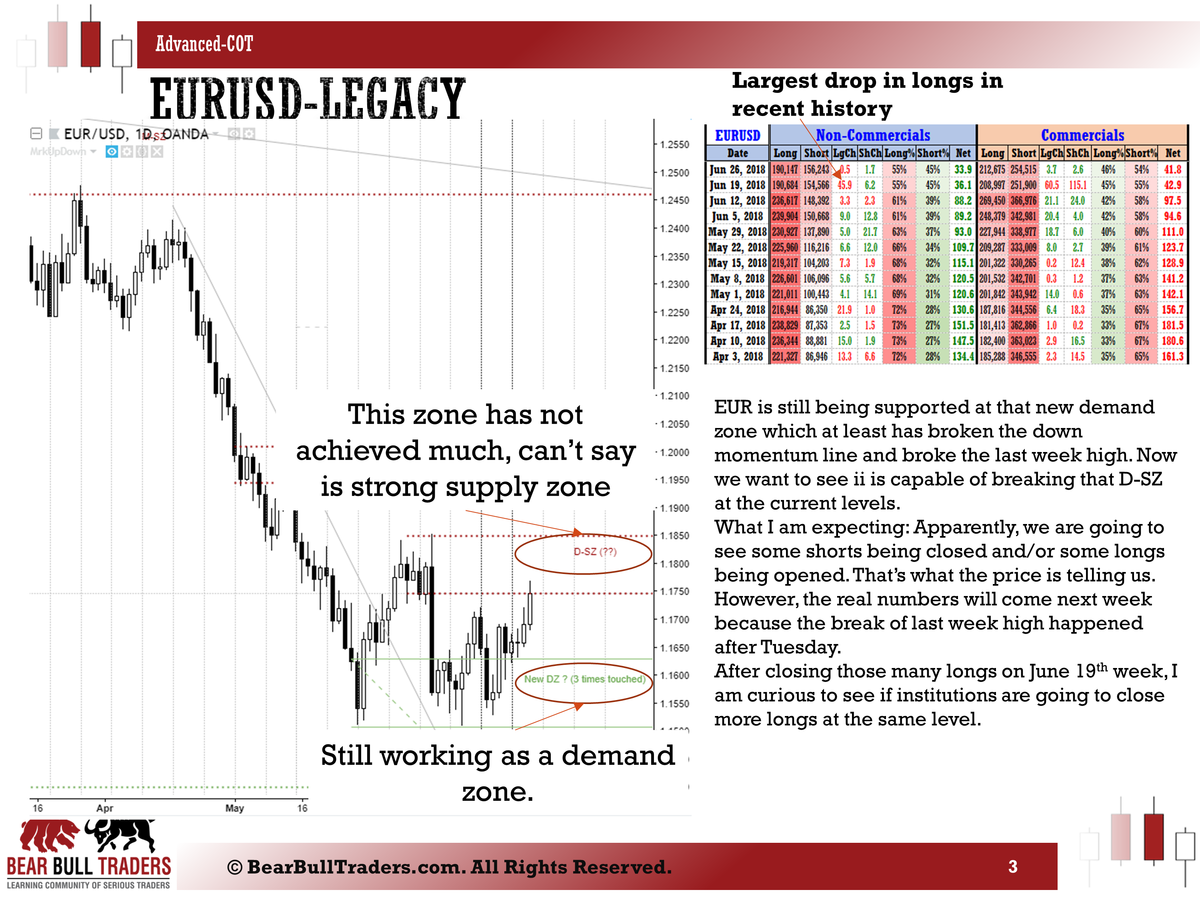
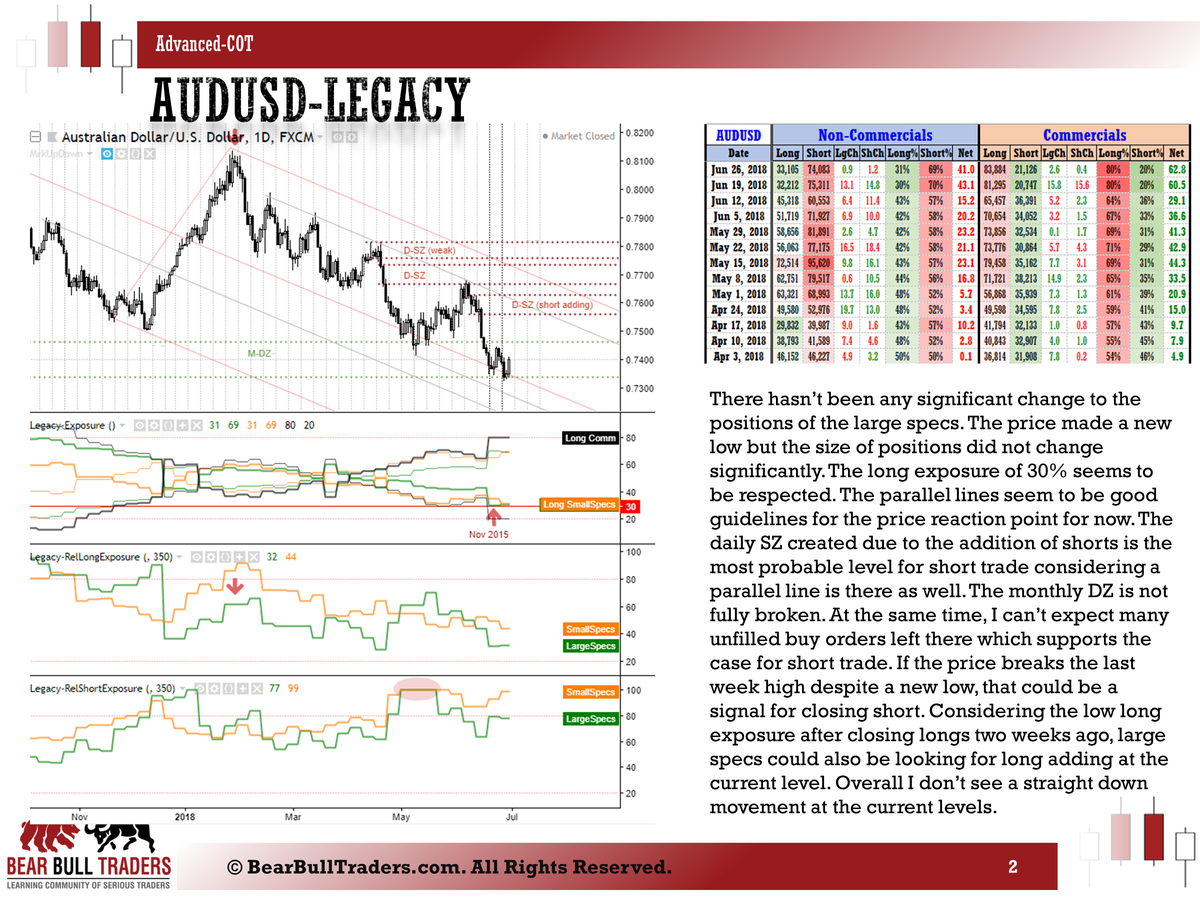
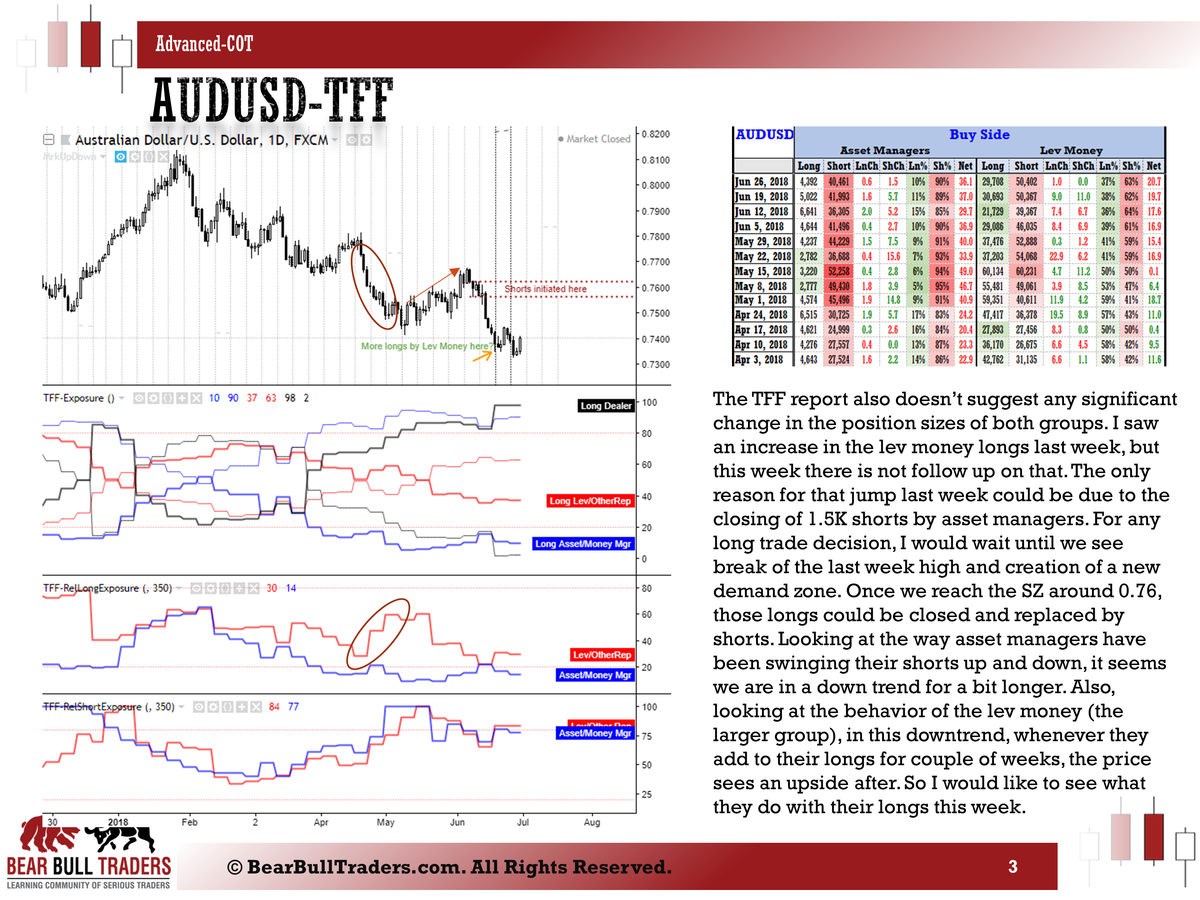
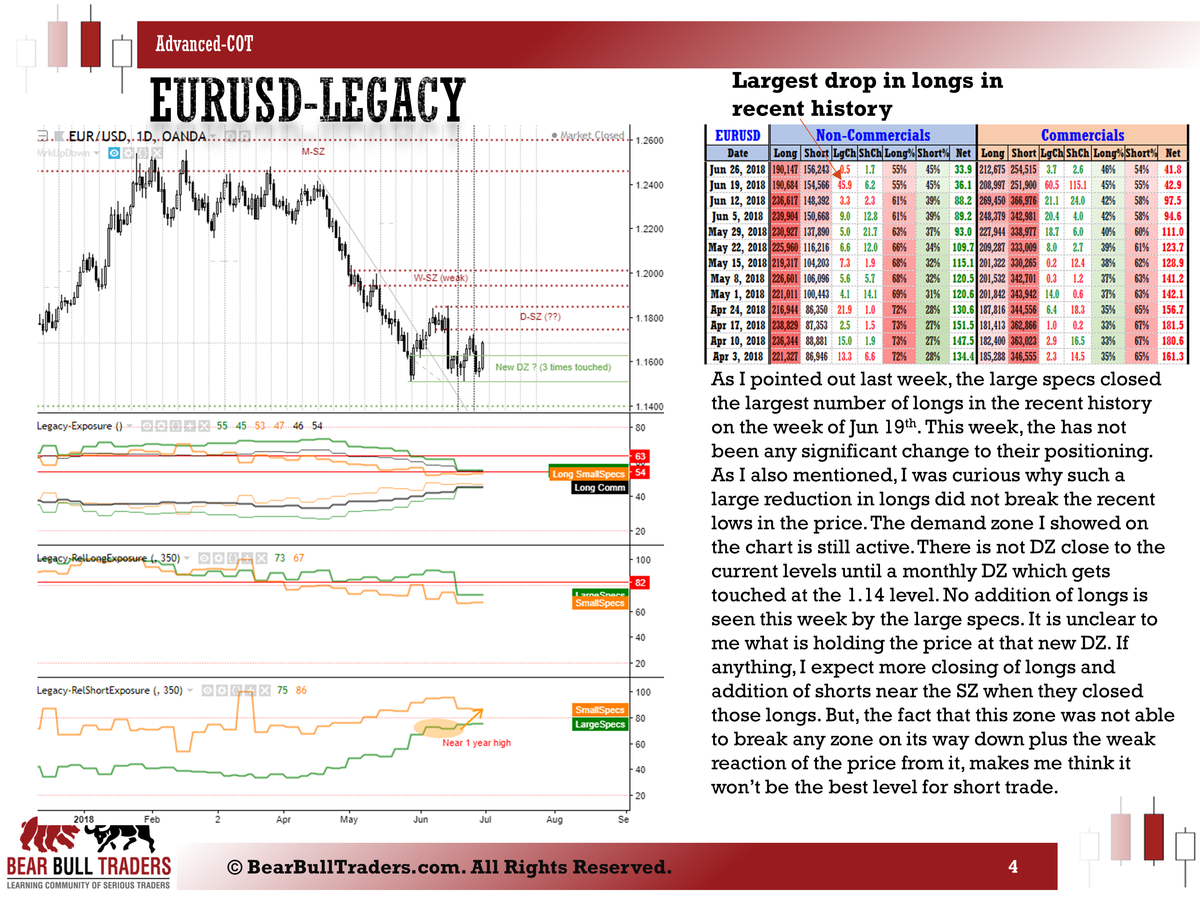
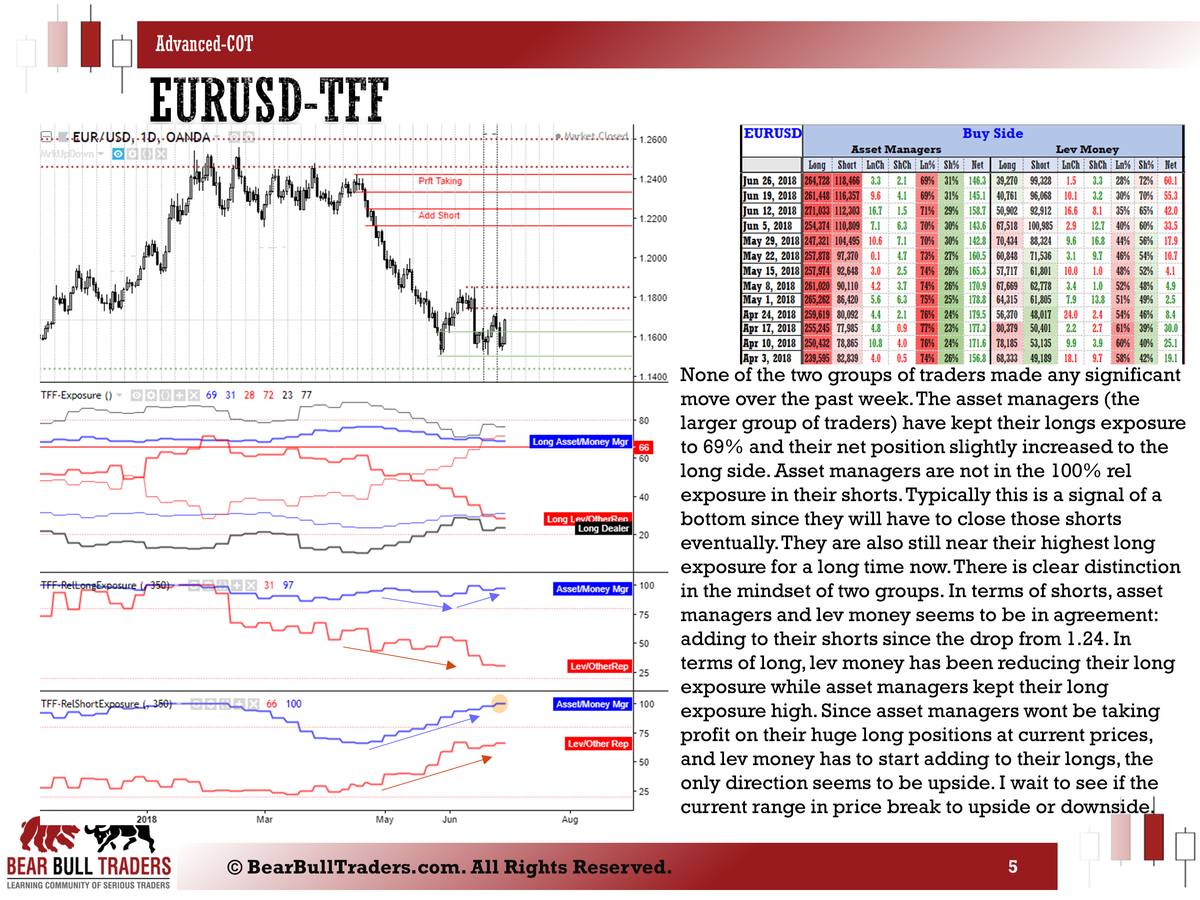
Here is a snapshot of the weekly analysis based on July 24th, 2018 COT (Legacy, Traders in Financial Futures) reports.
More trade updates will come in the following post.

For more information on this type of analysis check out the previous posts in the education section of the forum here, here, and there.
Create a FREE account to get access to all previous weekly analysis and educational materials using the registration form found in this page.
If you want to discuss further and clarify things, please send me a message to [email protected]
Zack
-
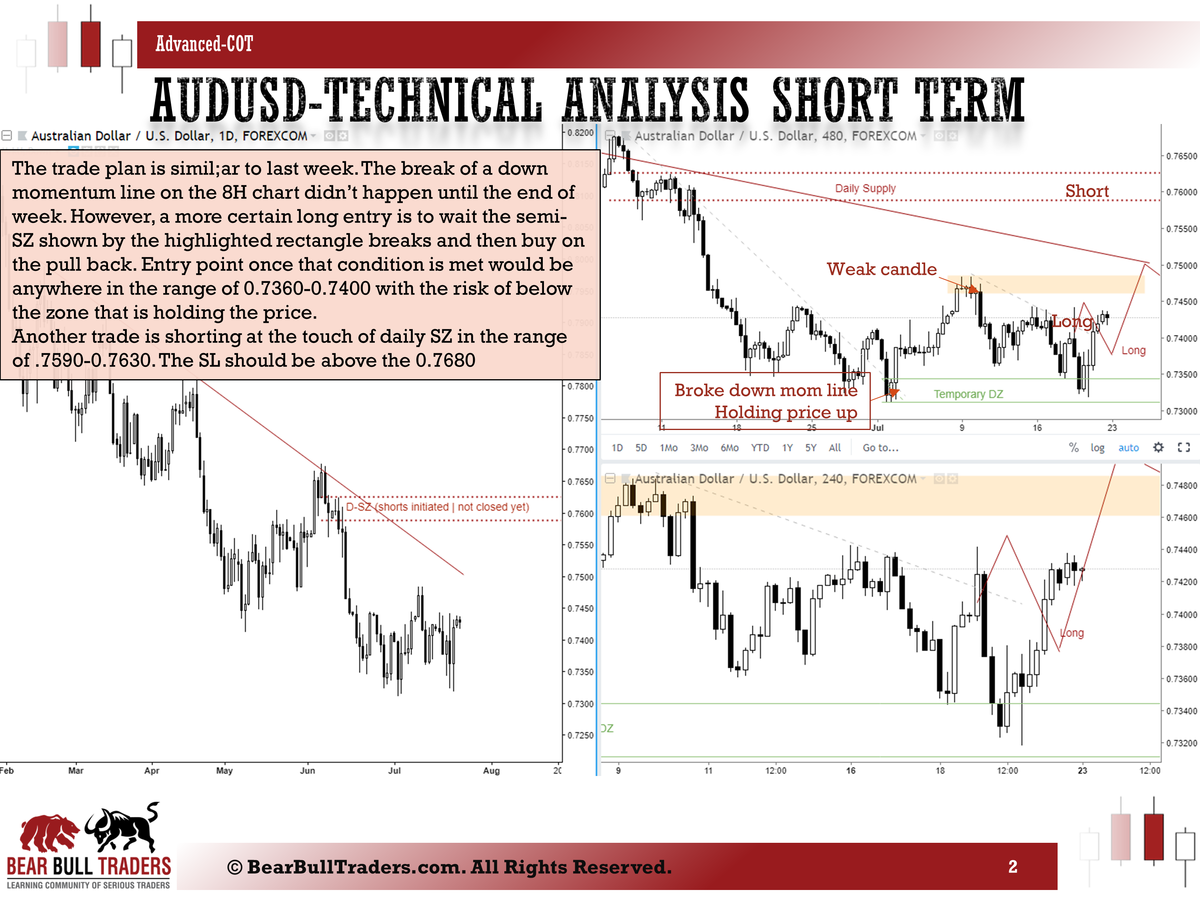
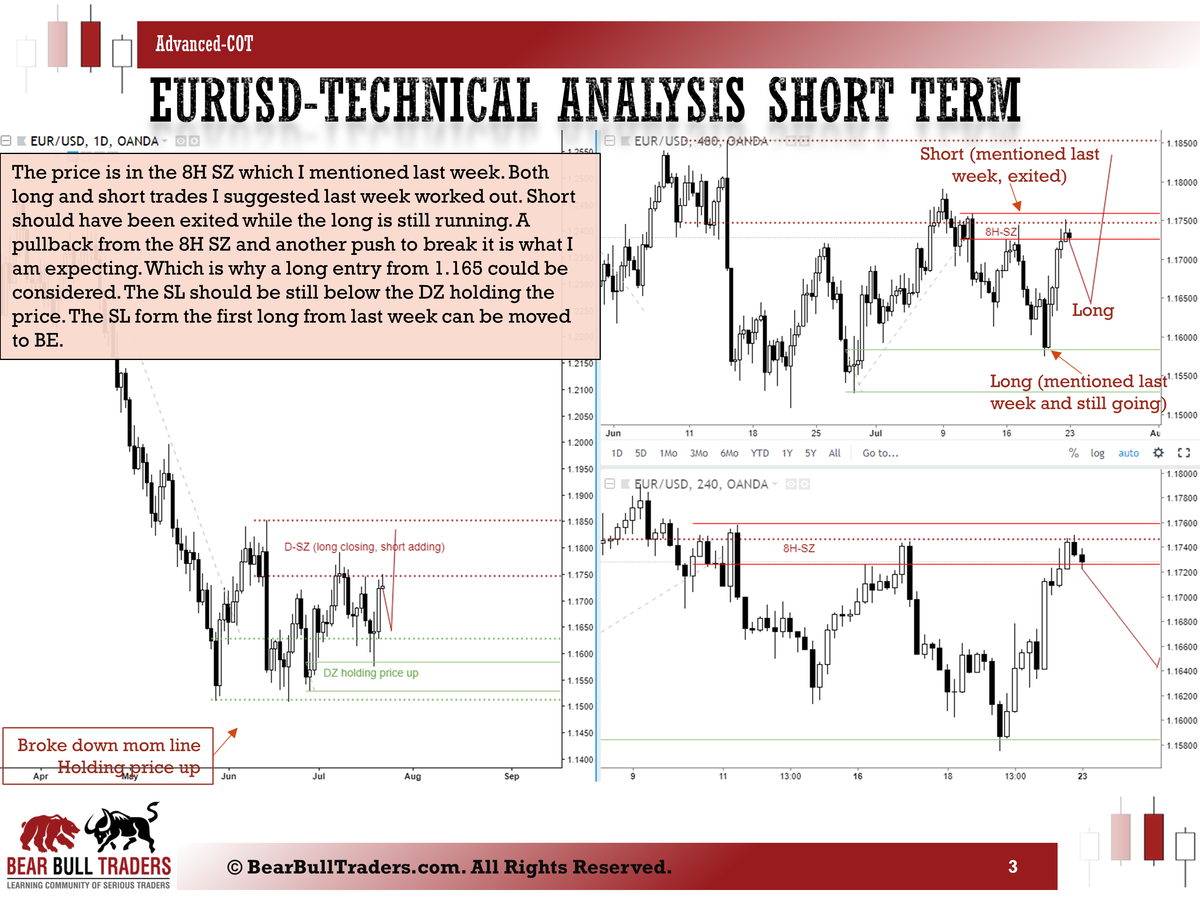
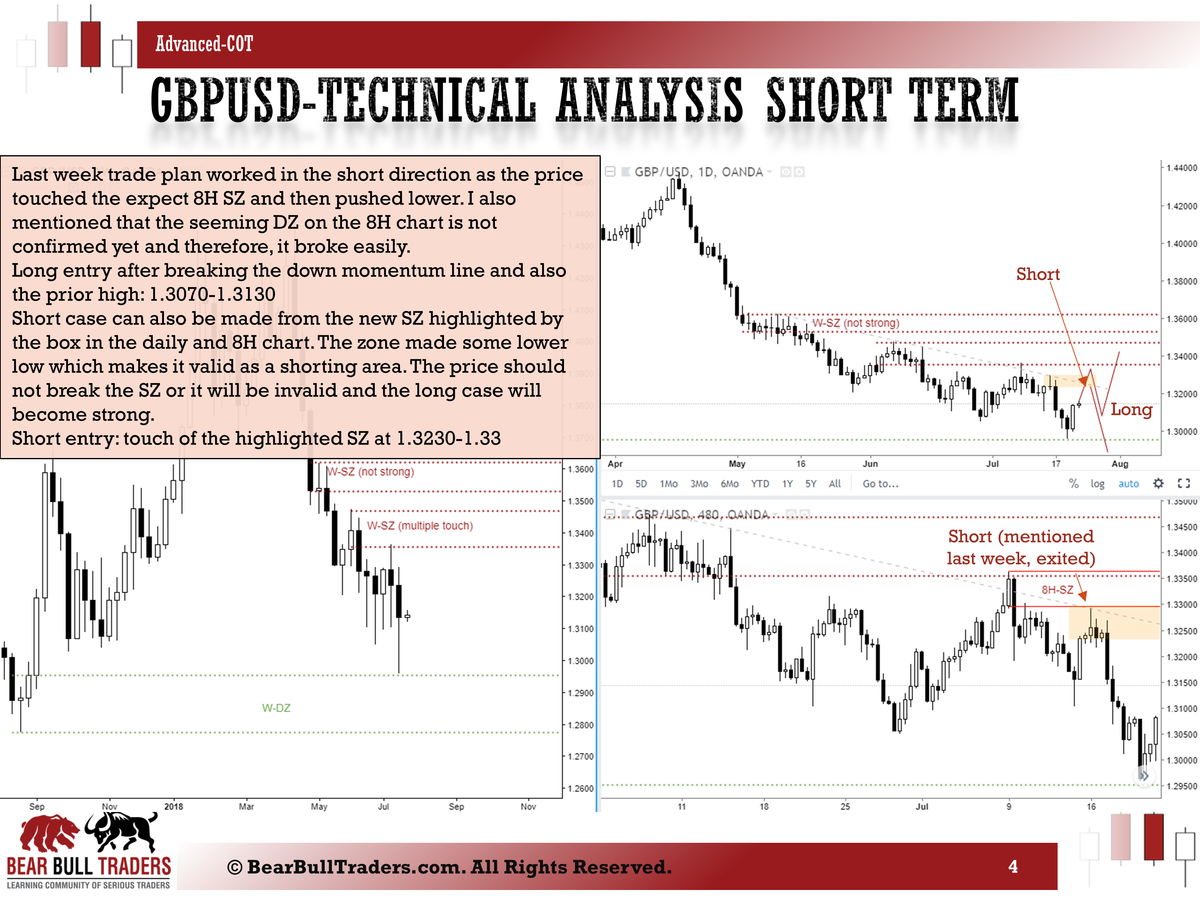
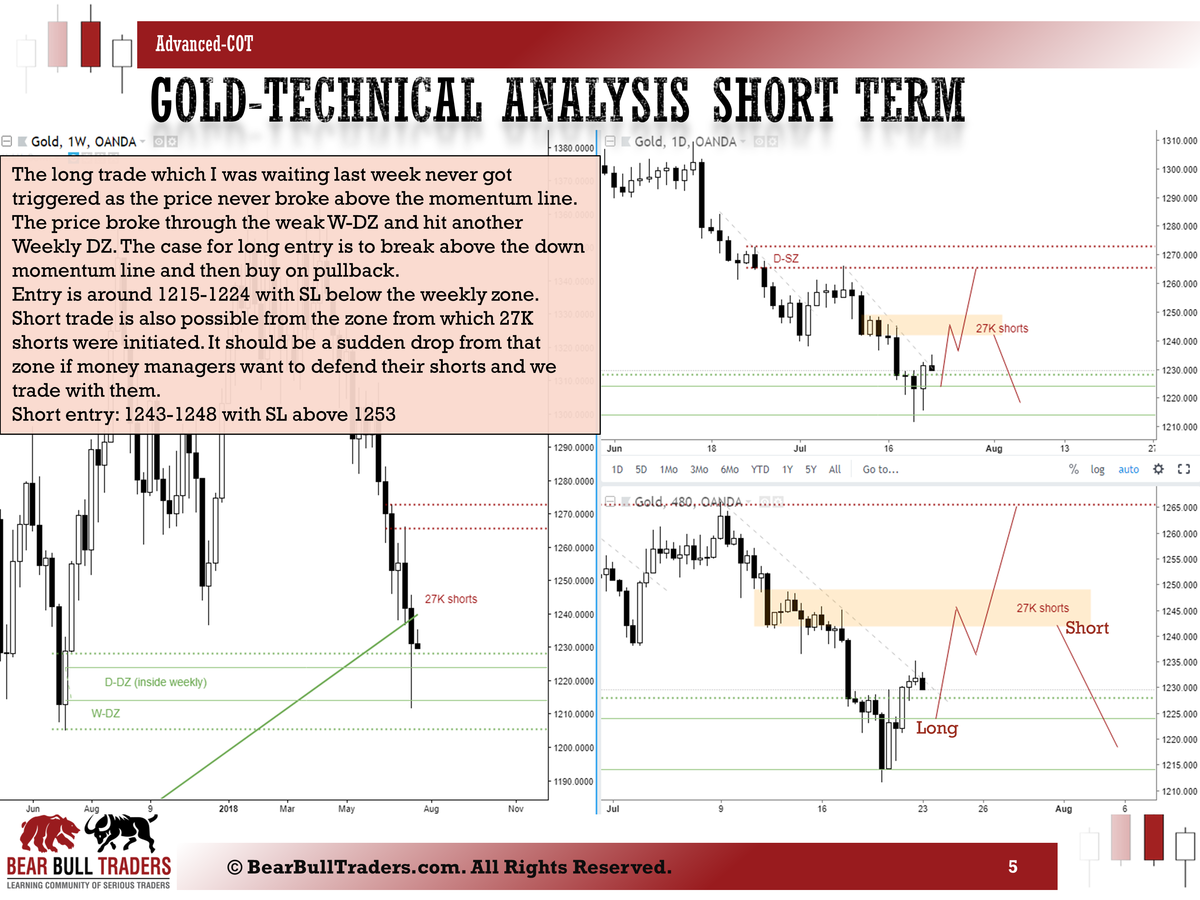
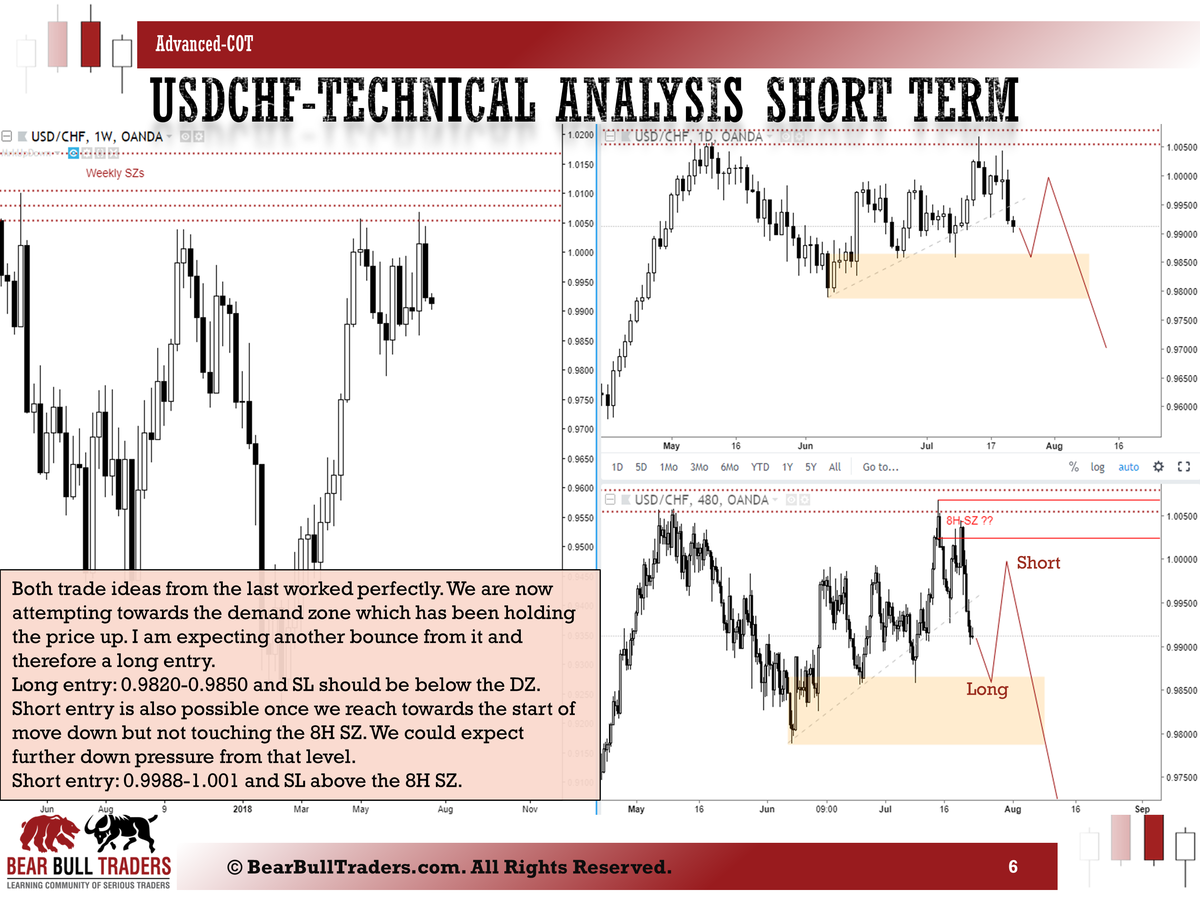
Here are some possible trades based on the COT reports of July 24th, 2018. The trades are based on some lower timeframes for short term profits. The big picture trades are setting up in the bigger timeframes and what I explained in the COT analysis posted here.
For more information on this type of analysis check out the previous posts in the education section of the forum here, here, and there.
If you want to discuss further and clarify things, please send me a message to [email protected]
Zack
-
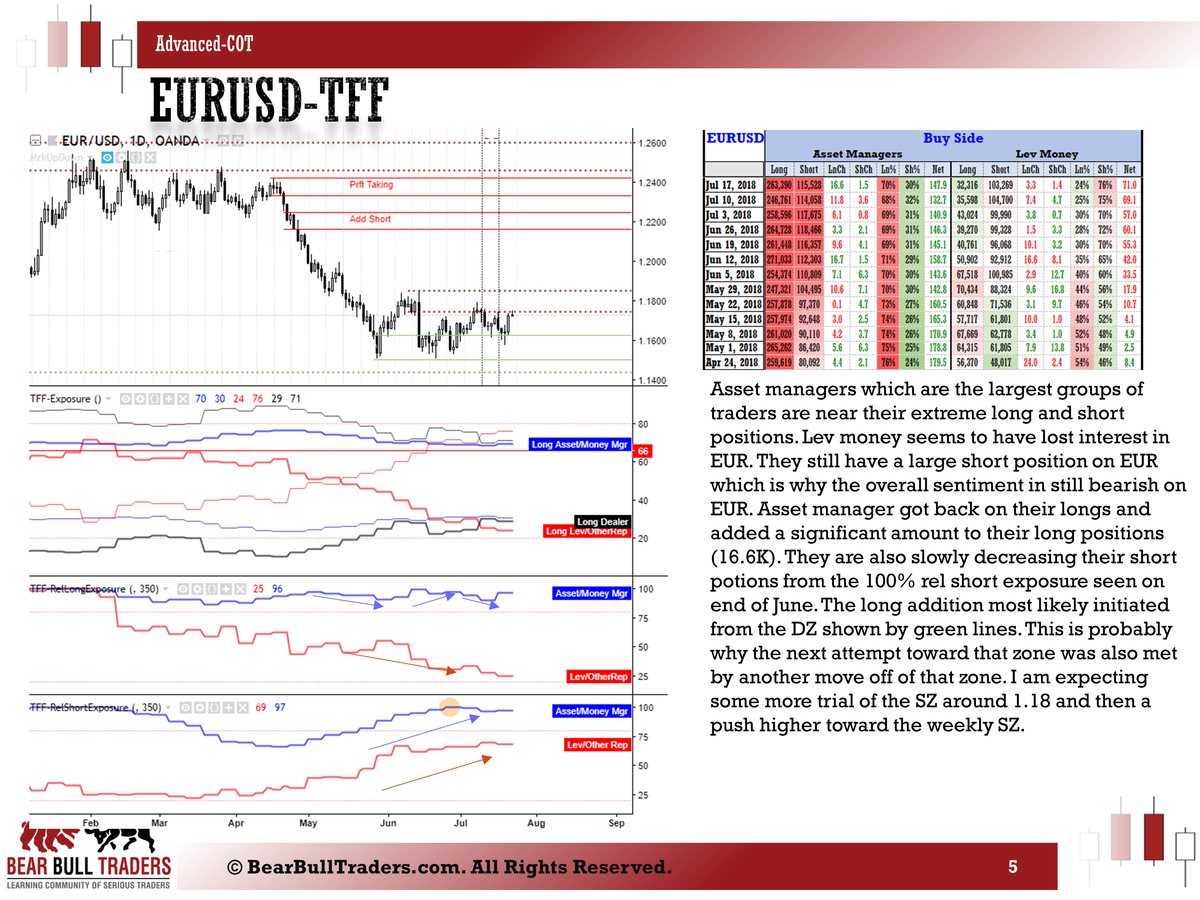
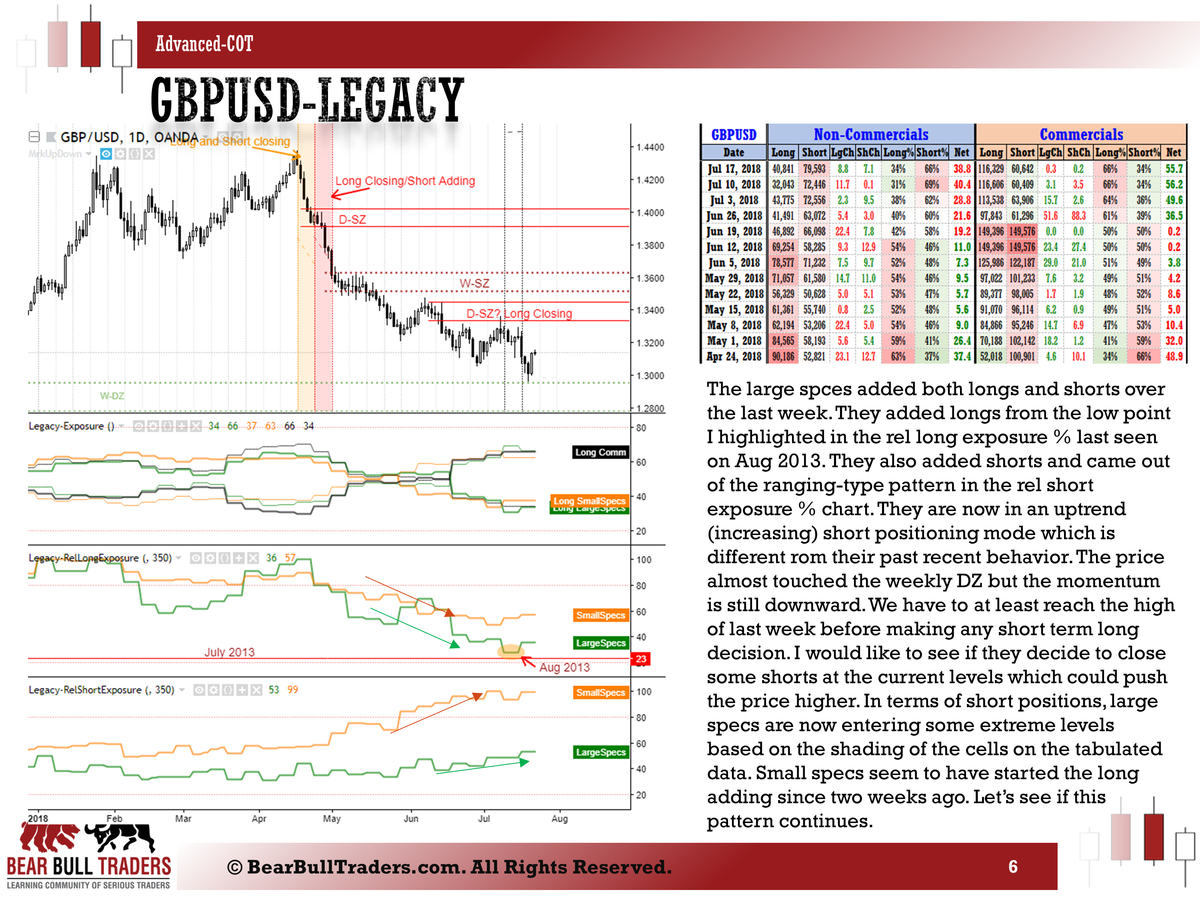
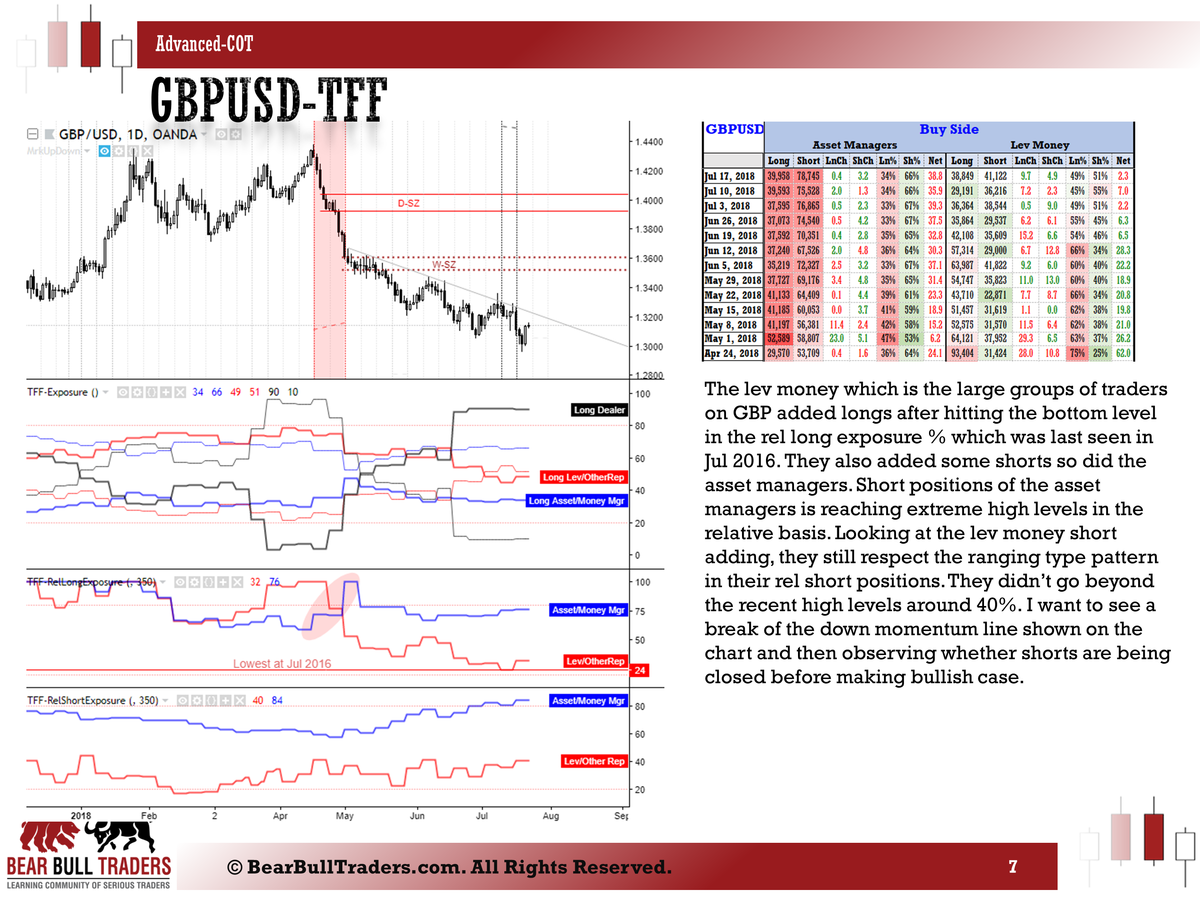
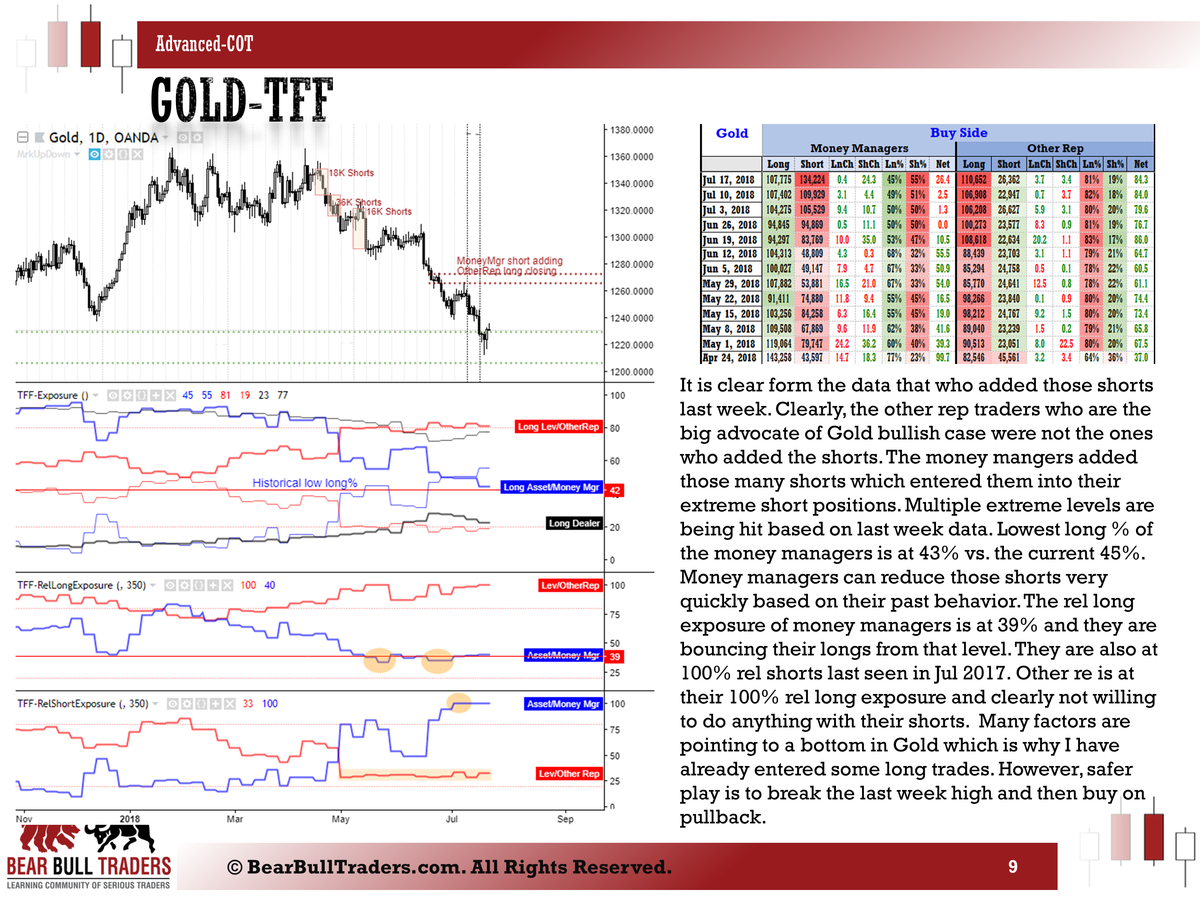
Here is a snapshot of the weekly analysis based on July 24th, 2018 COT (Legacy, Traders in Financial Futures) reports.
More trade updates will come in the following post.
For more information on this type of analysis check out the previous posts in the education section of the forum here, here, and there.
If you want to discuss further and clarify things, please send me a message to [email protected]
Zack
-
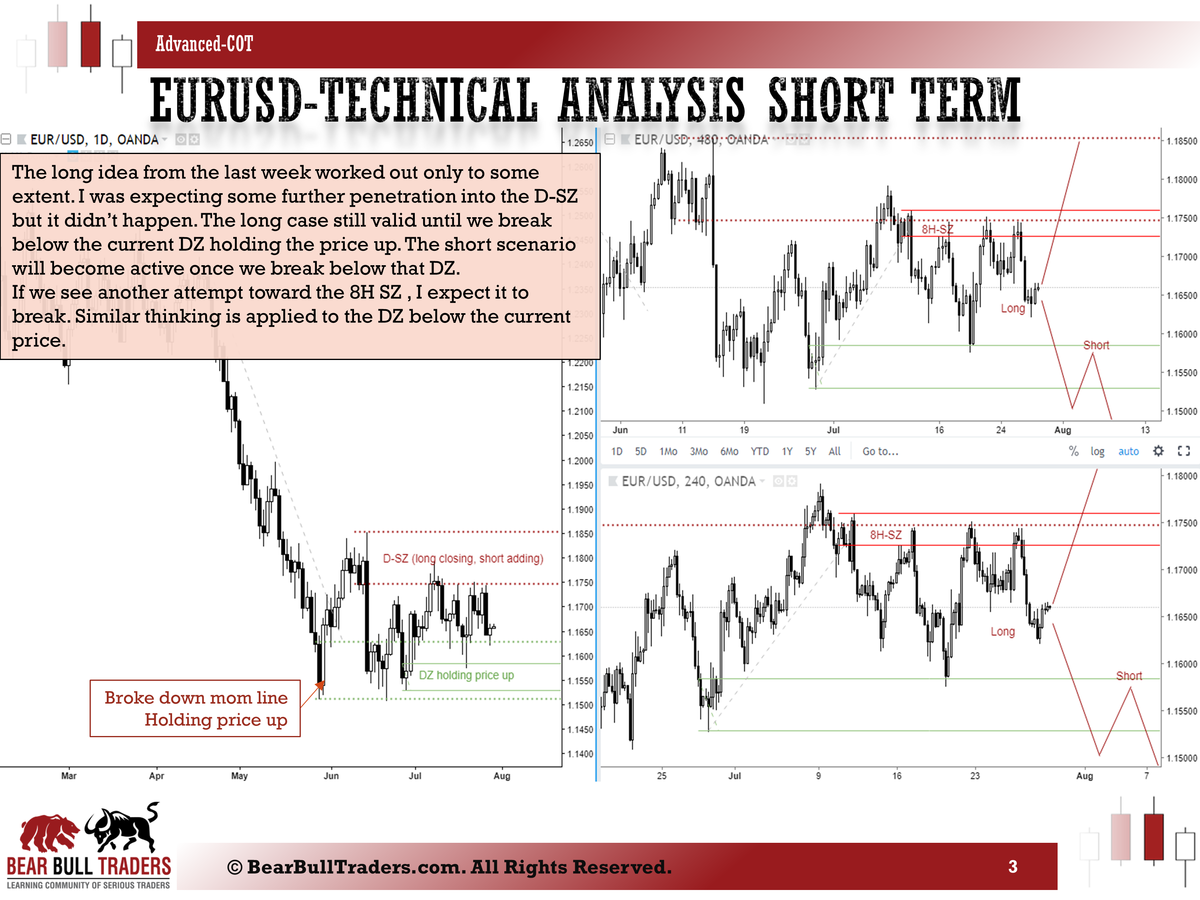
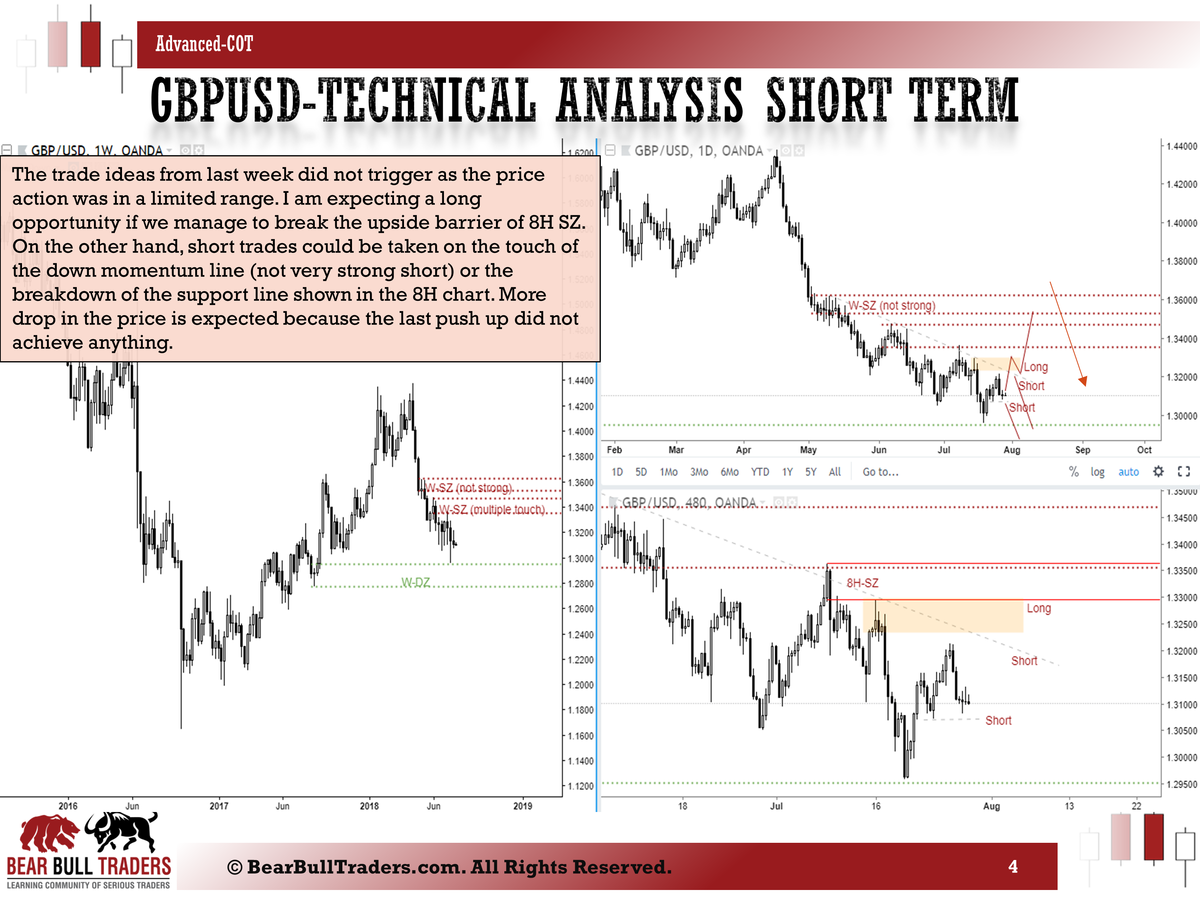
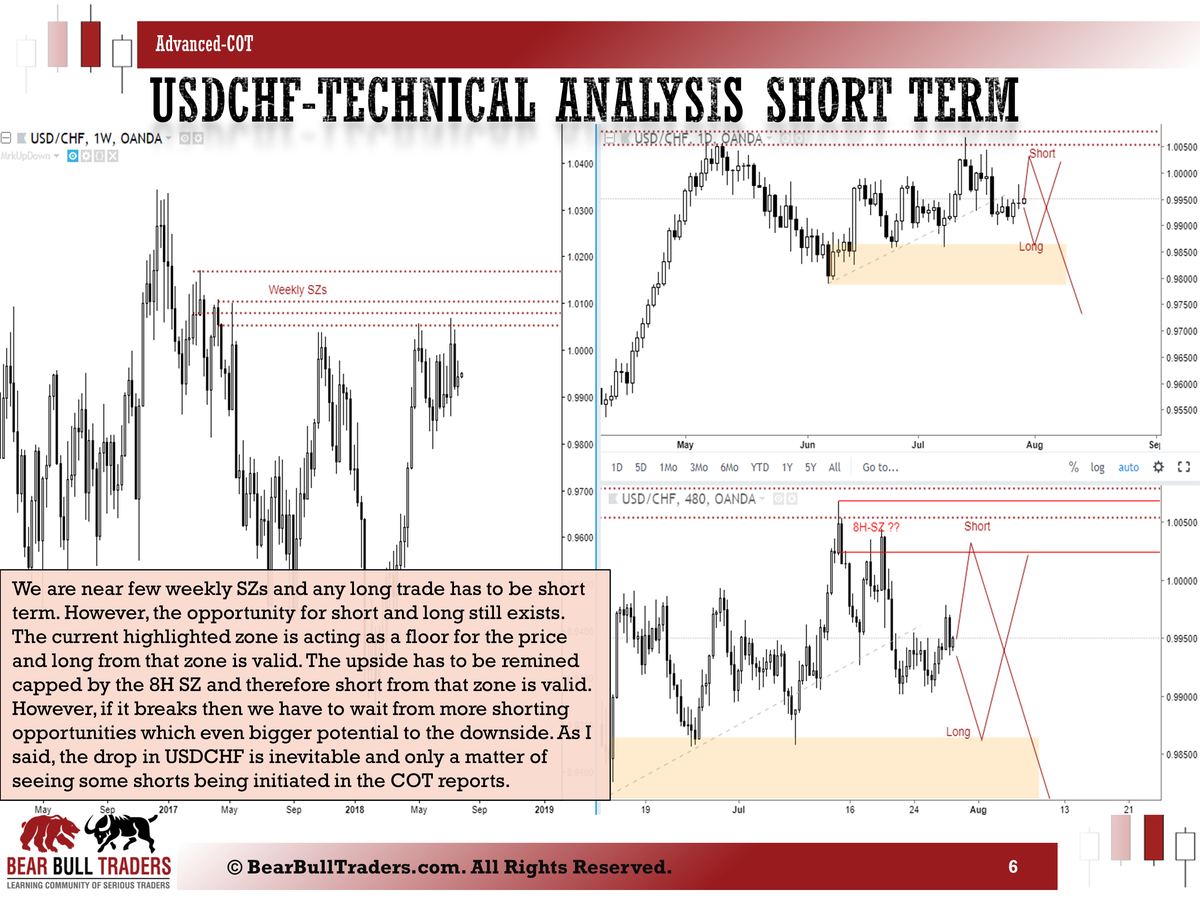
Here are some possible trades based on the COT reports of July 17th, 2018. The trades are based on some lower timeframes for short term profits. The big picture trades are setting up in the bigger timeframes ans what I explained in the COT analysis posted here.
For more information on this type of analysis check out the previous posts in the education section of the forum here, here, and there.
If you want to discuss further and clarify things, please send me a message to [email protected]
Zack
-
Here is a snapshot of the weekly analysis based on July 17th, 2018 COT (Legacy, Traders in Financial Futures) reports.
More trade updates will come in the following post.
For more information on this type of analysis check out the previous posts in the education section of the forum here, here, and there.
If you want to discuss further and clarify things, please send me a message to [email protected]
Zack
-
UPDATE:
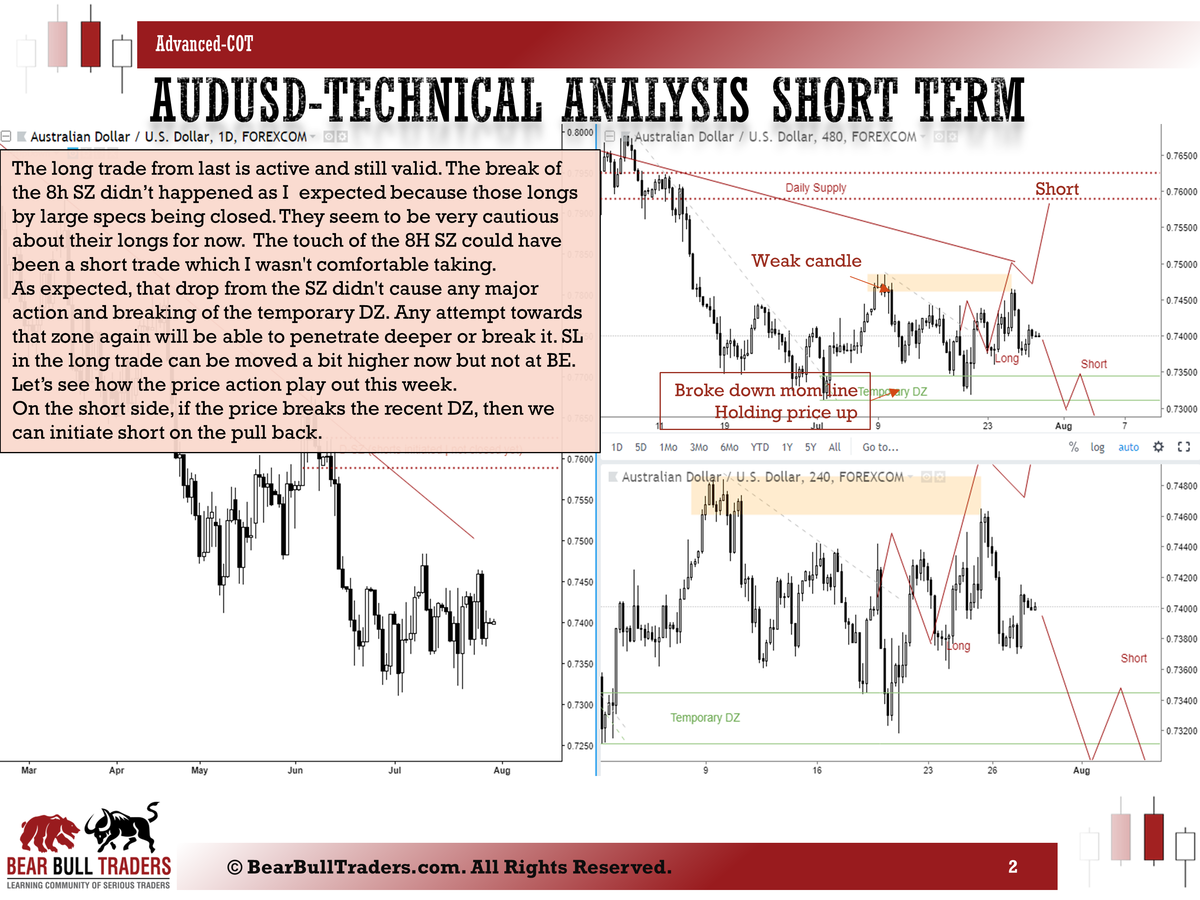
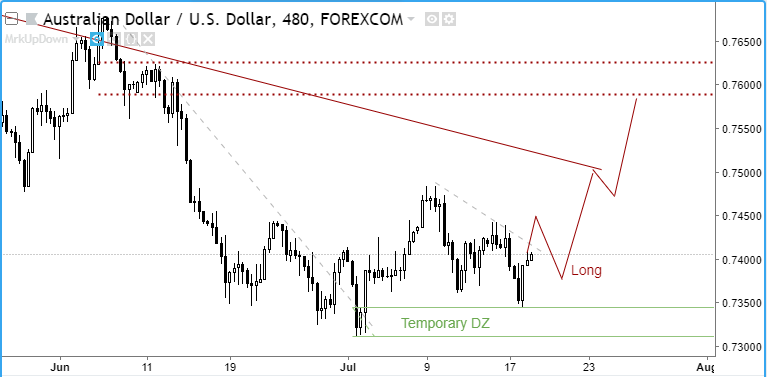
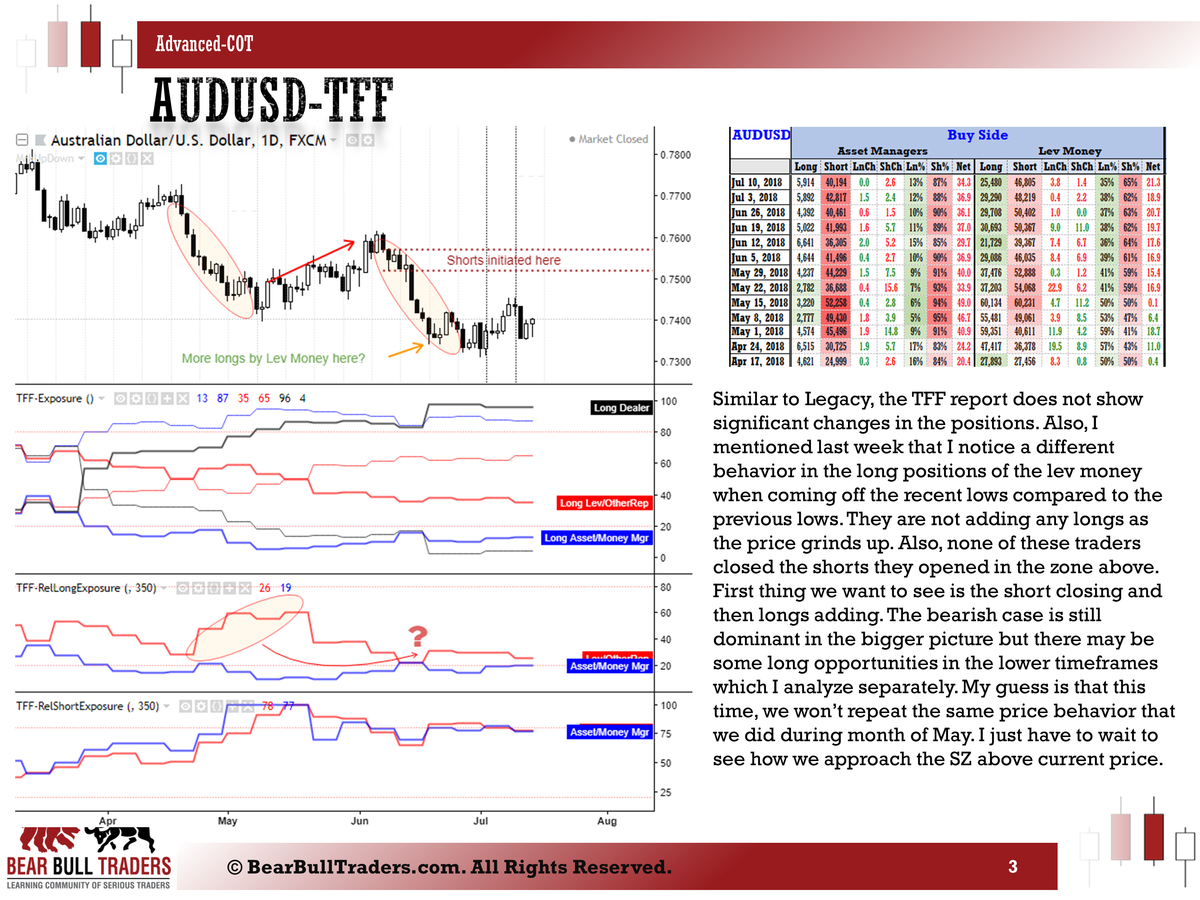
AUDUSD touched the temporary DZ and now attempting to break the 8H down momentum. Another long opportunity may come if that breaks. If it can'c break the prior high, then that DZ most likely won't hold.
-
UPDATE:
The trades are paying out as we expected based on these short term analysis.
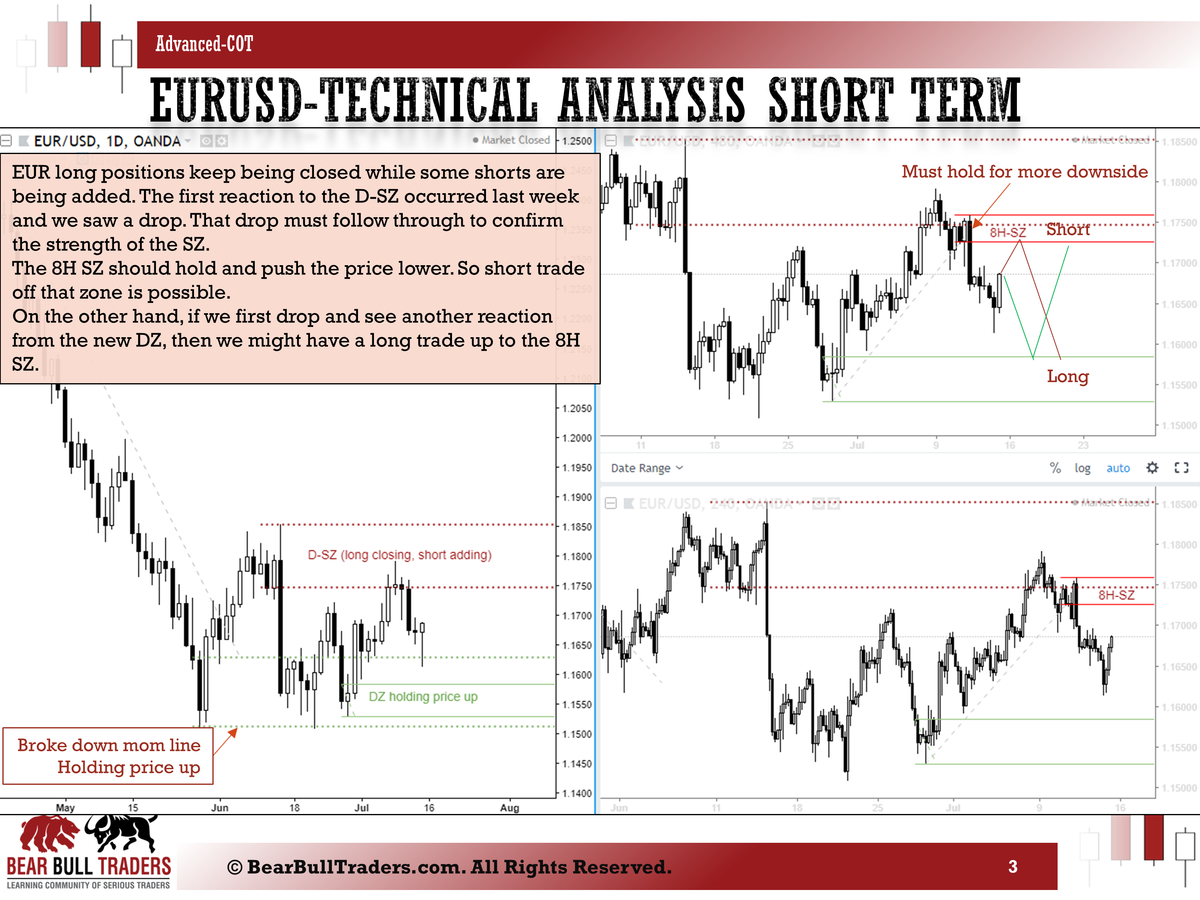
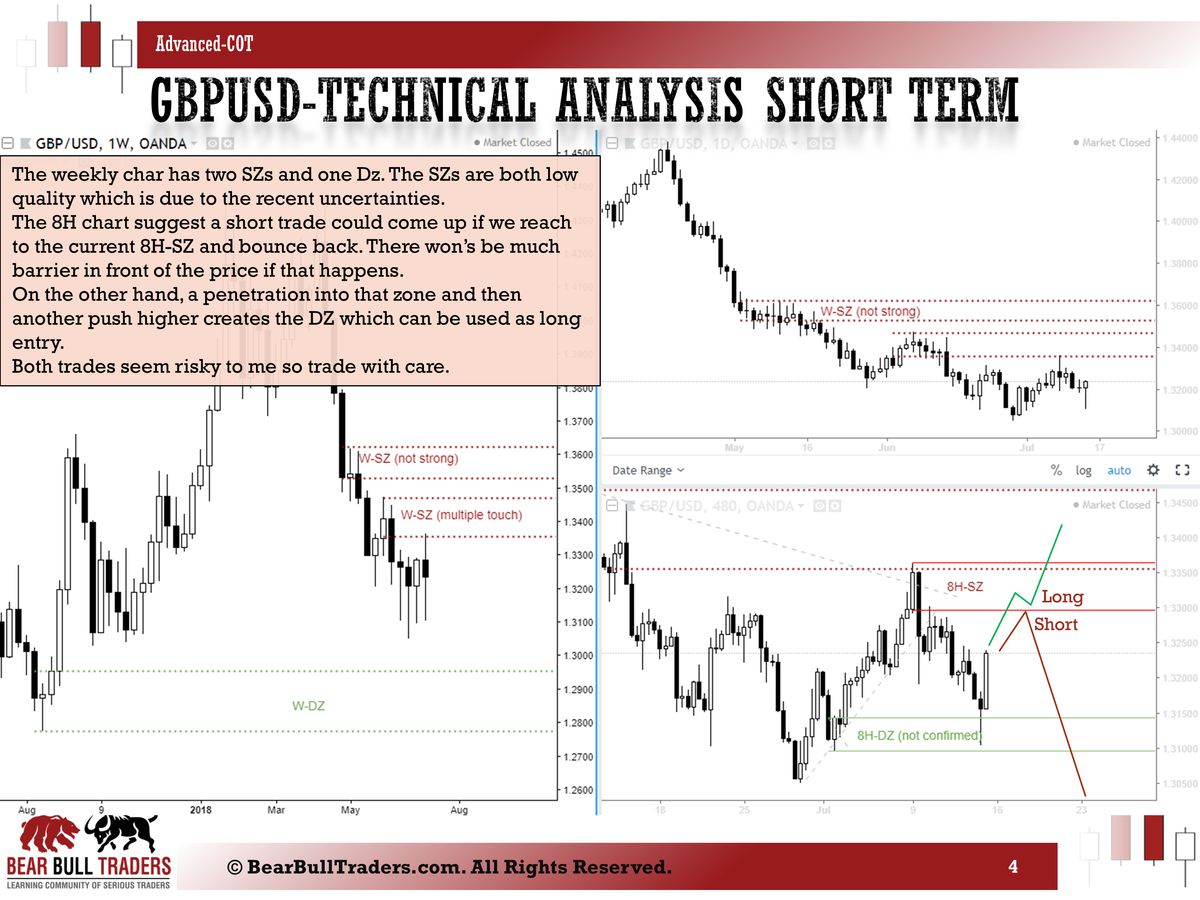
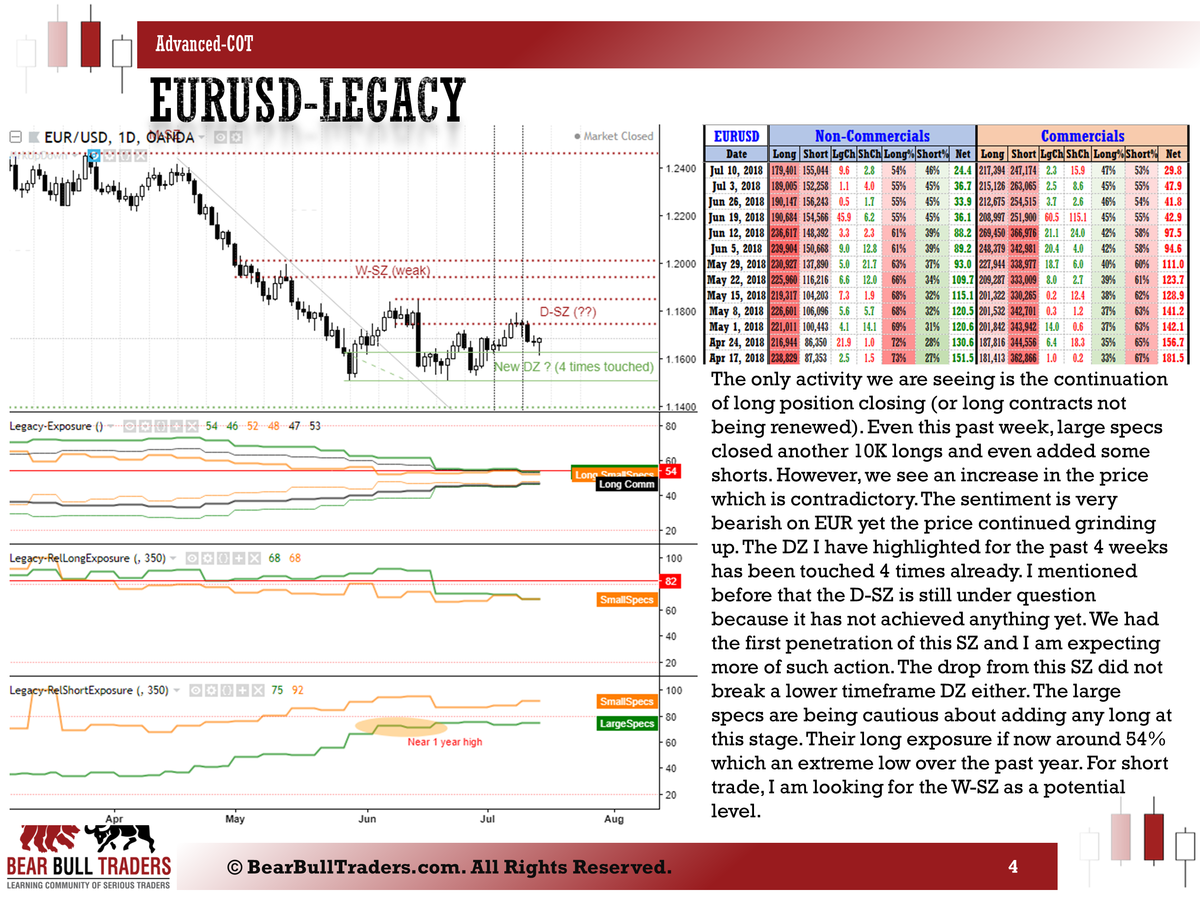
EURUSD and GBPUSD short scenarios worked and should be in profit now.
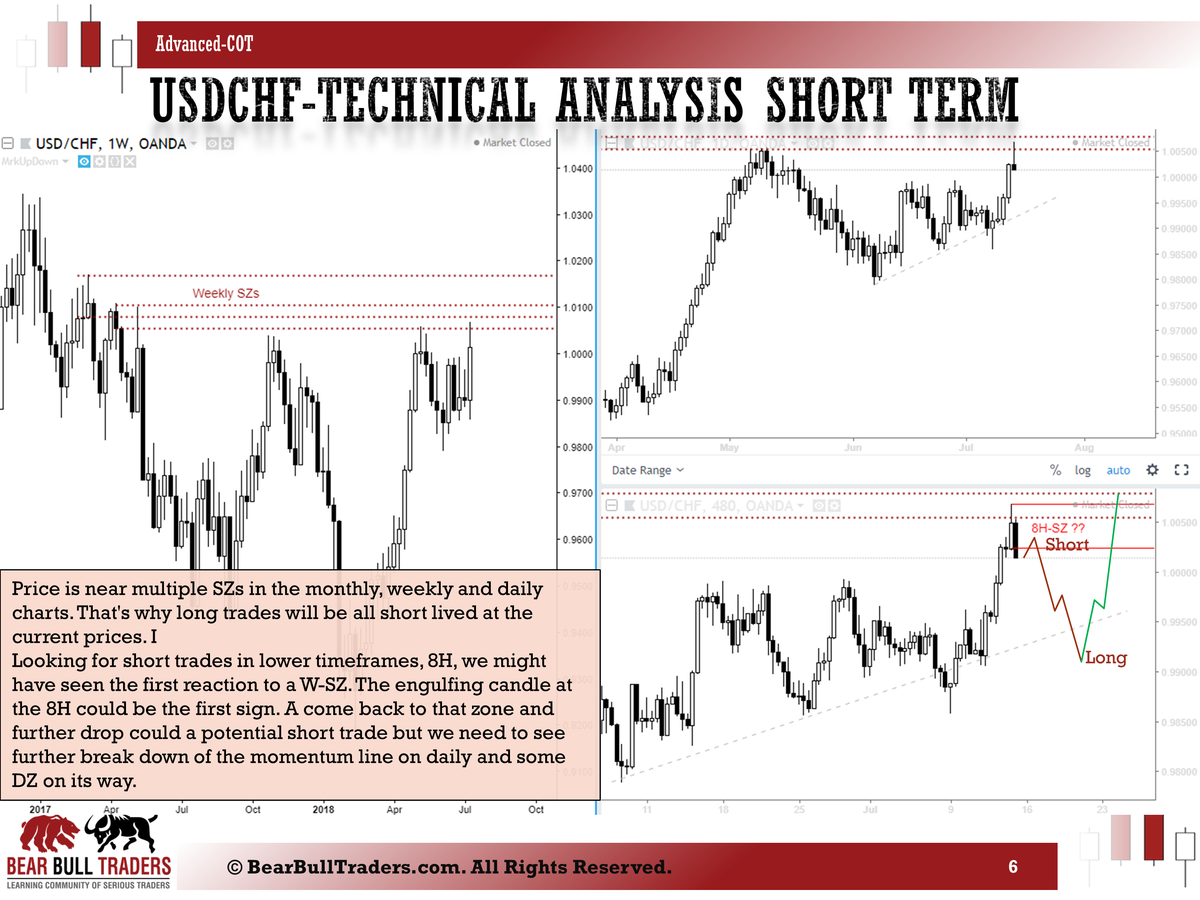
USFCHF worked in both short and then long directions.
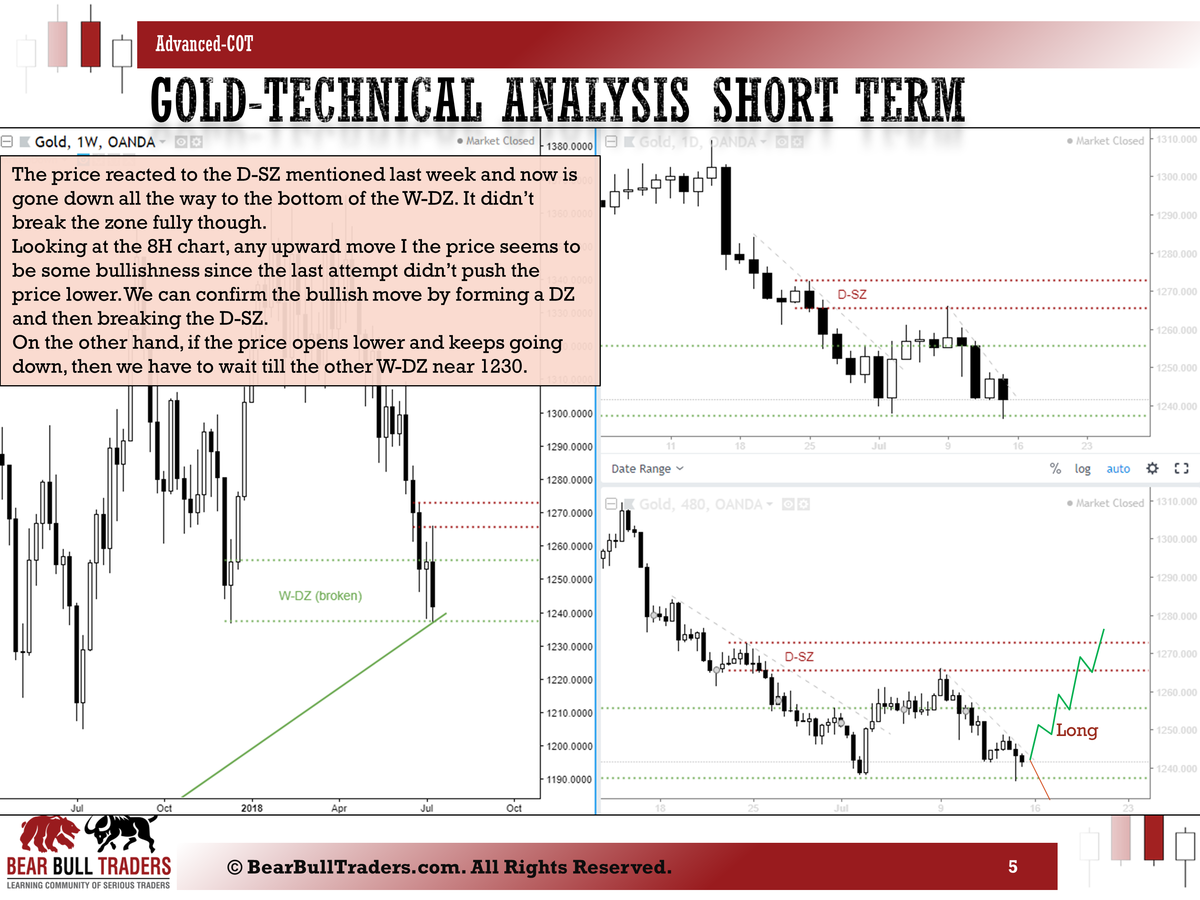
Gold never made it to break a prior high and therefore, the short trade is still in play now. The price is currently hitting a weekly zone and could bounce.
AUDUSD never made it to attempt that weak supply zone so no trade there. I'd be watching to see is the temporary demand zone can be used as a long entry.
Zack
-
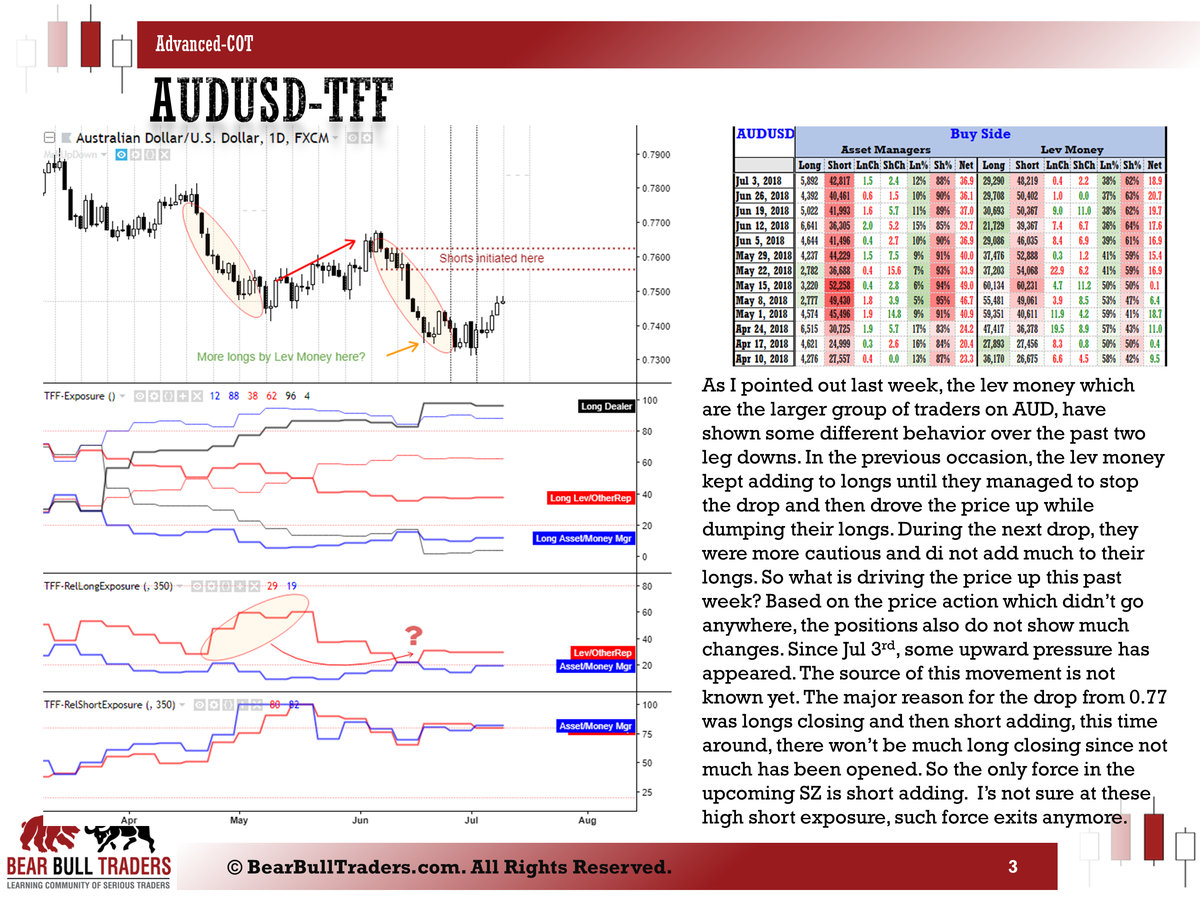
Here are some possible trades based on the COT reports of July 10th, 2018. The trades are based on some lower timeframes for short term profits. The big picture trades are setting up in the bigger timeframes ans what I explained in the COT analysis posted here.
For more information on this type of analysis check out the previous posts in the education section of the forum here, here, and there.
If you want to discuss further and clarify things, please send me a message to [email protected]
Zack
-
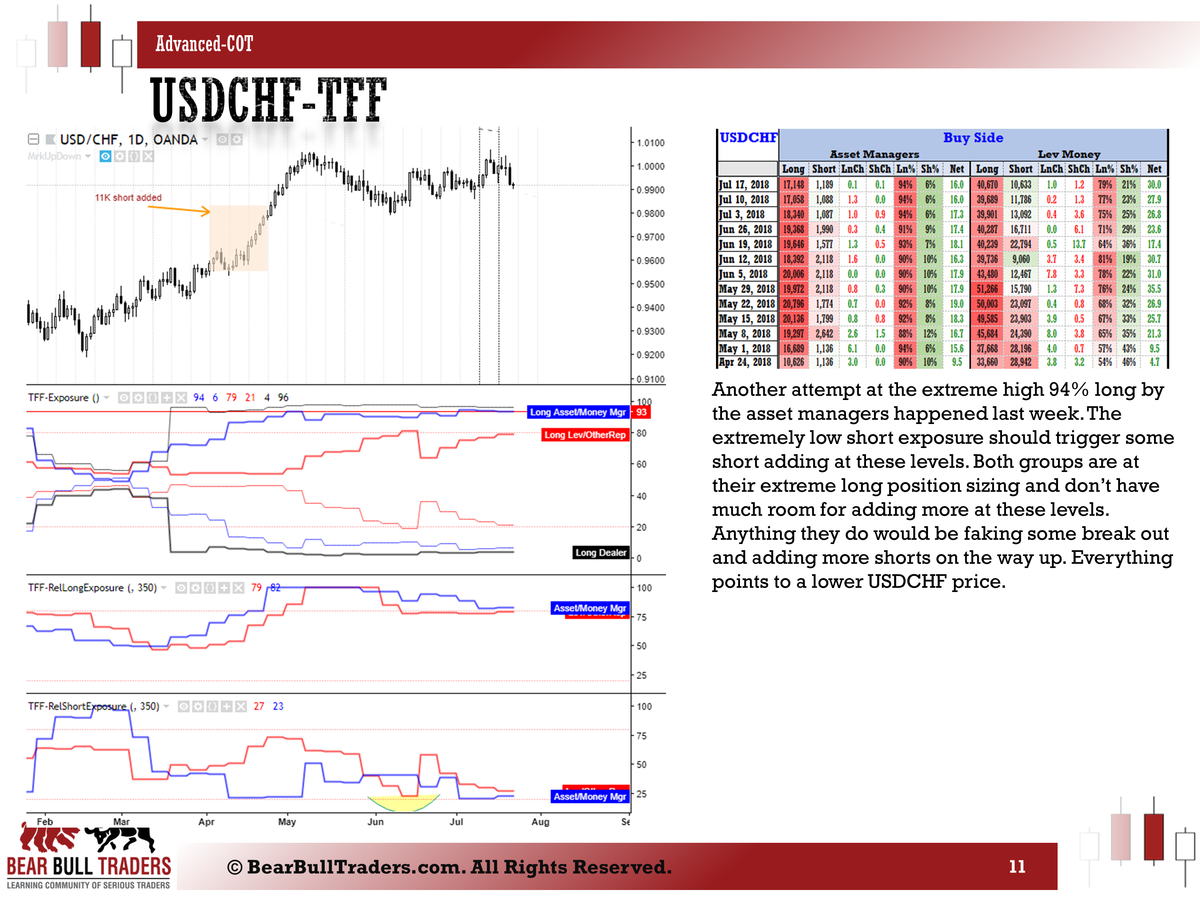
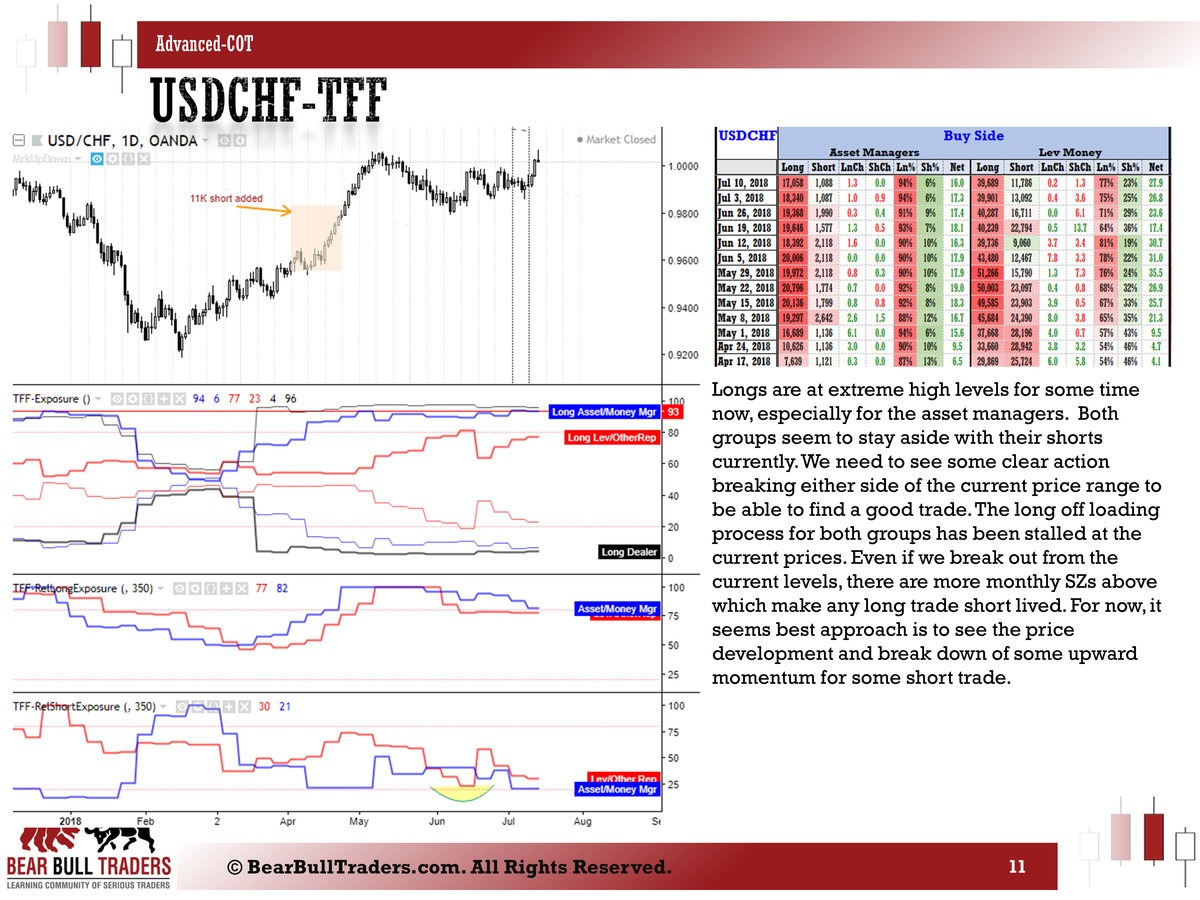
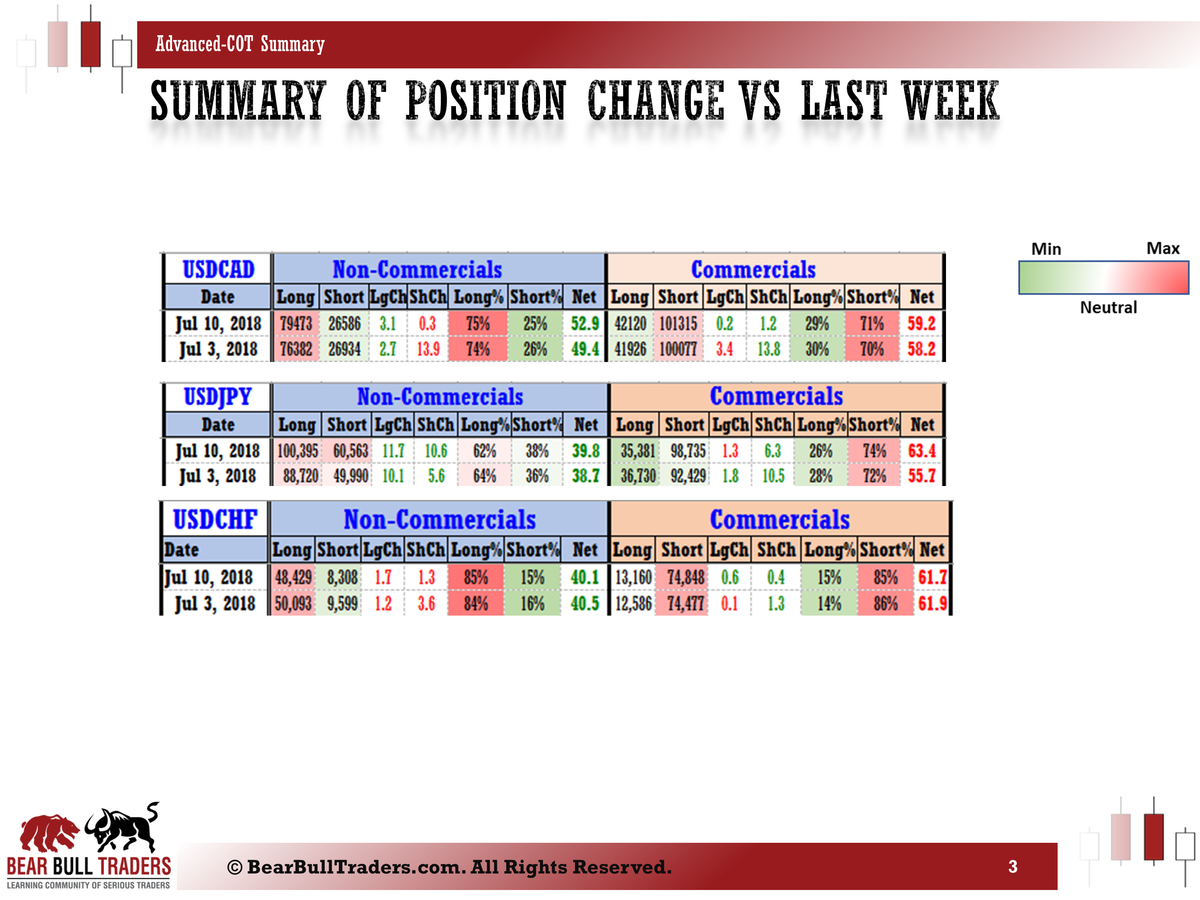
Here is a snapshot of the weekly analysis based on July 10th, 2018 COT (Legacy, Traders in Financial Futures) reports. Traders are sitting at some extreme positing sizing levels which has to change some market directions. See details in the explanations in this report.
More trade updates will come in the following post.
For more information on this type of analysis check out the previous posts in the education section of the forum here, here, and there.
If you want to discuss further and clarify things, please send me a message to [email protected]
Zack
-
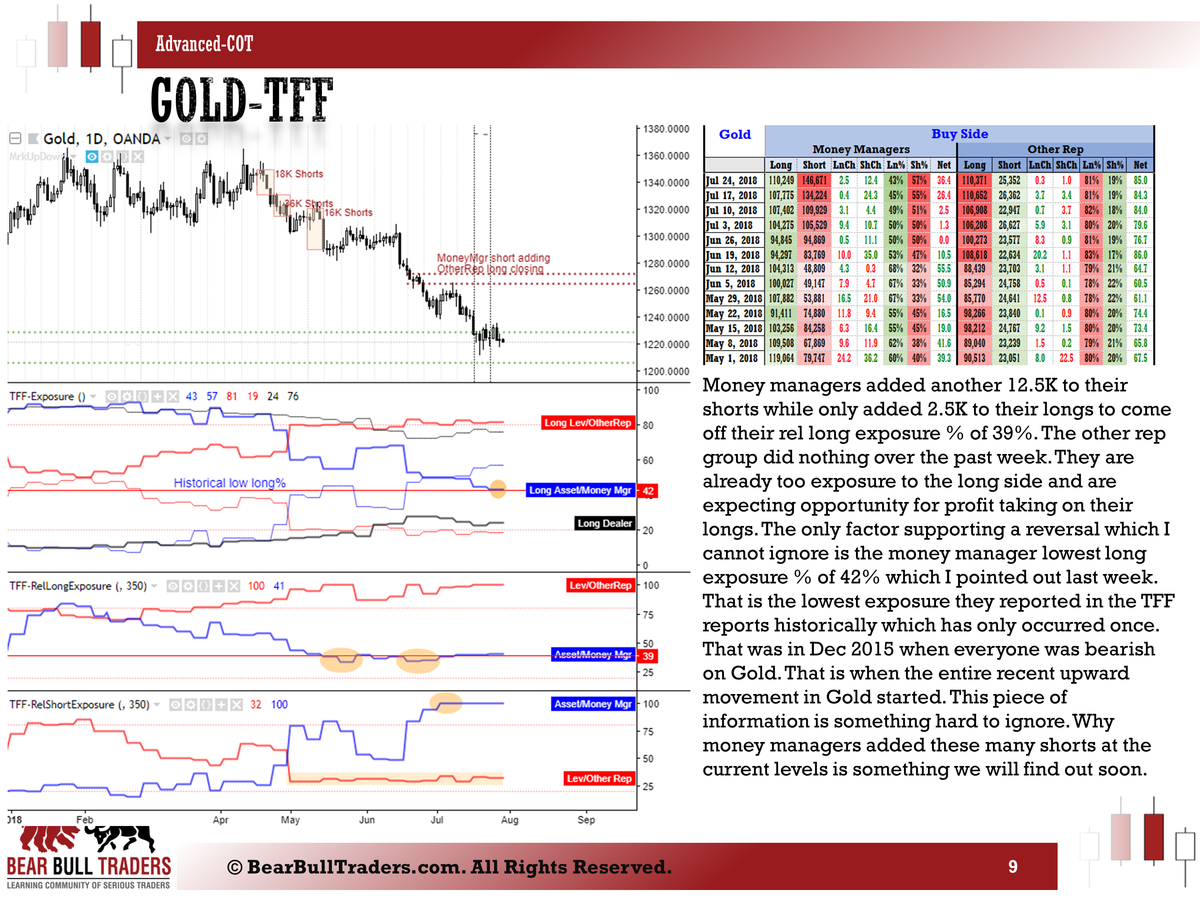
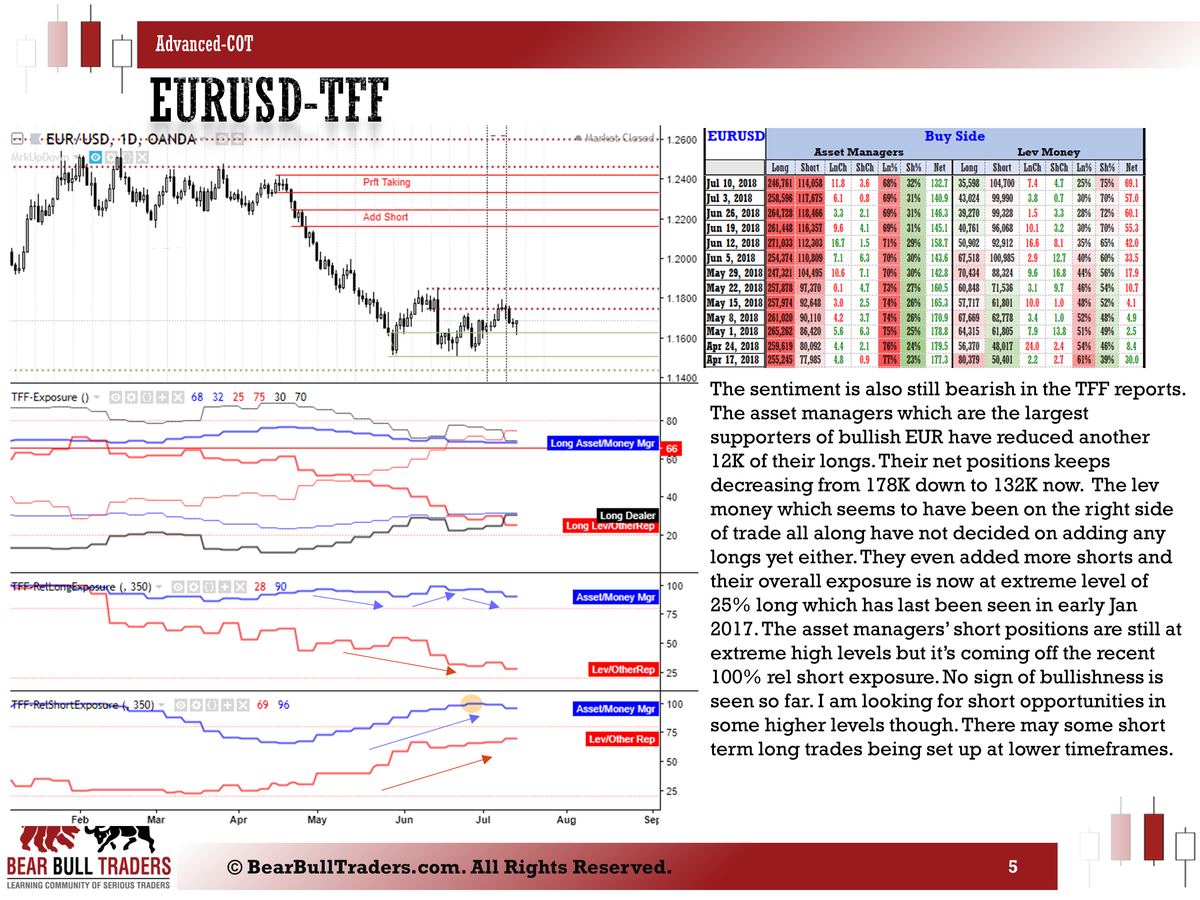
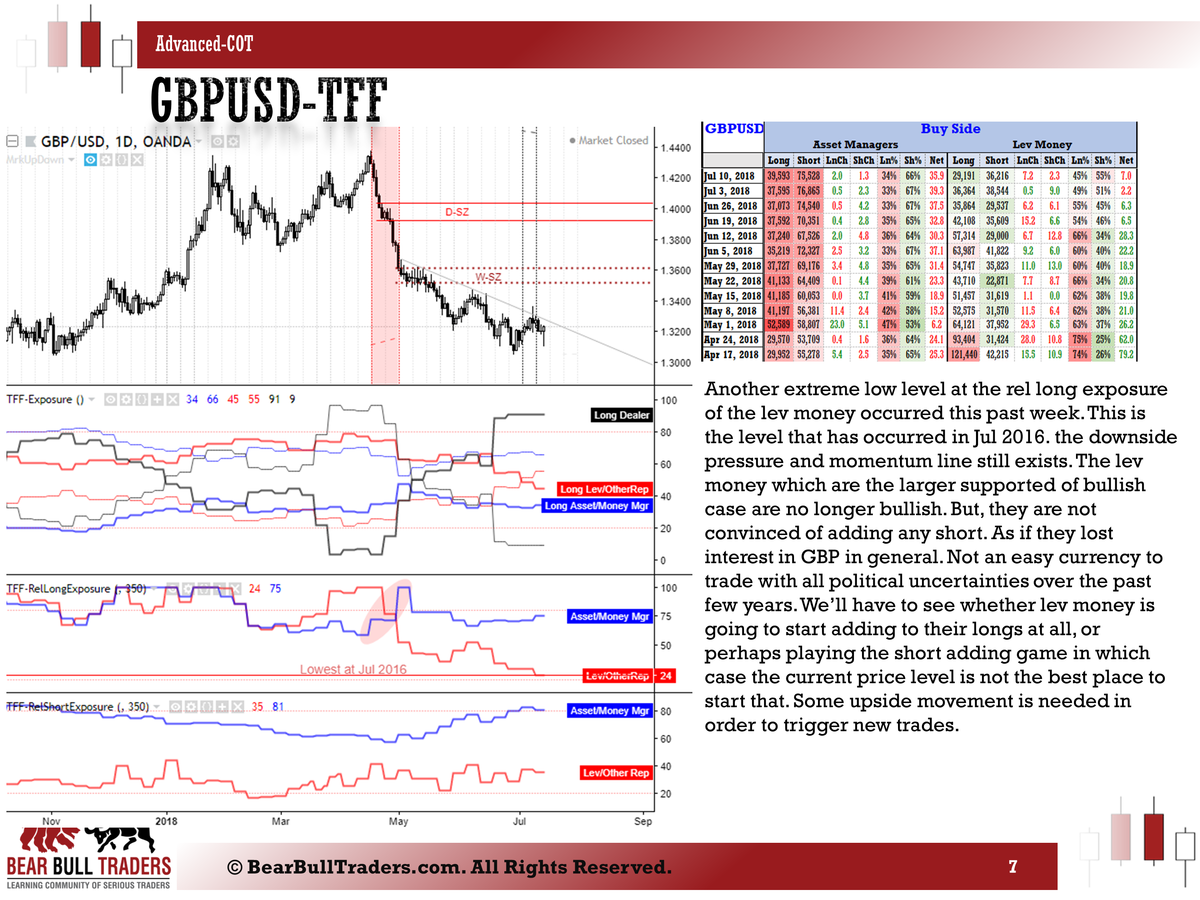
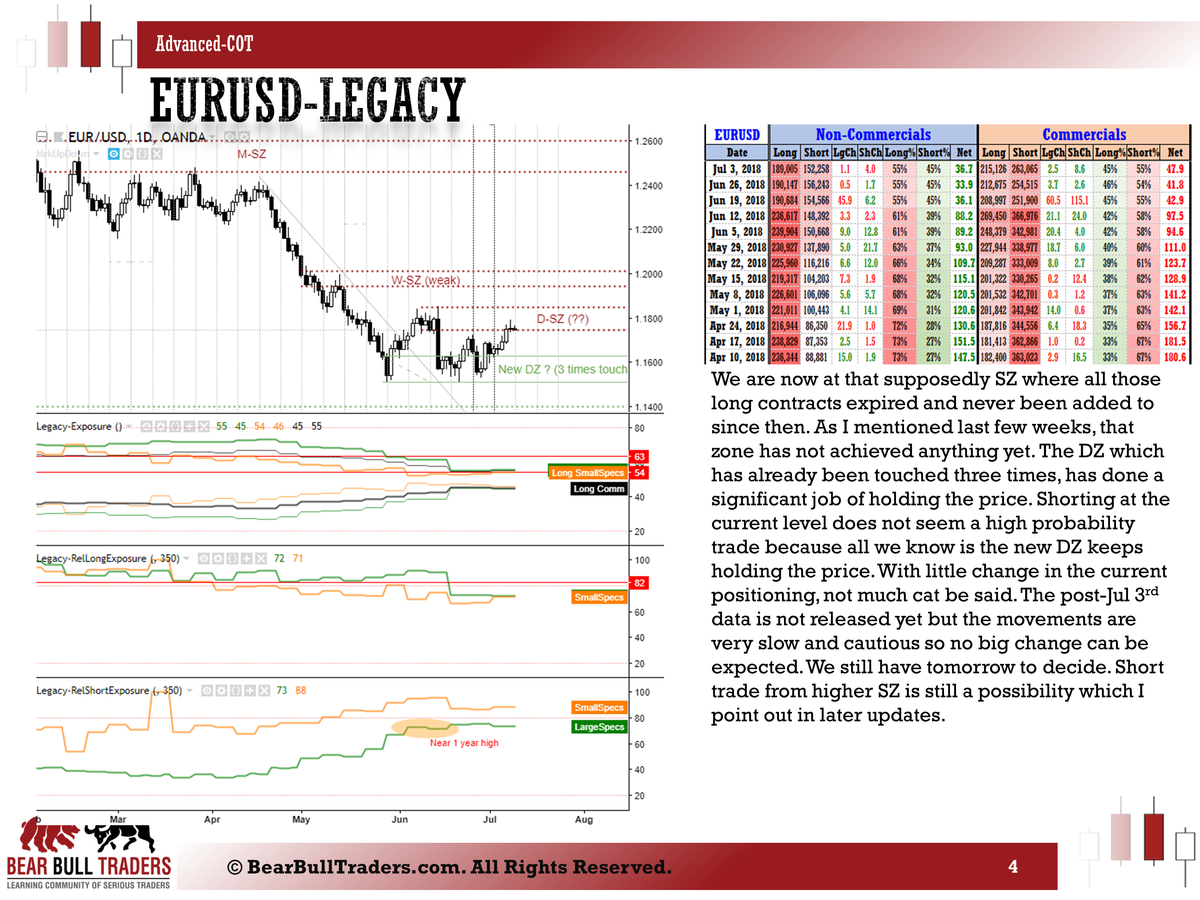
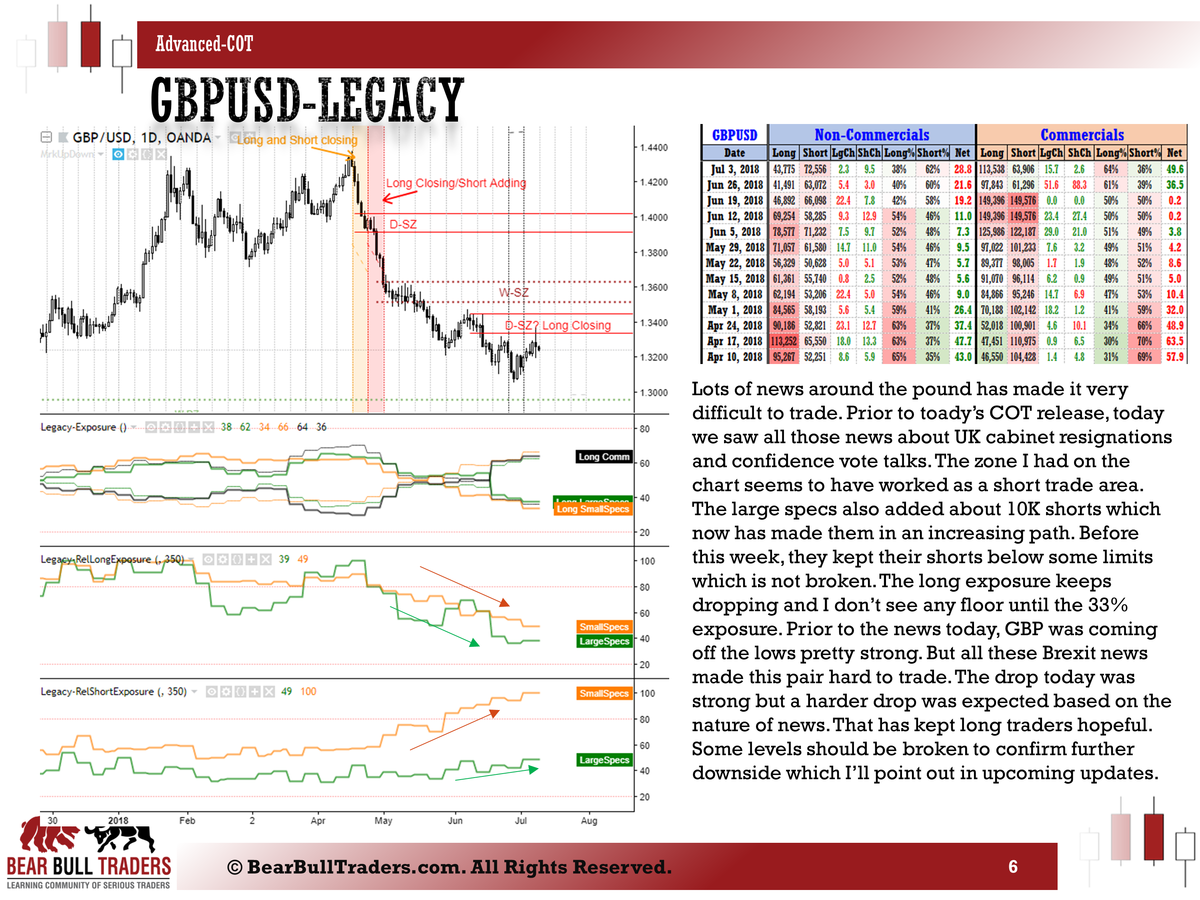
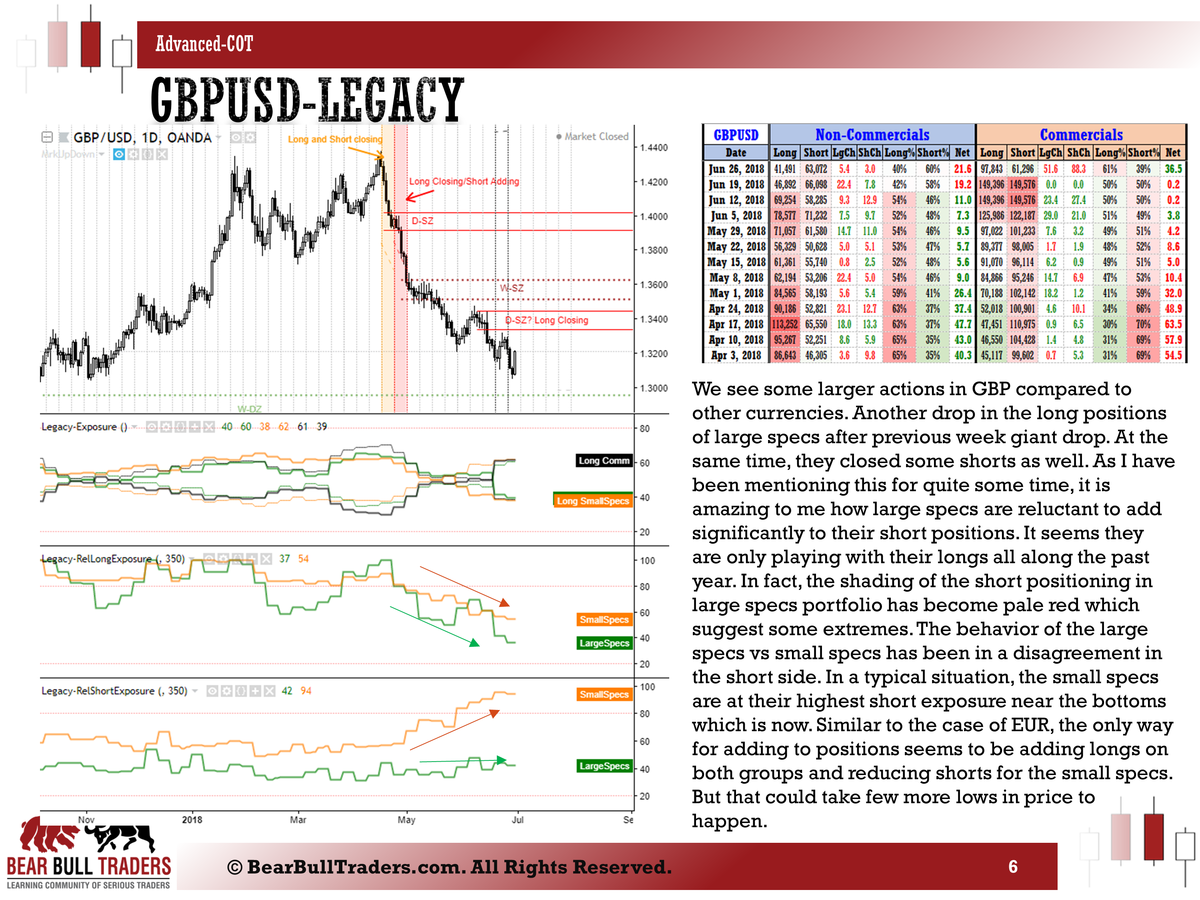
The EUR and GBP long closing were the biggest events of the past week in FOREX COT Legacy report. The movement in price is not a reflection of the position change though. The price mostly was pushing higher while the longs were being closed. Something to think about!
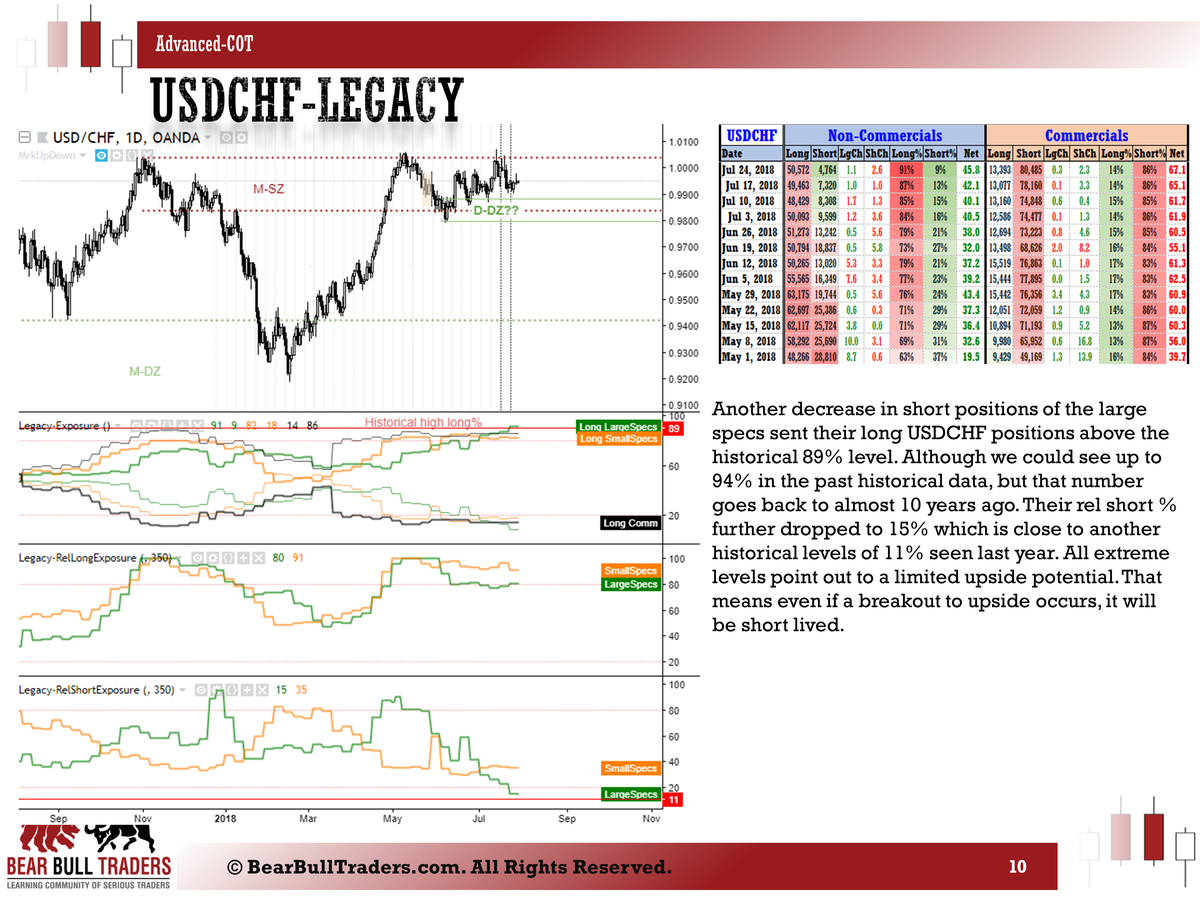
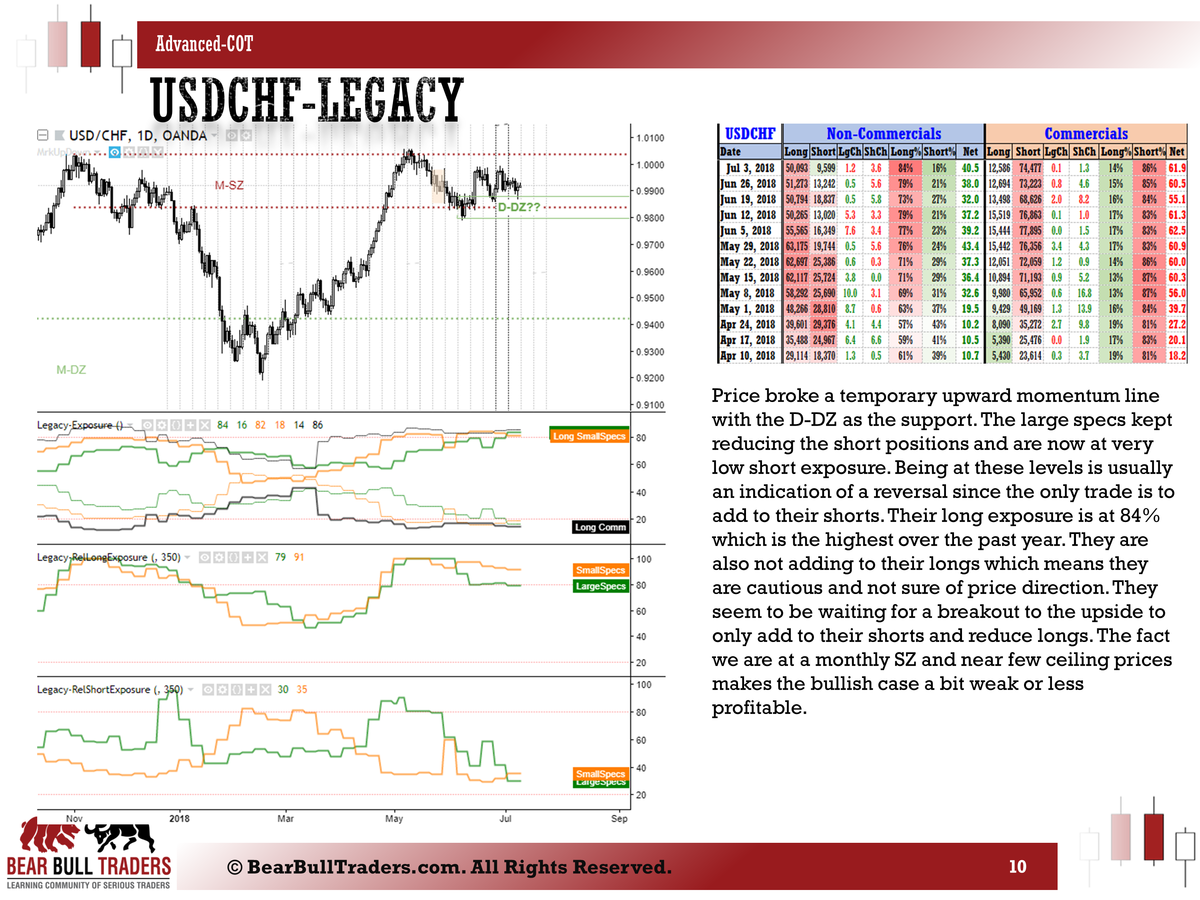
AUD, NZD, CAD and CHF longs are already in extreme low levels relative to the past 8 years.
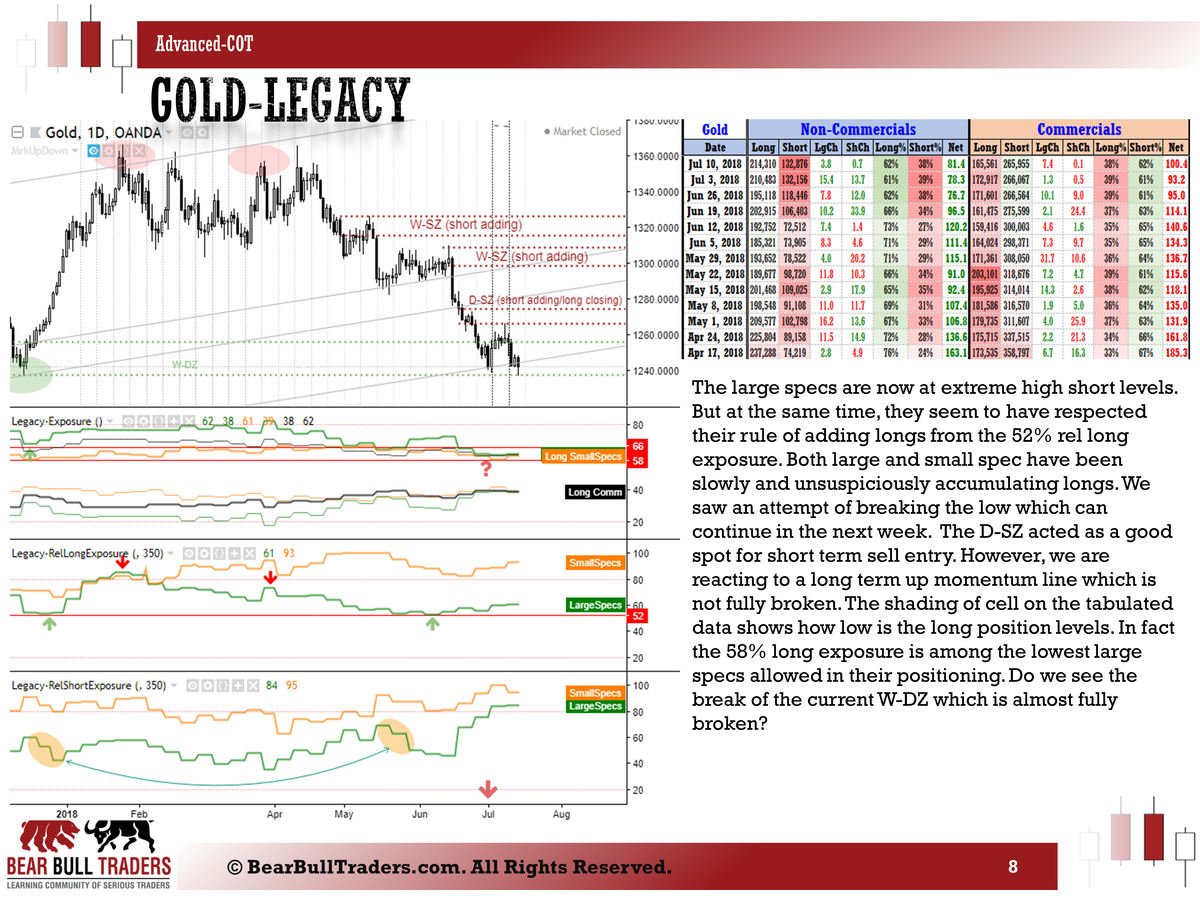
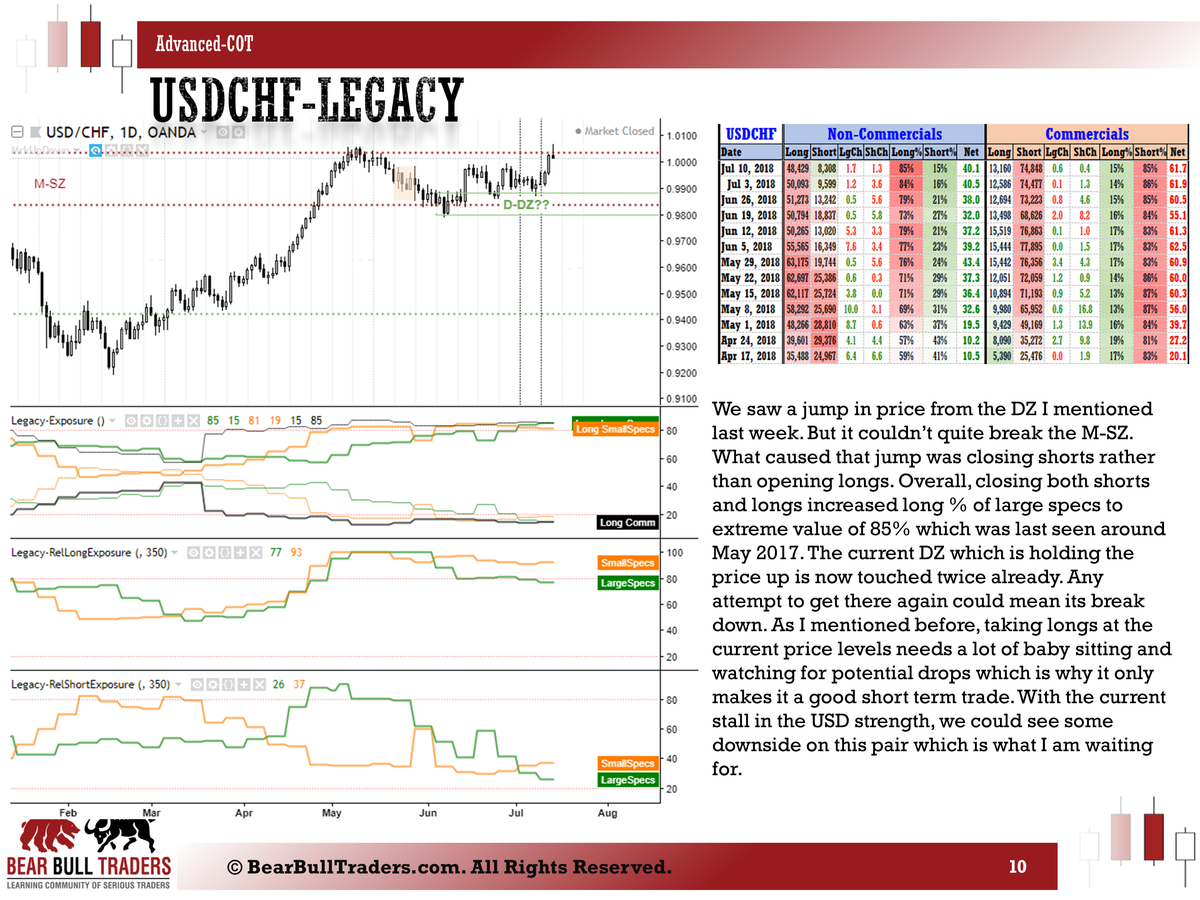
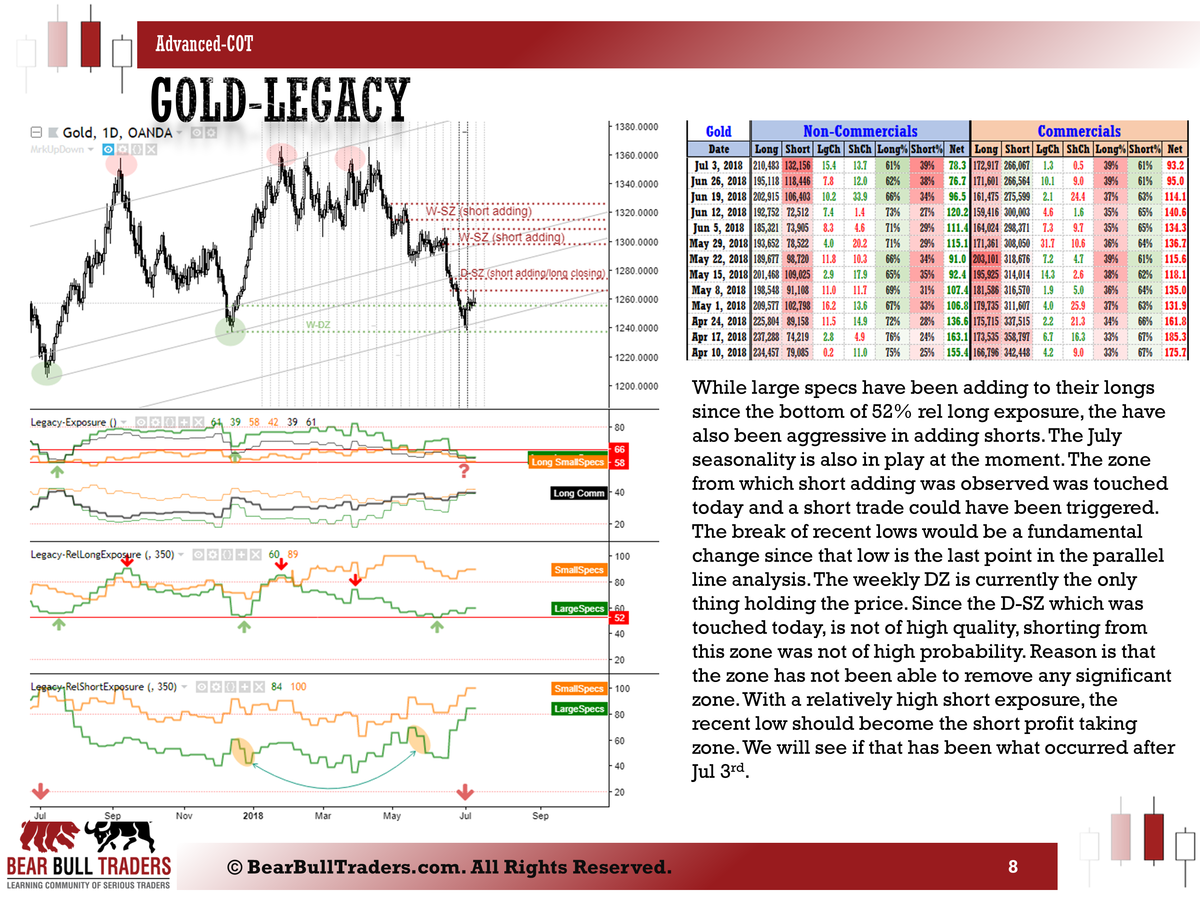
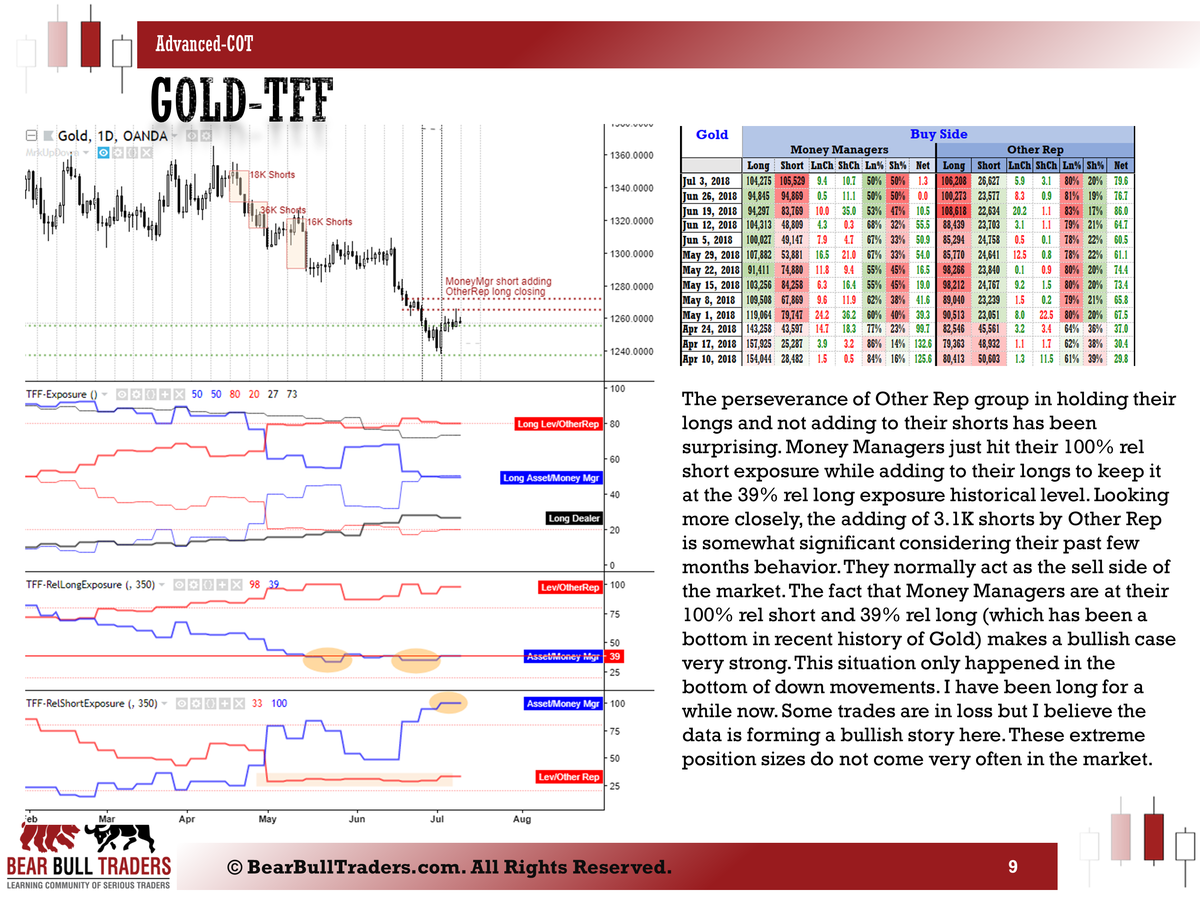
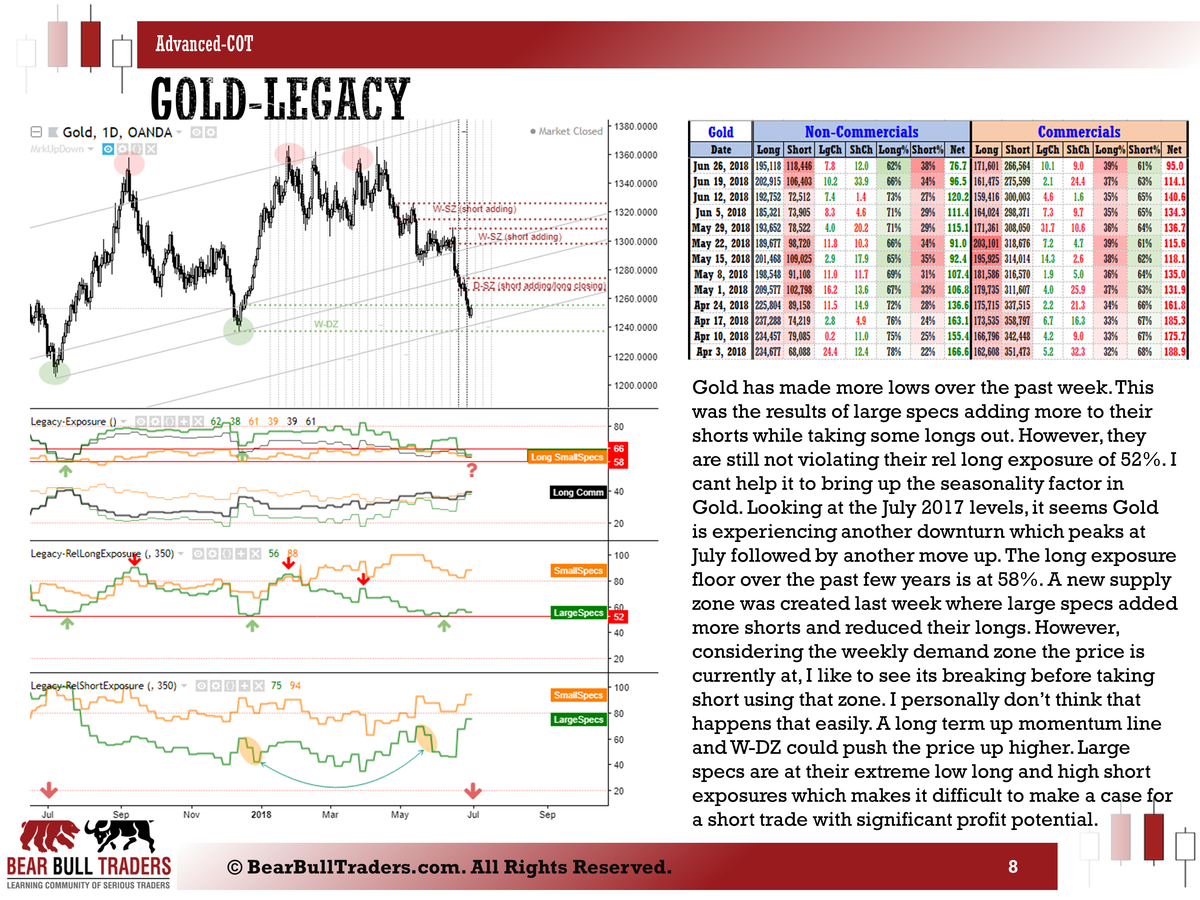
Gold saw some buying over the past week but apparently it wasn't enough to hold price from making new lows. Large speculators seem to have been in some accumulation mode lately. Oil bulls are holding their longs strong with still 88% long exposure.
More detailed analysis will come over the weekend.
For more information on this type of analysis check out the previous posts in the education section of the forum here, here, and there.
If you want to discuss further and clarify things, please send me a message to [email protected]
Zack
-
Here is a snapshot of the weekly analysis based on July 3rd, 2018 COT (Legacy, Traders in Financial Futures) reports. Traders are sitting at some extreme positing sizing levels which has to change some market directions. EURUSD is at a critical supply level, GBP is under lot of political pressure, AUD has some more upside potential to challenge a recent supply zone, Gold is at a very critical level which could change its faith if broken, CHF shorts are at unseen levels which could only go one way.
more trade updates will come in the following days.
For more information on this type of analysis check out the previous posts in the education section of the forum here, here, and there.
If you want to discuss further and clarify things, please send me a message to [email protected]
Zack
-
Here are some thoughts prior to the release of the COT report at 12:30 EST today. I will send out the weekly update based on the reports later today or tomorrow. Things are shaping up for some good trades with some confirmation based on this week and next week data.
For more information on this type of analysis check out the previous posts in the education section of the forum here, here, and there.
If you want to discuss further and clarify things, please send me a message to [email protected]
Zack
-
A Deep Dive into Commitment of Traders Data Analysis- Part 1
It has been while since the last post because I have been putting some of my data analysis techniques together in a format presentable here. As we saw in the previous post, the COT report is the ONLY source of data directly coming from the institutional traders. Beside the charts, COT is the major source of information I use on a weekly basis. Remember, news and hyped prices are only opportunities for the big players to fill their orders and nothing more. It is very rare that a news release changes the direction of institutions’ mindset. Rare, but not impossible. In this game of probability, I always go with the high probability trades not a single rare occasion.
How do I organize the data?
Short answer, in Excel.
At the end of each week on Friday afternoon, I compile the data released on CFTC website in my excel template because it is the easiest way for me to see the long term directions and decision making points in time. Below is snapshot of what I started with about 6-7 years ago.
In short, I simply copied and pasted the data from the CFTC website for each currency and performed some basic analysis on them. In particular, I was tracking what the non-commercial traders were doing each week. One of the factors I was interested in was the percentage of short and long positions, the exposure %. Its simple calculation is as follows:
Long% = Long / (Long+Short) x 100
Short% = 100 – Long%
I was looking for extreme points where these traders had the maximum or minimum exposure for over a period of time like the past year, or 2 years. I will discuss more about what time period to look at in later posts.
Later on, I found easier ways to display my data using built-in excel features. I had to take such steps because looking at multiple data series for different pairs and two different formats (legacy vs. TFF format) was tiring.
The current format I have on my excel is not that different from the old one except there are more coloring based on the historical values of the positions and extreme points in position sizing. Figure below is the most recent format that I have been using for few years now. I have not implemented more sophisticated excel features because I simply don’t need to. Besides, I have put my efforts on some time series coding on the charts directly. That will come in the coming posts.
It looks nicer, in my opinion. Now, instead of looking for extreme exposure and position data, the color coding allows me to see them much faster. The legend shows how I applied my color coding. The smallest number in a range gets the green and the highest values gets the red. Numbers in between the two take a gradient color with white being right at the middle. Being too green or too red is extreme!
Net positions!
The net position number is the one you see in most websites that report the COT data in a graphical right below their charts. See this one for example
https://www.barchart.com/futures/commitment-of-traders/technical-charts/E6*0
My personal experience with the net positions has not been satisfactory. For some reason, I want to see the actual long and short contracts rather than the net. I can get a better vision of what the traders did over the week using their actual long and short position changes. For that reason, you see me often not paying too much attention to the net positions. I thought I should clarify this here.
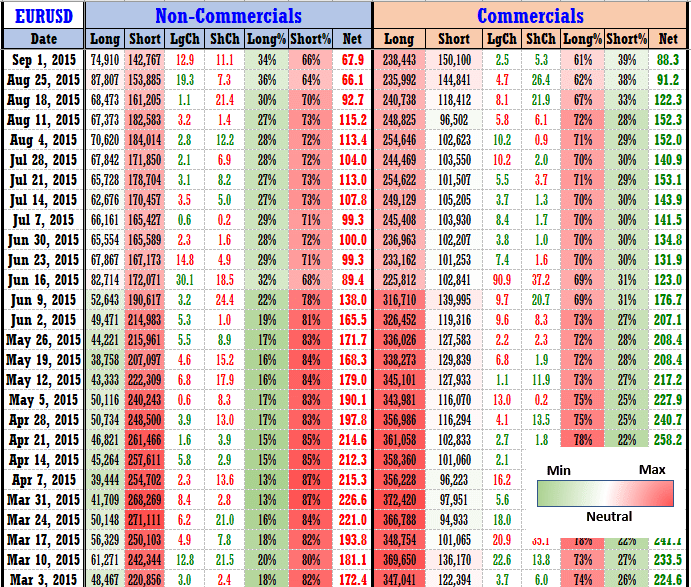
Example of Analysis
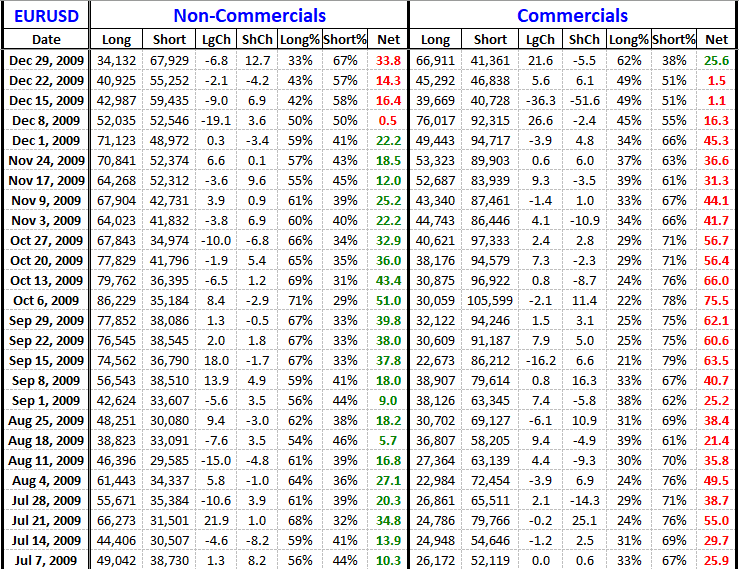
Figure below shows a snapshot of the EURUSD chart and the tabulated COT data during the year 2015.
I have highlighted few datapoints on the chart and their corresponding number of short positions held by the institutional traders. Just tracking the short positions, we can see that during each swing low, the number of shorts has consistently decreased. The shading of the absolute short positions and the exposure % suggests that these traders where at extremely high short exposure prior to March 17th. Over the next few months, they have been taking profit off their short positions which is why the number was decreasing. Seeing this, looking for a long trade is not a bad idea. And as you can see, after the Jul 21st, the previous high was broken. The long trade after the May 26th or Jul 21st data would have been a really good trade.
Another insight: since the Dec 2014, they have been adding to their shorts as the price was going down. Now, they are not adding shorts during each period that the price goes down. The is a change in behavior. And a SIGNAL.
Please note that this is only an example of using one parameter to see into the mindset of the big players. The more we analyze the numbers including the % exposures and long positions, the better we understand their trades. Eventually, we want to trade with them. The data is delayed (and you hear everyone saying that about the COT reports), but these traders are also SLOW! It took them 5 months to get rid of 72,000 short contracts each worth EUR 125,000.
How to survive the turmoil
The process of decision making after you figure out some pattern in the data is still complex. Here, I provide some key notes that helps you get better entry points and also test out your analysis in real time. These are my experience over the years and of course, every situation demands its own decision making steps which depends on the market dynamics at the time.
Once you see a pattern in the data, benefiting from it is a matter of how you place your orders. There will be ups and downs before the giants make their final decisions so:ALWAYS split your orders into smaller portions.Test out the idea with smaller orders and try to think as If you are working with the big players.Use the time of news to your advantage.There will be times when all your orders are in negative, but you need to learn to trust the data. You will build a sense of how to spread out your orders to get the best price for yourself.Mark up your supply and demand zones. Make sure you do that using at least three timeframes.These big players report their positions on weekly basis so allow yourself at least a week to test the idea and observe what they have done in the past week.Also remember, you are only seeing the data up until Tuesday so what they did in the three days after that day is not in your report. But you can always go back to the charts and observe the price action. Depending on the nature of each institutional trader’s behavior, you will learn if they will be adding shorts on the way up or down. Similar for the long positions.
Overall, this is a quick review of your journey into the realm of data analysis and why you need to understand the positioning of the big players in the market. As I have been using these data series for a long time, I feel my analysis will be incomplete without them. More of this sort of data analysis will come.
If you need further information or want to clarify something, please do not hesitate to drop me a message at [email protected]
Fore access to more advanced materials and Forex Topics, please sign up below the Forex Trading page:
https://www.bearbulltraders.com/forex-trading/
Zack
-
Best Times to Trade Forex
Forex market is open 24 hours a day, 5 days a week. So, does that mean you can trade forex throughout the day, wherever in the world you are?
The answer is “it depends”!
It all depends on your style of trading. For a long term trader, the time od the day is irrelevant. Long term forex trades, who are looking for days and weeks of building their positions, the time of the day is not important. However, the times of high volatility serves them the benefit of being able to fill their orders at the price they want, and not at the price market forces them.
In contrast, short term traders are heavily relying on the time of the day. Why?
For this type of trading, high volatility in the market is a must. Another important factor in short term forex trading is the spread. During the times of low volatility, the spread become wider because brokers always have to make money from your trades! So, when the market is volatile?
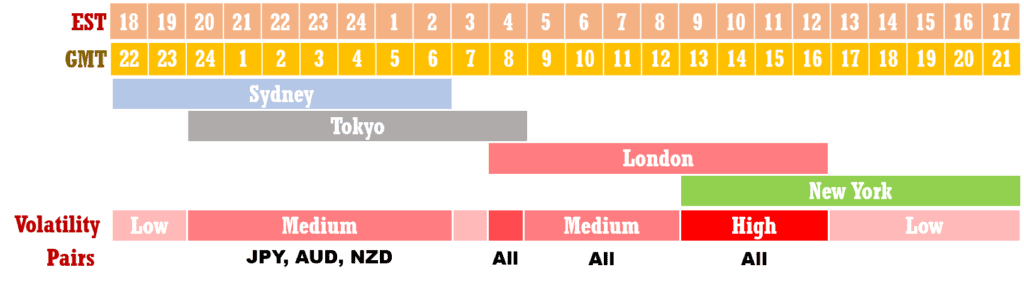
This image demonstrates a snapshot of major forex markets around the word with their open and close times in both GMT and EST time zones. As one can imagine, the times of overlap are best for ensuring high volatility and low spreads. However, depending on the time of the day, some pairs might be preferred over others. This is the case during the Asian session when the JPY, AUD and NZD pairs are most active. During the London session, all the pairs are tradable. This is due to the big portion of the London market in the entire forex market (about 37% of the entire market). To put in perspective, New York and Tokyo are responsible for 17% and 6% of the overall market share. So, essentially sticking to the London session can be a good choice for starters. The most volatile session is the overlap of the two biggest markets, London and New York. This the most volatile with lowest spread during the day.
So, if you are planning to start short term trading in the forex market, pay attention to these times of overlaps to take advantage of the low spreads.
Another important factor impacting the volatility is the economic news. These are large central banks decisions on the rates, inflation reports, job reports, etc. While the volatility is extremely high during the news release, it does not mean they are tradable in terms of short term trading. The spike in the volatility comes with the large spreads in all the pairs involved and affected. This is also to ensure the brokers make their share of profit during these times. This is more explained in the structure of forex market in our education page as well as our book.
You can find the information regarding the exact time of these news release, the expected numbers and previous release number in many forex news outlets. Common outlets that I use on my PC and mobile are listed below:
https://www.myfxbook.com/en/forex-economic-calendar
https://www.dailyfx.com/calendar
Zack
-
Institution Footprints
Supply and Demand is the only force in the market, everything else is the noise.
We buy “stuff” on a regular basis in our daily lives. Things we need and things we think we need. (George Carlin’s description of “stuff” is much better, so I stop here).
The price of anything we purchase, from our grocery to our iPhone or house, is determined by the fundamentals of supply and demand. A bottle of coke is $2.50 because we are willing to pay $2.50. If 70% of population decides not to pay that much for the coke, then the supplier must decrease the price until the customers come back and buy it. An iPhoneX is $1,000 because we are willing to pay that much for it. If more people want to buy it and Apple cannot increase their production capacity, then the price would have to go up. Because there is demand for it.
Anyhow, our lives are affected by this single rule of economics so why shouldn’t it be the single rule in trading? Trading sits at the extremity of the world we live in where everything has a price. There are no human morality principles in this part of the world. You cannot ask a favor from your broker, imagine this conversation:
You to your broker: Could you do me a favor, close my order at breakeven, I got stuck cleaning the bath tub and forgot to move my stoploss there. I owe you one buddy!
In the case of an institutional trader, supply and demand is THE ONLY game in town. They must buy or sell at the best price or else they lose money. And they NEVER lose! If an institution was willing to pay for an instrument, a stock or currency pair, at a certain price level, what makes them stop doing it again next time?
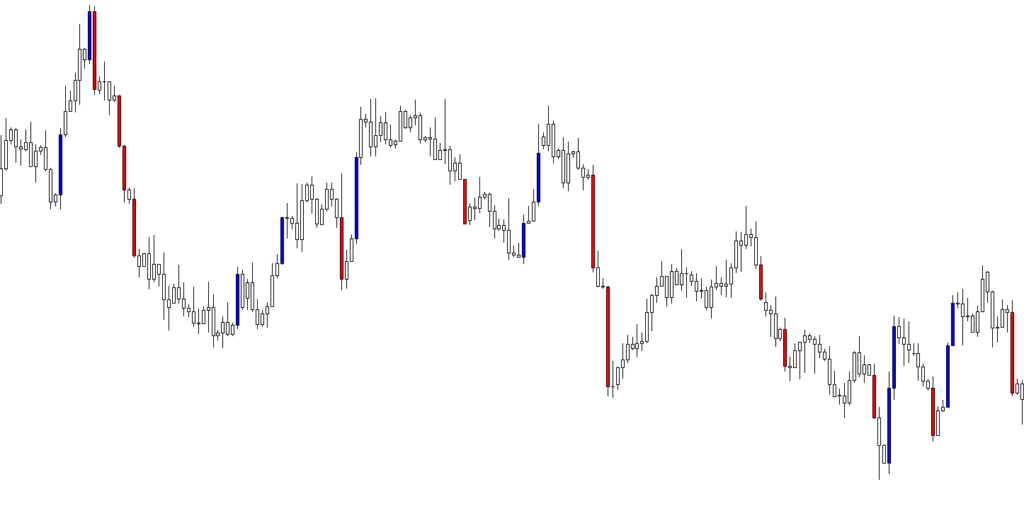
As I mentioned in previous posts, the only signal you get from institutions is their big orders flooding the market. And you see it on the chart as big body candles similar to what you see here:
This is different way of looking at a chart, there is not green/red or white/black coloring of the normal candlestick charts. I programmed the chart so that it only shows the giant body candles (it’s a code, so there are always flaws). What if you always see the chart this way. What if you have never ever seen the conventional type of chart and this is the first candlestick chart you see in your life. I can assure you that you would think different than 99% of traders in the forex market. Does that mean you would think as an institutional trader? No!
But, you are one level closer to their game than the rest of retail traders. In my opinion, these large body candles are the RESULTS of big players deciding to move the market in a particular direction. Whether it is a direction of their interest or not, is something for future posts. My point here is that you and I, and every single trader in our community all together would not be able to create such a move in the forex market. The key concept here is PROBABILITY!
It is more probable that the giant candles have been create by the institutions rather than retail traders.
So, if you know where an institutional decision has been made, you know where they might make similar decision again. That is the basics of finding the institutional footprints but, there is more to it. My book covers these concepts in more detail and I plan to provide more insights here on our community platform. So, stay tuned and communicate your questions here. I’m more than happy to help in any way I can.
Fore access to more advanced materials and Forex Topics, please sign up below the Forex Trading page:
https://www.bearbulltraders.com/forex-trading/
Zack
-
Short vs. Long Term Forex Trading
There are two general styles of forex trading, which are distinguished by their time periods: short term trading (similar to day trading and scalping) and long term trading (similar to swing trading or position trading). For someone new to trading who has only heard about the wall street in the movies or news, the idea of trading most likely is something close to the long term trading style. This style of trading includes buying or selling a security, stock, or a currency pair over a relatively extended period of time. What is a relatively extended period? It depends. For a stock, a swing trade could take a few hours, days and even months. The goal is to benefit from the long-term swings in the price without worrying too much about the noises in the minute charts. A swing trader would open a trade with a defined stop loss appropriate to the trade timeframe. They would perhaps check on the status of the trade once a day and analyze the market sentiment. In the case of a good opportunity, they could add to their position to maximize profit. They would eventually exit the trade once they have made their target profit.
In the forex, swing or long term trading could expand from 30 minutes to hours and few days. There is also another category of traders with this style who are “position traders”. They add to their position along the way and watch the market carefully to extend their profit for months or even as long as a year.
In contrast to the first style, day trading or short term trading has different implications. A big portion of BearBullTraders community are focused on day trading in stocks and many useful materials could be found in our community online platform.
In forex, short term trading has a similar definition. Based on the time of the day, such as London market, New York market or Tokyo market, forex traders choose to trade only in these volatile sessions. They often open and close trades within few minutes (usually less than an hour). A subcategory of the day trading style is “scalping”. Scalpers are those who benefit from any small movement in the price action. They enter and exit a trade within seconds and at most a few minutes. This style of trading requires a large amount of capital or leverage, besides uninterrupted presence in front of the trading station.
Both styles of trading have their own pros and cons. I trade both styles and try to post my ideas in the forex trade ideas section of our forum. My personal preference is long term trading because it matches my life style and requires less intense and spread out attention.
Fore access to more advanced materials and Forex Topics, please sign up below the Forex Trading page:
https://www.bearbulltraders.com/forex-trading/
Zack
-
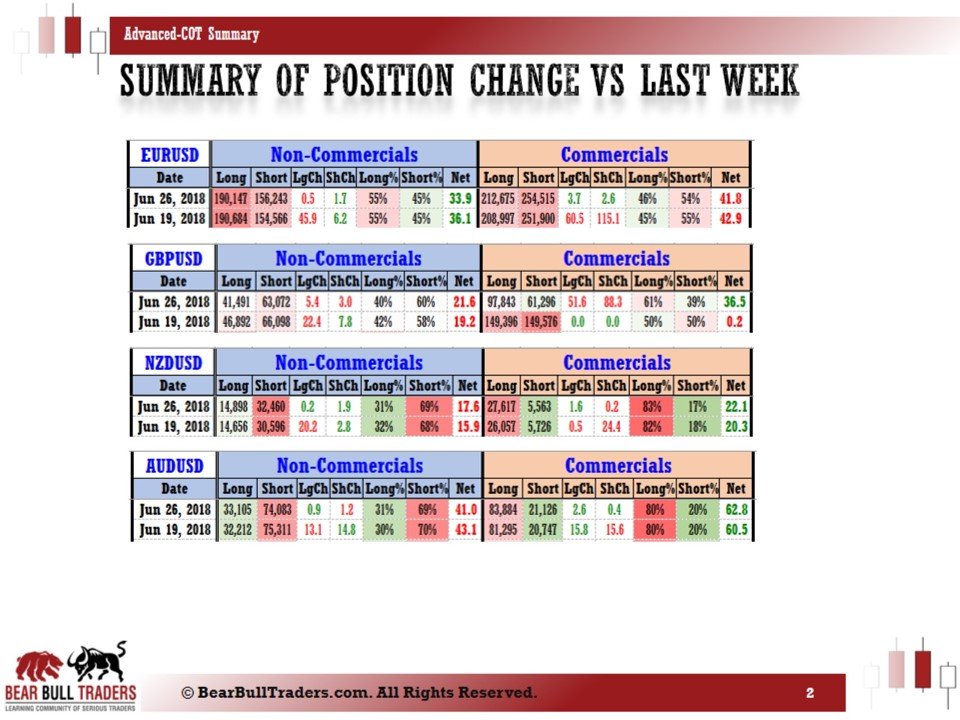
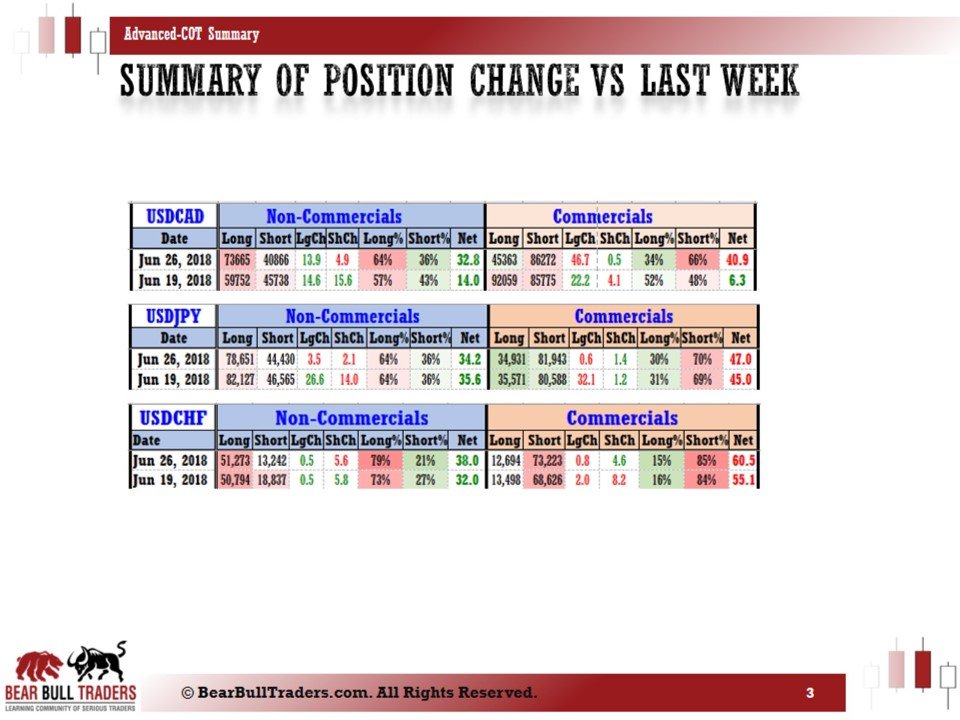
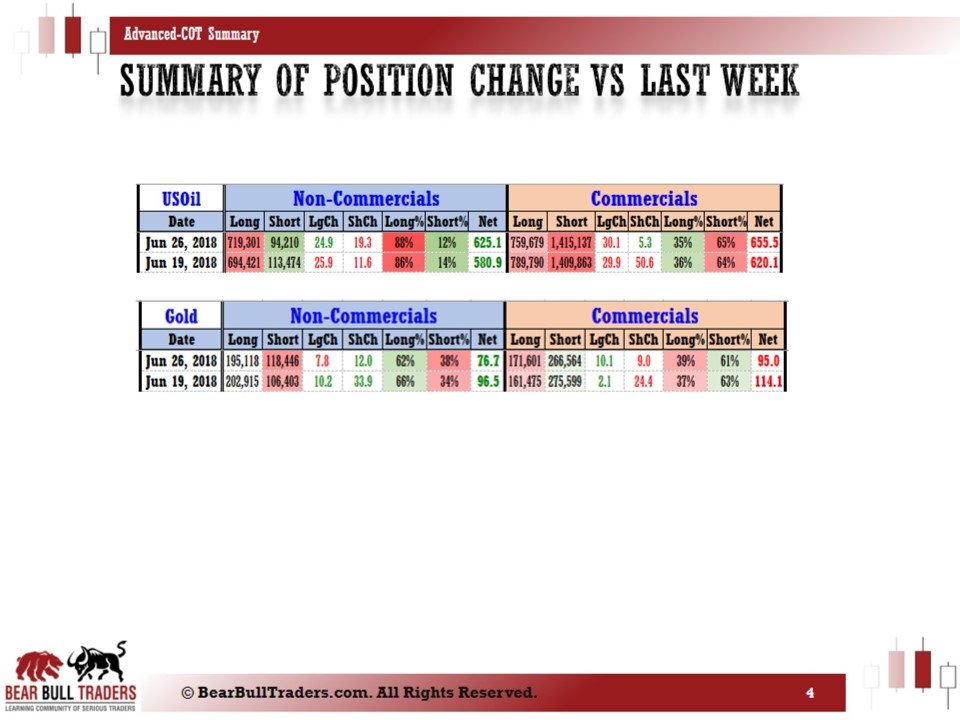
Here is a snapshot of the weekly analysis based on June 26th, 2018 COT (Legacy, Traders in Financial Futures) reports. Overall, not many significant moves were seen after the previous week giant moves. I am waiting for confirmation of some demand zones being created or breakdowns of other levels which signals further movement in the trend direction.
For more information on this type of analysis check out the previous posts in the education section of the forum here, here, and there.
If you want to discuss further and clarify things, please send me a message to [email protected]
Zack
-
Here is snapshot of the changes in the positions of the institutions based on the COT Legacy report at the end of Tuesday June 26, 2018. More detailed analysis will come over the weekend.
For more information on this type of analysis check out the previous posts in the education section of the forum here, here, and there.
If you want to discuss further and clarify things, please send me a message to [email protected]
Zack
-
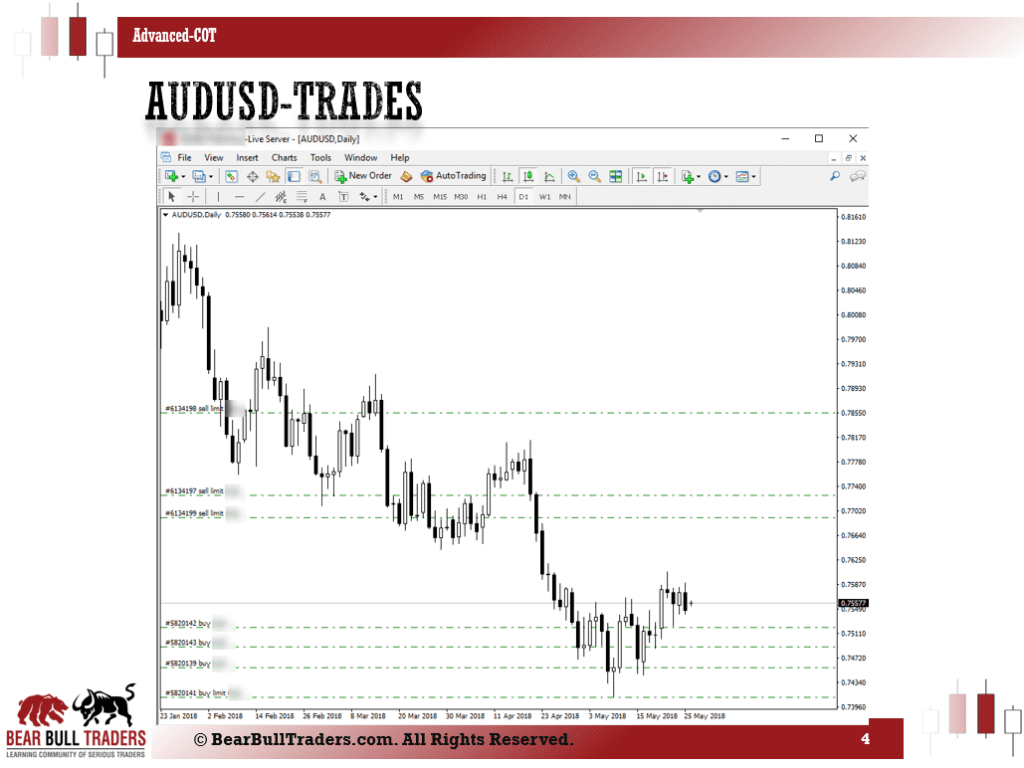
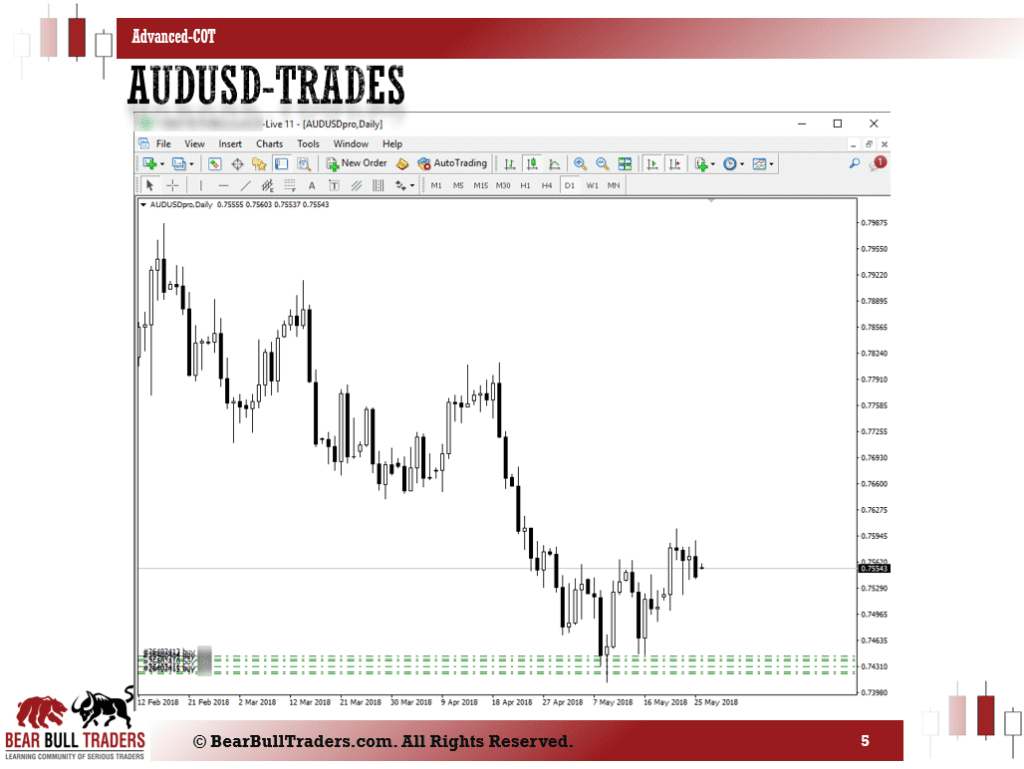
AUDUSD Trades based on May-22-18 COT Report
The trades based on my analysis of AUD COT report which I posted here, are shown below.
The reason I am showing two different trade stations is to emphasize the importance of risk appetite as well as risk management which I fully explained in my book. You can clearly see two different mindsets when looking at these two trade platforms. The amount of leverage, the overall risk compared to my capital are among the key factors in each account.It is your responsibility to know when and where to start a position. When building a position, we need to understand to overall risk and spread our orders to capture as much profit as possible.
For more information on this type of analysis check out the previous posts in the education section of the forum here, here, and there.
If you want to discuss further and clarify things, please send me a message to [email protected]
Zack
-
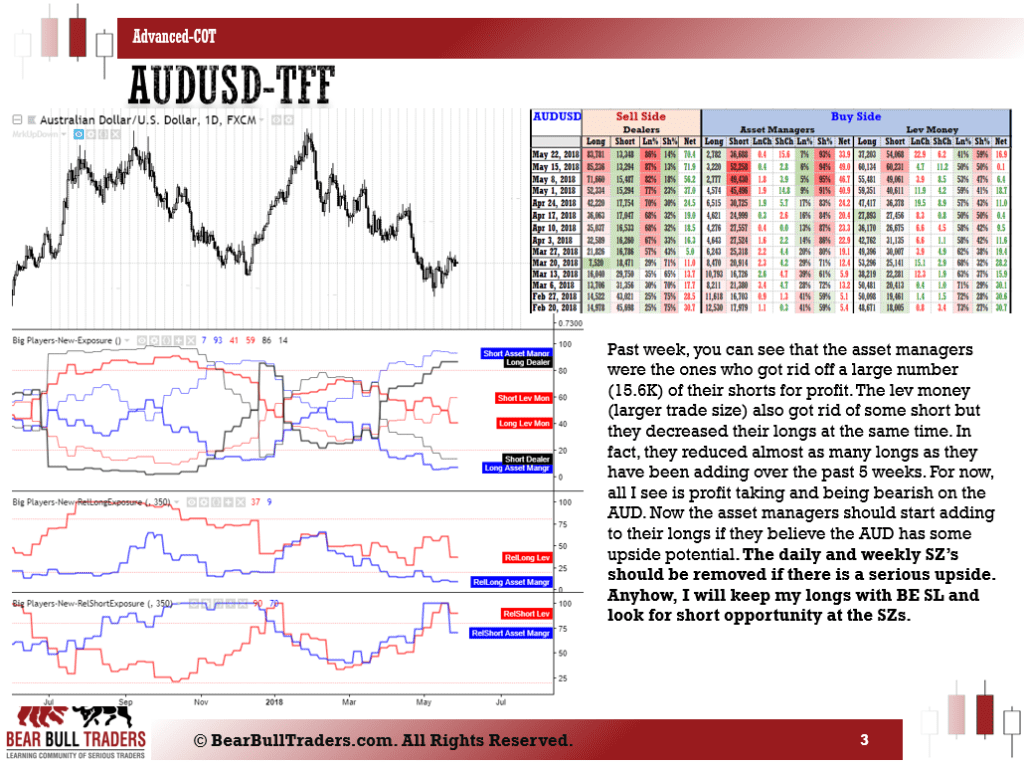
AUDUSD Analysis based on May-22-18 COT Report
Summer is the time of year which I make my best effort to enjoy the nature, this one is what I took from a lake not so far from where I live.
Snapshots of my analysis on the AUDUSD based on the May 22nd COT report are shown below. The trades based on this analysis are posted here. I had noticed some extreme levels in the short positions in previous week, some of which I posted here. Taking profit on some of those shorts was the main reason for some upside on AUD which I also took advantage of. I still see a bearish case on the long term for AUD but there is still some more upside until we reach to some good short opportunities.
For more information on this type of analysis check out the previous posts in the education section of the forum here, here, and there.
If you want to discuss further and clarify things, please send me a message to [email protected]
Zack
-
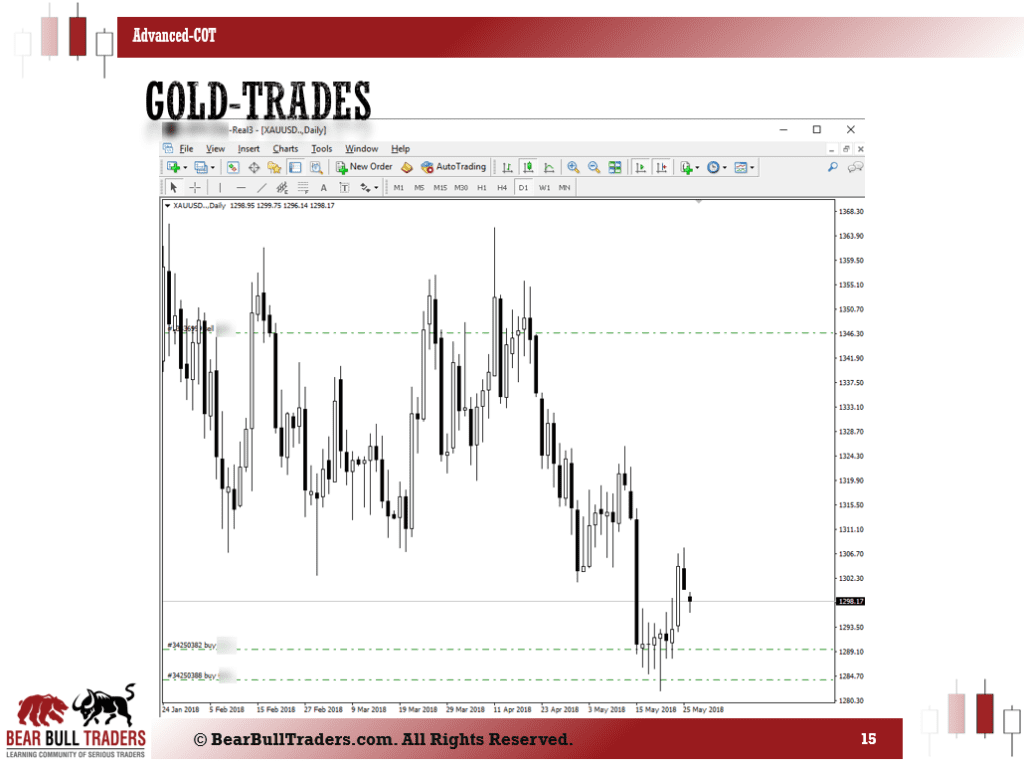
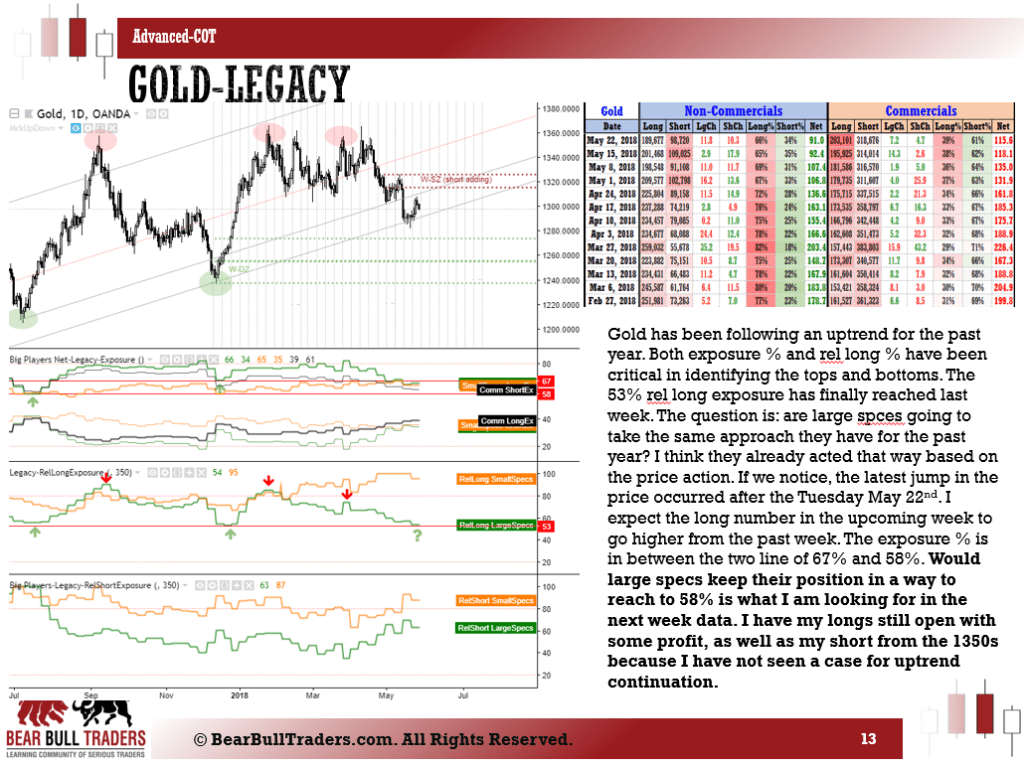
Gold Trades based on May-22-18 COT Report
The trades based on my analysis on Gold which I posted here, are shown below.
I am still expecting upside because I do not see a case for bearishness in gold. The behavior of the large players in Gold follows some rules which I sometimes see in my analysis.
For more information on this type of analysis check out the previous posts in the education section of the forum here, here, and there.
If you want to discuss further and clarify things, please send me a message to [email protected]
Zack
-
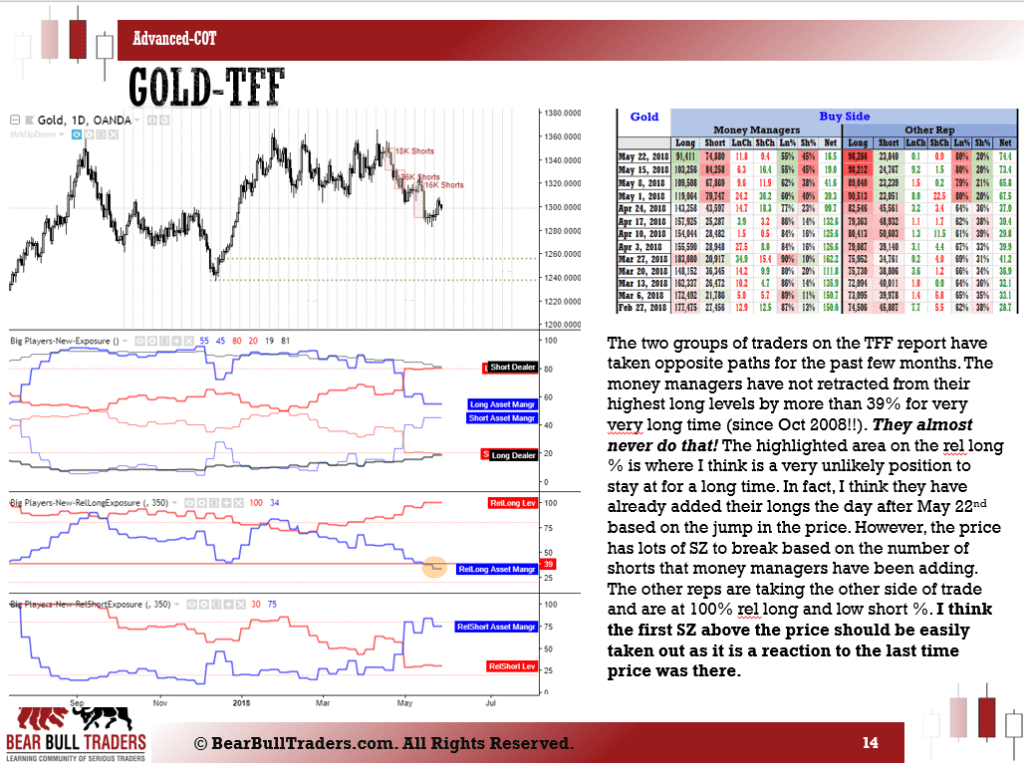
Gold Analysis based on May-22-18 COT Report
Walking down the street near my place, I always take a picture from this one. I hope you enjoy it.
Snapshots of my weekly analysis on Gold based on the May 22nd COT report are shown below. Gold traders are much more predictable in their behavior compared to other instruments in my opinion. It feels like there are certain "unwritten" rules they follow. The trade idea based on my analysis are posted here. I hope my notes help you see my thought process.
For more information on this type of analysis check out the previous posts in the education section of the forum here, here, and there.
If you want to discuss further and clarify things, please send me a message to [email protected]
Zack
-
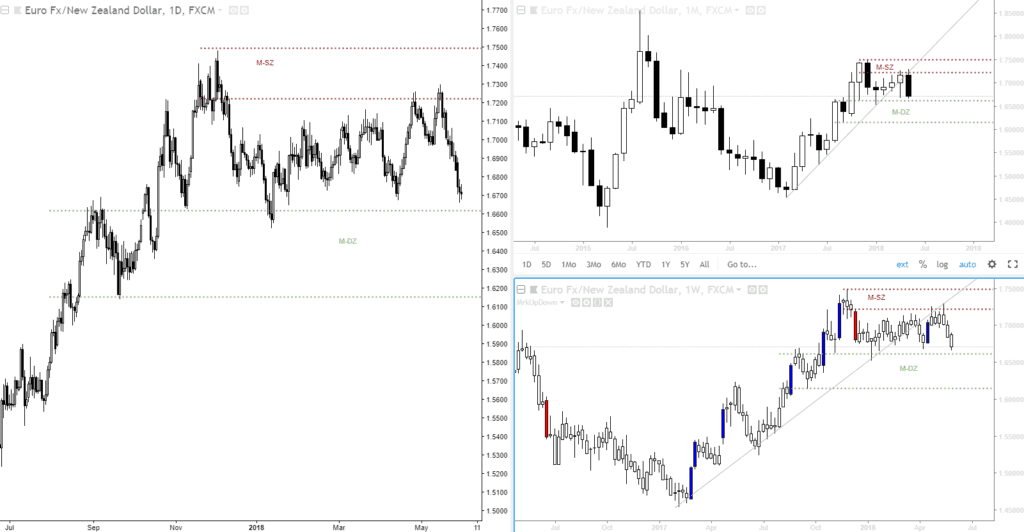
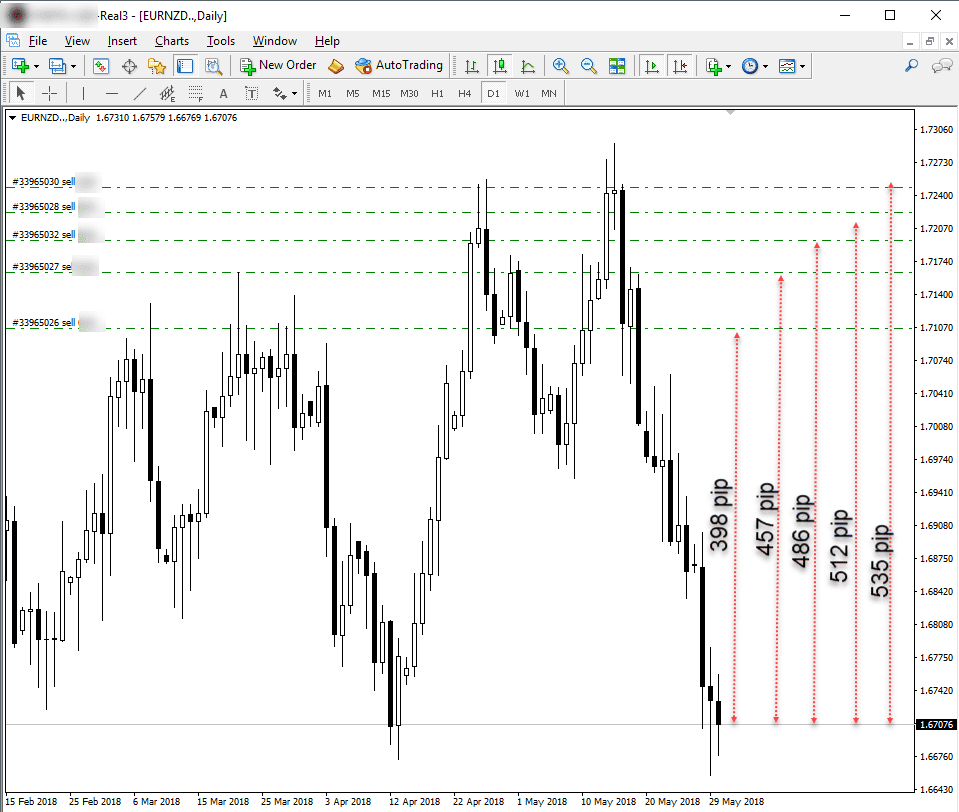
EURNZD-Supply & Demand- From May 1, 2018
Status: Partial Open
Profit: >2380 pips
This trade was opened based on the Supply and Demand analysis which I explained in a previous post as well as my book. Starting end of April and into May, I noticed a reaction to a monthly and weekly (inside monthly) supply zone on the EURNZD. It coincided with the beginning of weakness in EUR and almost all other currencies against the USD. The breakdown of the momentum line was also another reason for me to believe there is a potential for some downward movement. The three time frame analysis below show what I noticed and how I analyzed it.
If you notice, upon the first touch of the SZ, I opened a short trade. There is never a guaranteed method for when to open a trade. Many times, the trade cal and will go against you. But remember, it does not matter if it is against your trade. We as retail traders do not have any impact. The more important point is to realize that in its best case scenario, we are in a game of probabilities. If I see high probability for a movement in price, I will trade based on it until that probability become reality.
As you can see in the snapshot below, I was "under the water" in almost all these trades before they became profitable. When you trade based on monthly and weekly time frames, you simply remove the "emotion" variable from the equation. As I often say, THERE IS NO EMOTION IN A WEEKLY AND MONTHLY CHART. All the trades except for the first short were opened when the price was running against the direction of my prediction. But I simply cannot ignore the probability of the price moving down from a monthly zone. If you have read my book, you know where my stoploss would be. and you can imagine why you don't see any stoploss in my chart.
As you see on the analysis of my chart, the first target is almost hit, which is why I will close one or two of these trades. However, I would never close a trade if the setup has not fully completed. It is not relevant how many pips have been gained over a trade. The setup must be completed which is why I am still looking for further down move on this pair.
I will update as the case evolves over time.
Zack
-
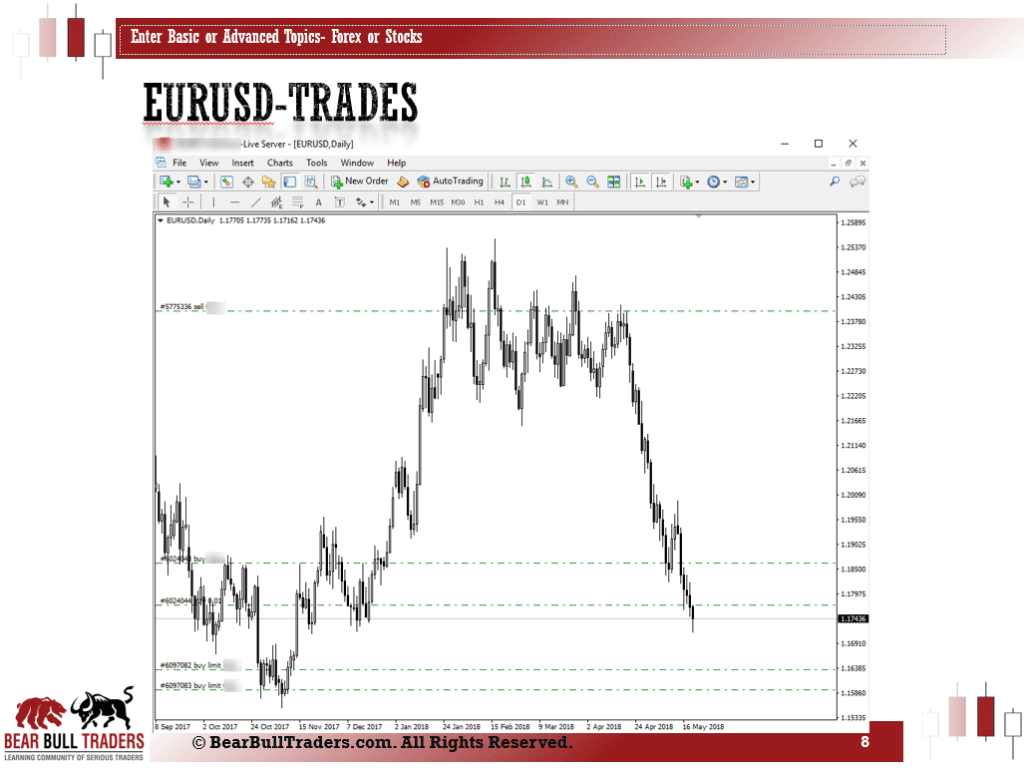
EURUSD Trades based on May-01-18 COT Report
Below are my trades based on the COT report analysis on May 15th, 2018 which I posted here.


FX Weekly Analysis based on July-31-2018 COT Reports
in Forex Trade Ideas
Posted
Here is a snapshot of the weekly analysis based on July 31st, 2018 COT (Legacy, Traders in Financial Futures) reports.
More trade updates will come in the following post.
For more information on this type of analysis check out the previous posts in the education section of the forum here, here, and there.
If you want to discuss further and clarify things, please send me a message to [email protected]
Zack