

Zack Zarr
-
Content Count
128 -
Joined
-
Last visited
-
Days Won
1
Posts posted by Zack Zarr
-
-
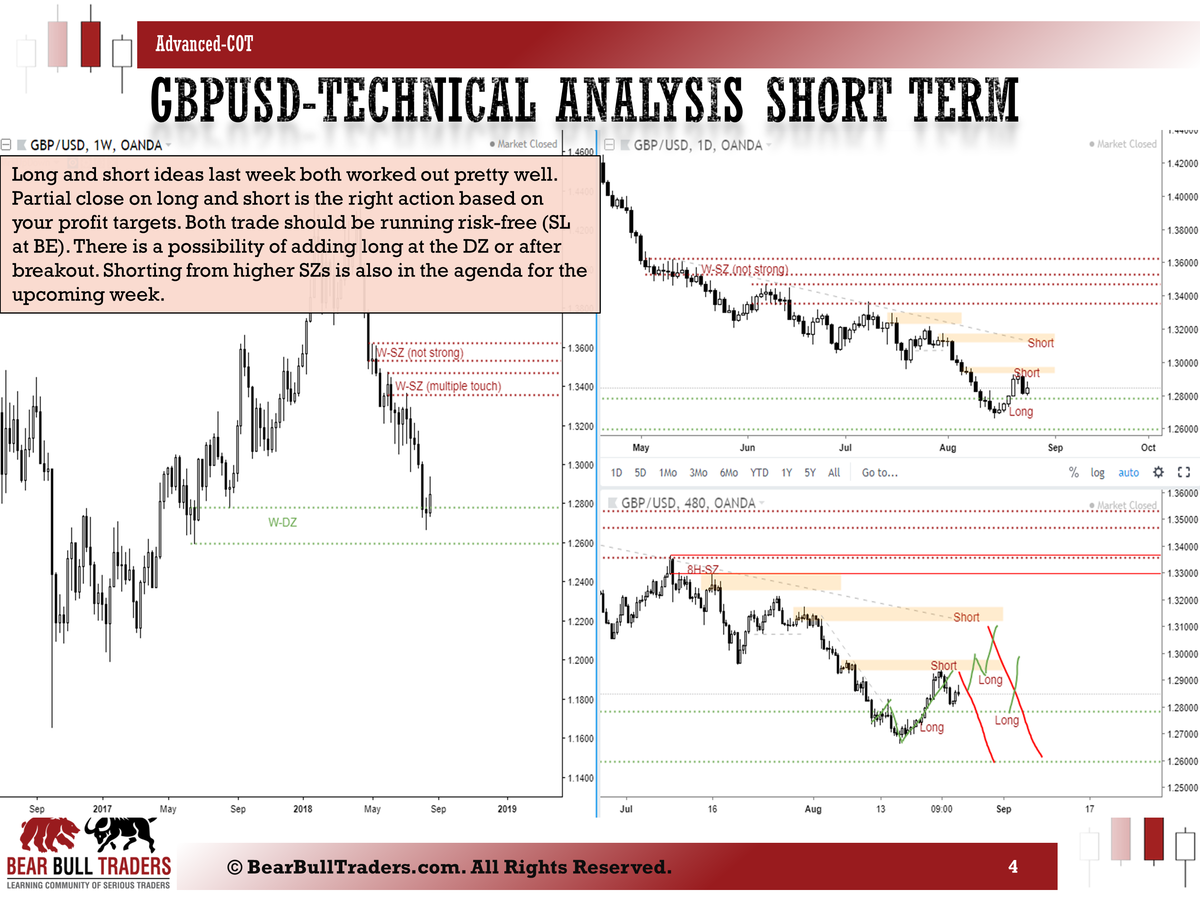
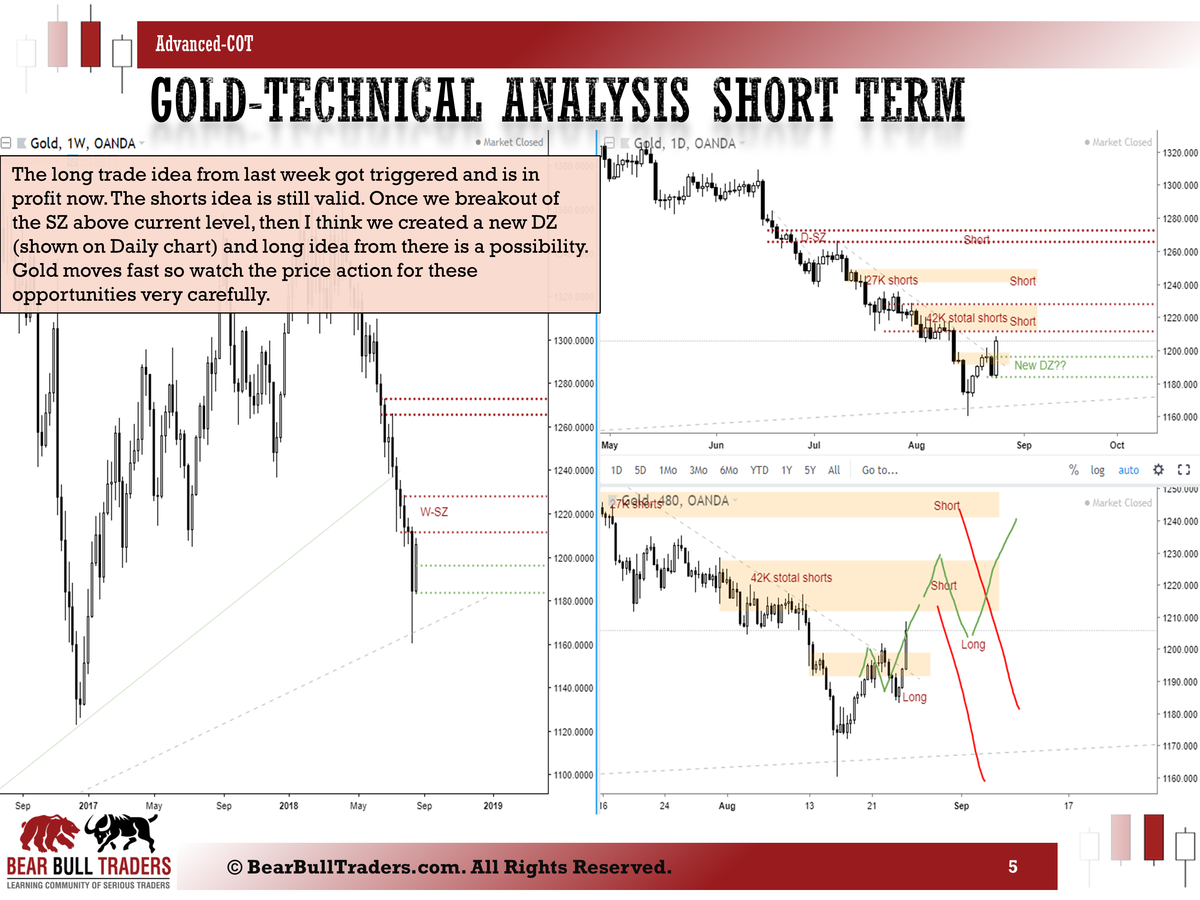
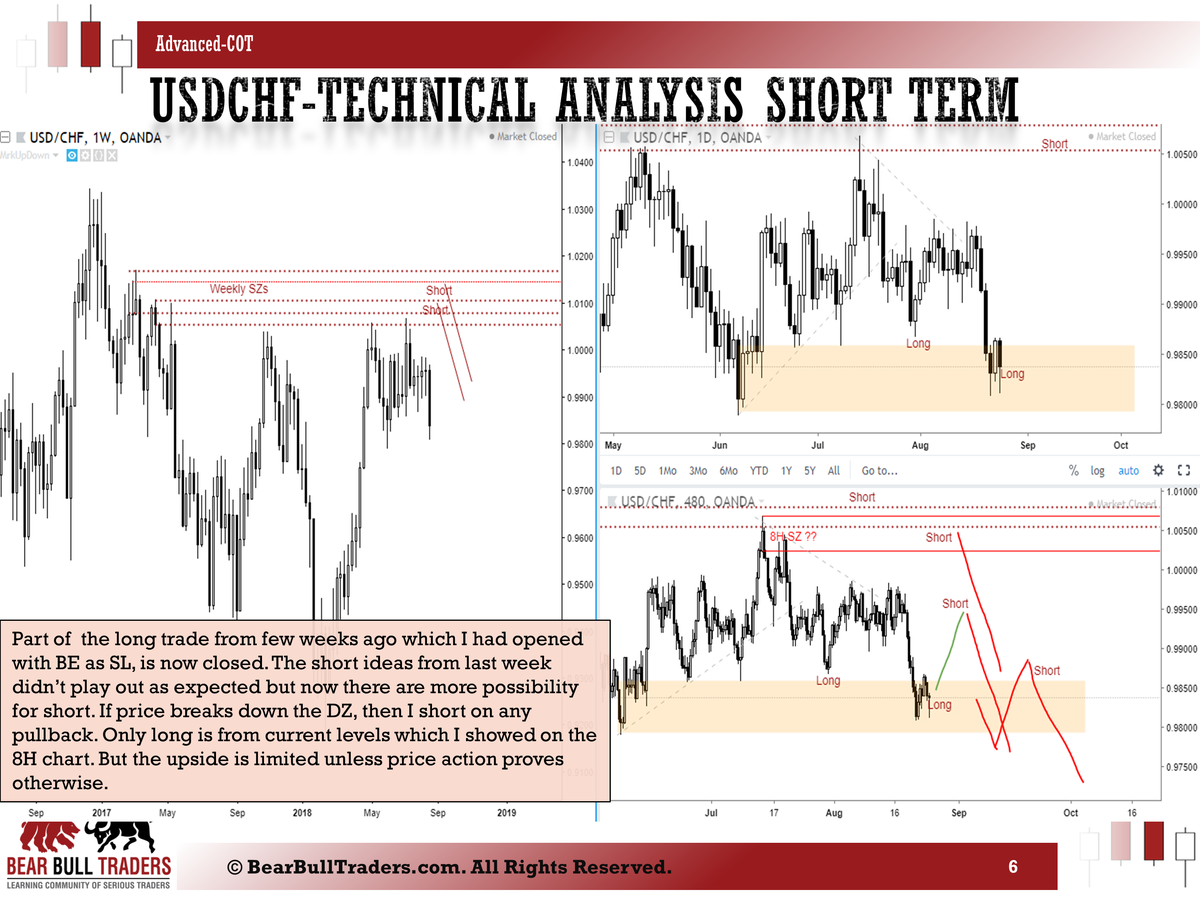
Here are some possible trades based on the COT reports of August 28th, 2018. The trades are based on some lower timeframes for short term profits. The big picture trades are setting up in the bigger timeframes and what I explained in the COT analysis posted here.

For more information on this type of analysis check out the previous posts in the education section of the forum here, here, and there.
If you want to discuss further and clarify things, please send me a message to [email protected]
Zack
-
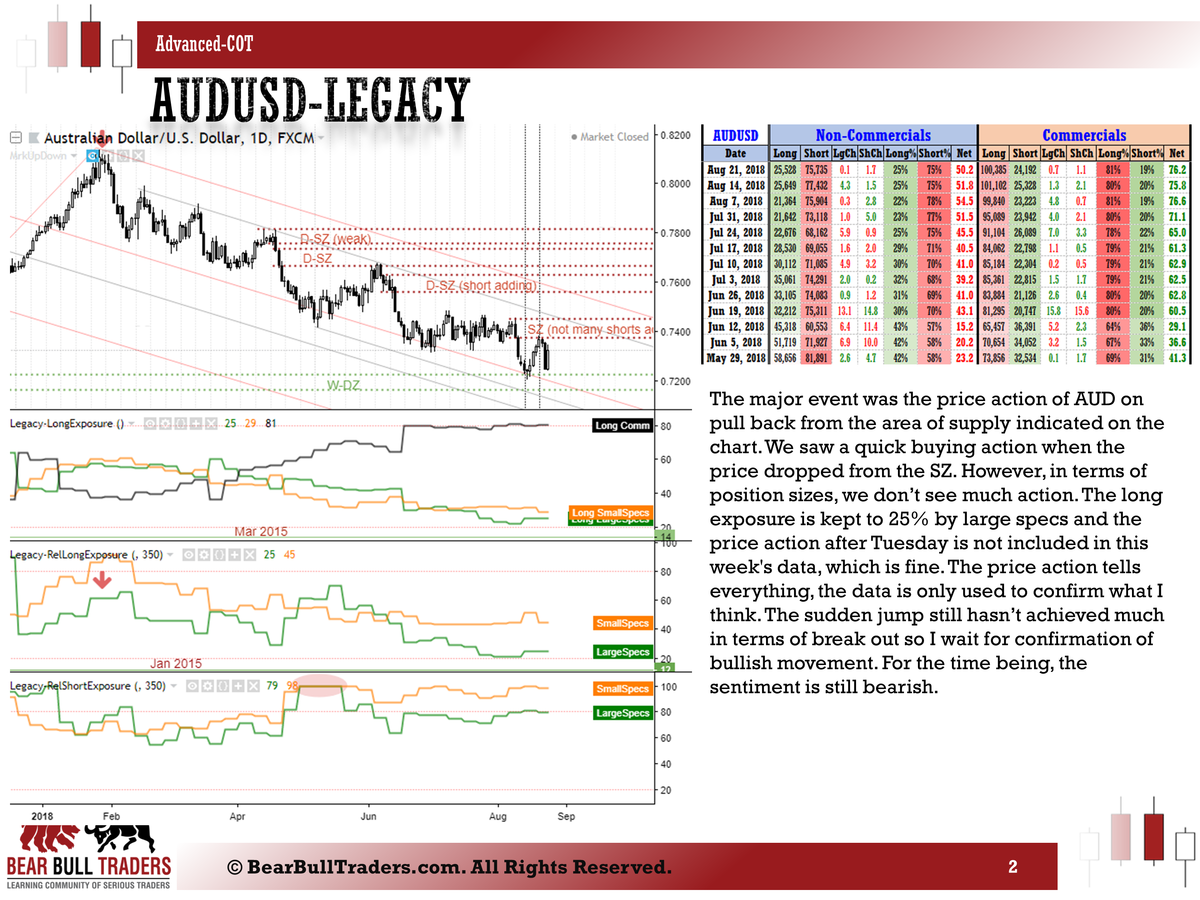
Here is a snapshot of the weekly analysis based on August 28th, 2018 COT (Legacy, Traders in Financial Futures) reports.
More trade updates will come in the following post.
For more information on this type of analysis check out the previous posts in the education section of the forum here, here, and there.
If you want to discuss further and clarify things, please send me a message to [email protected]
Zack
-
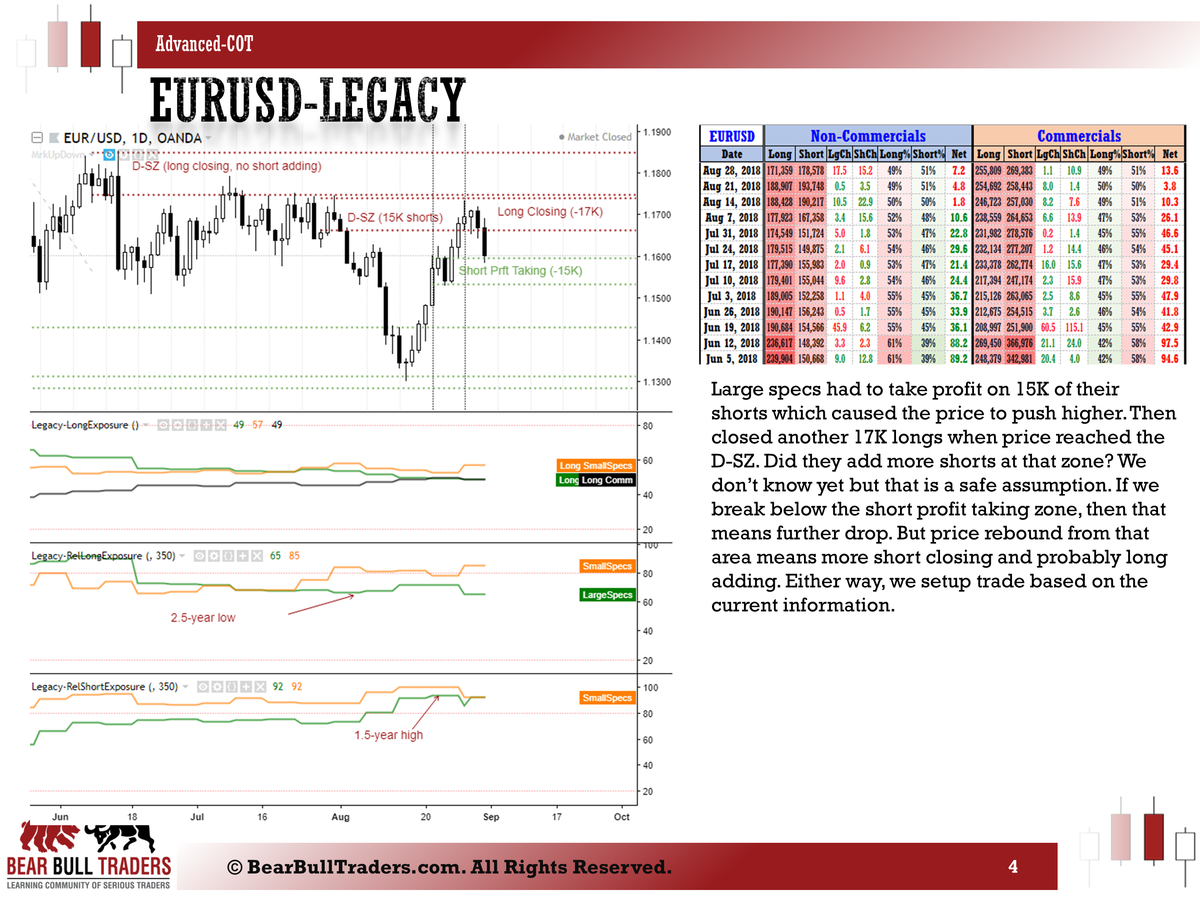
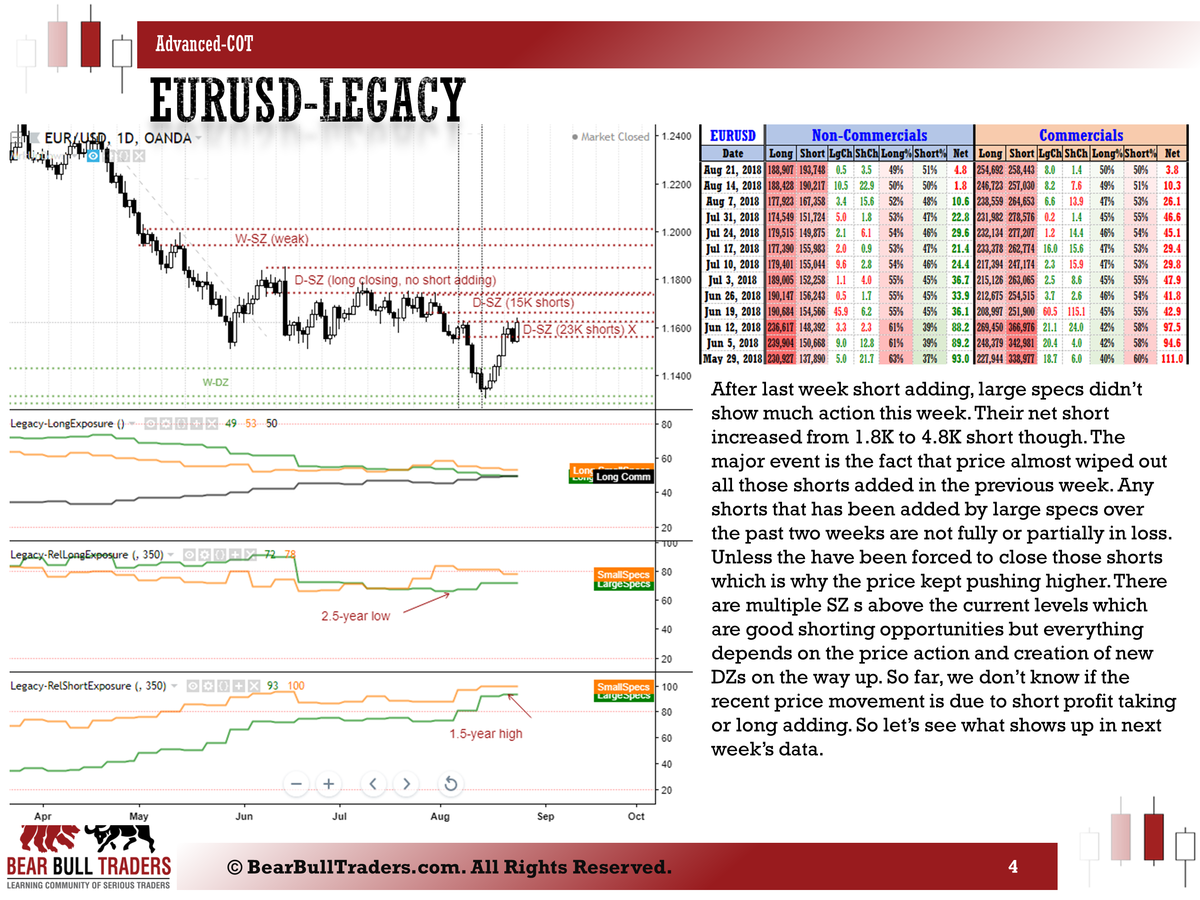
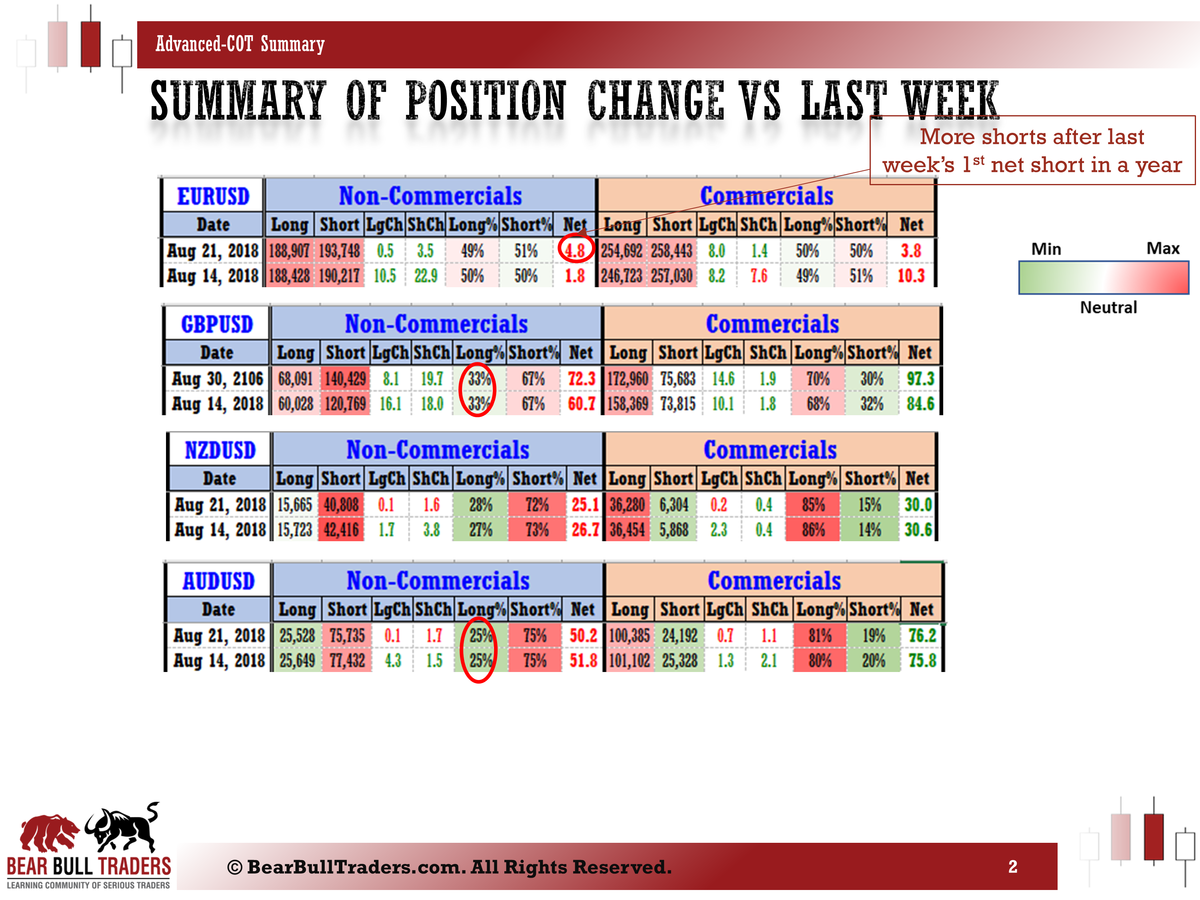
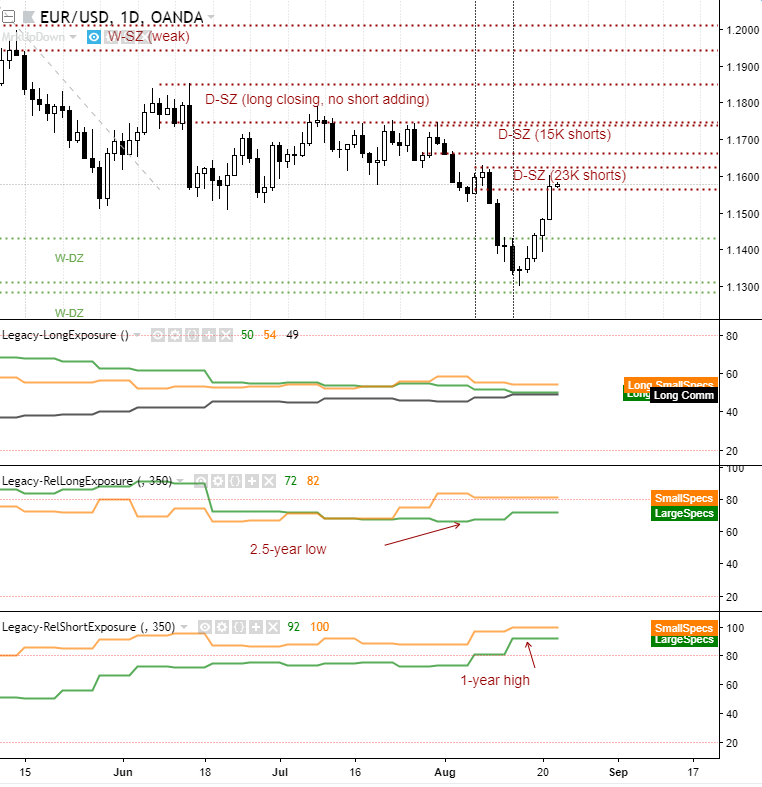
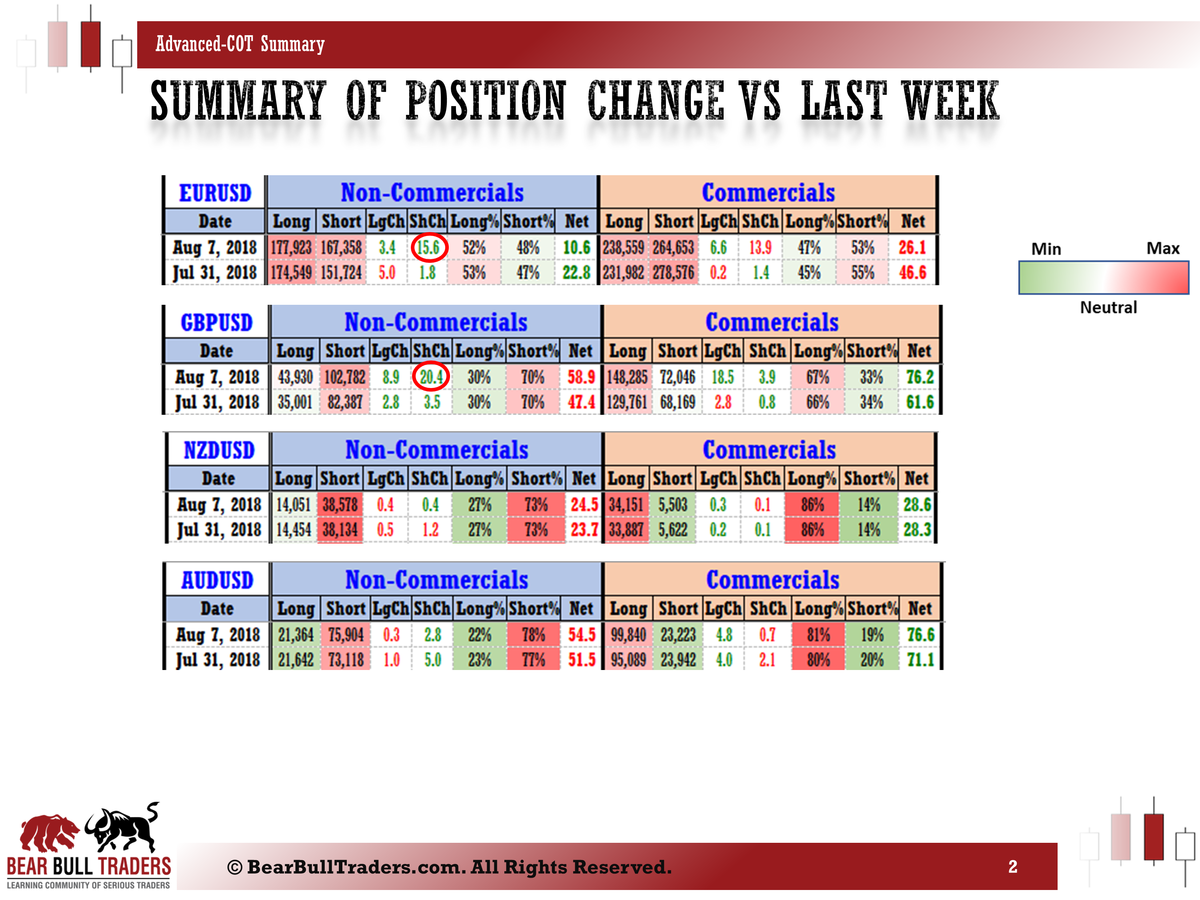
EUR Large Specs shorts and longs decreased significantly but kept the long exposure to 49%.
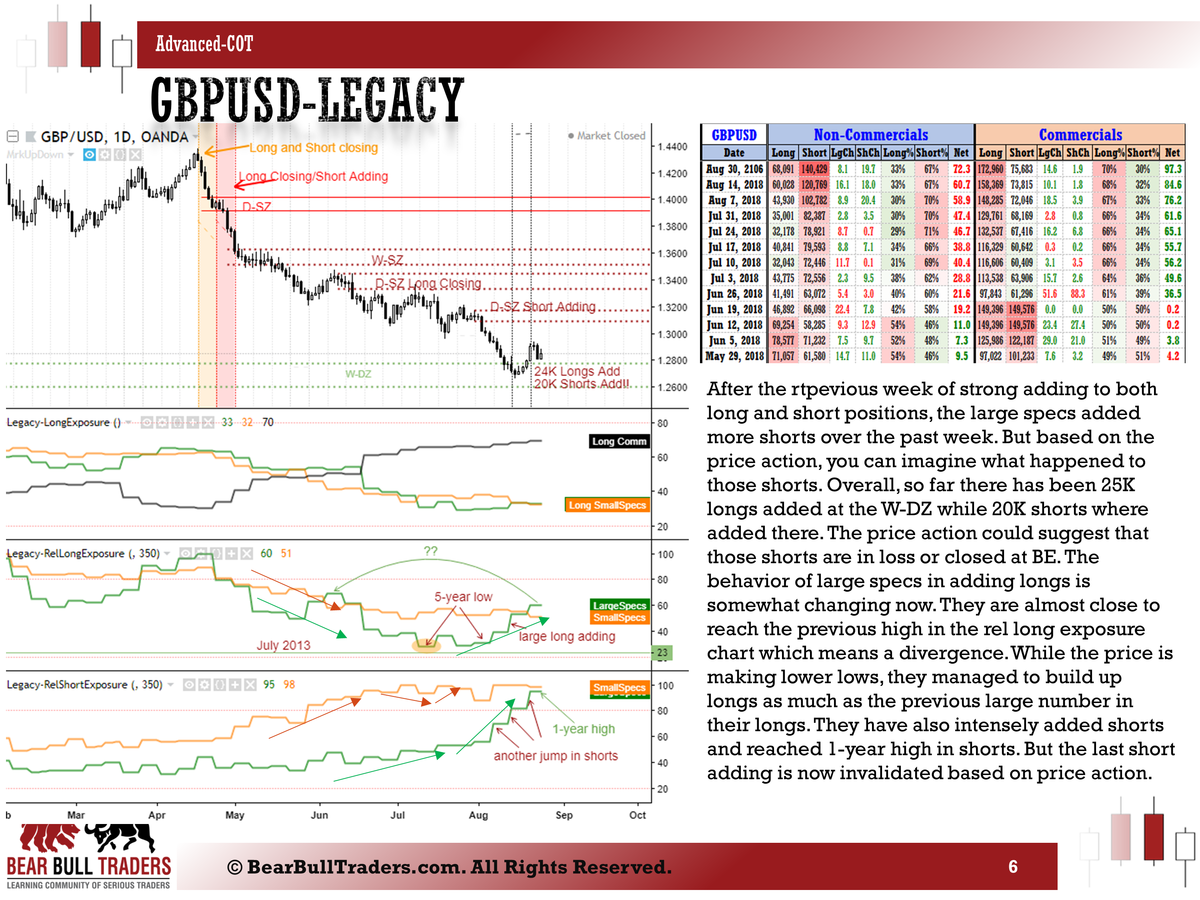
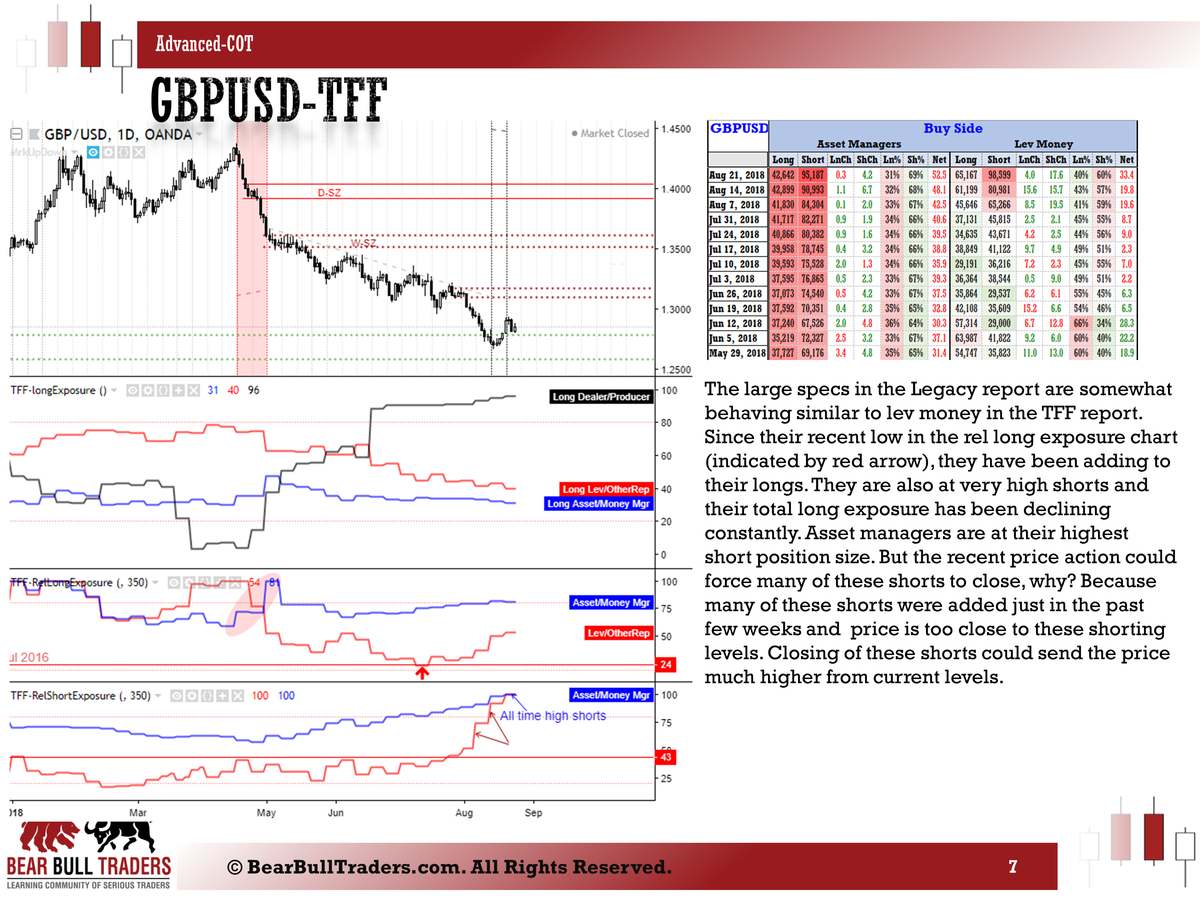
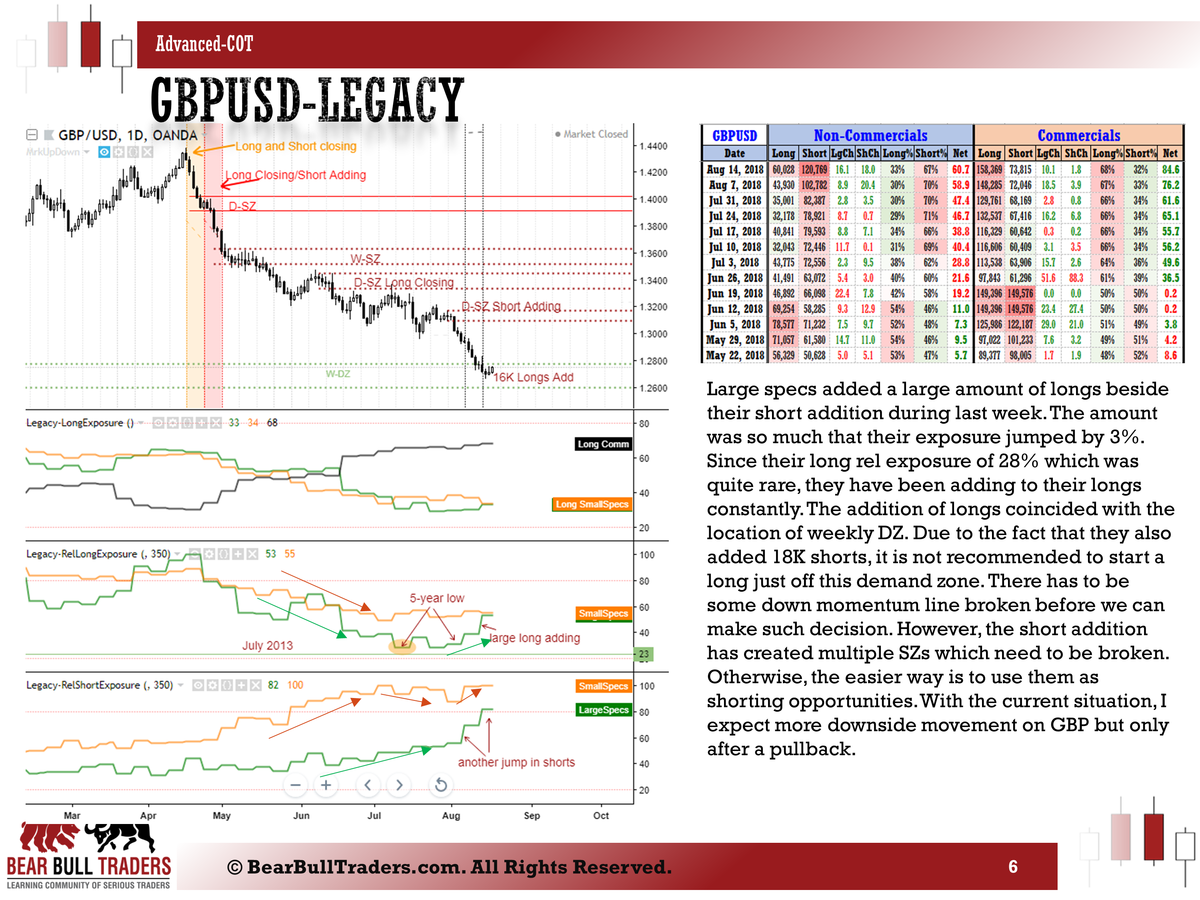
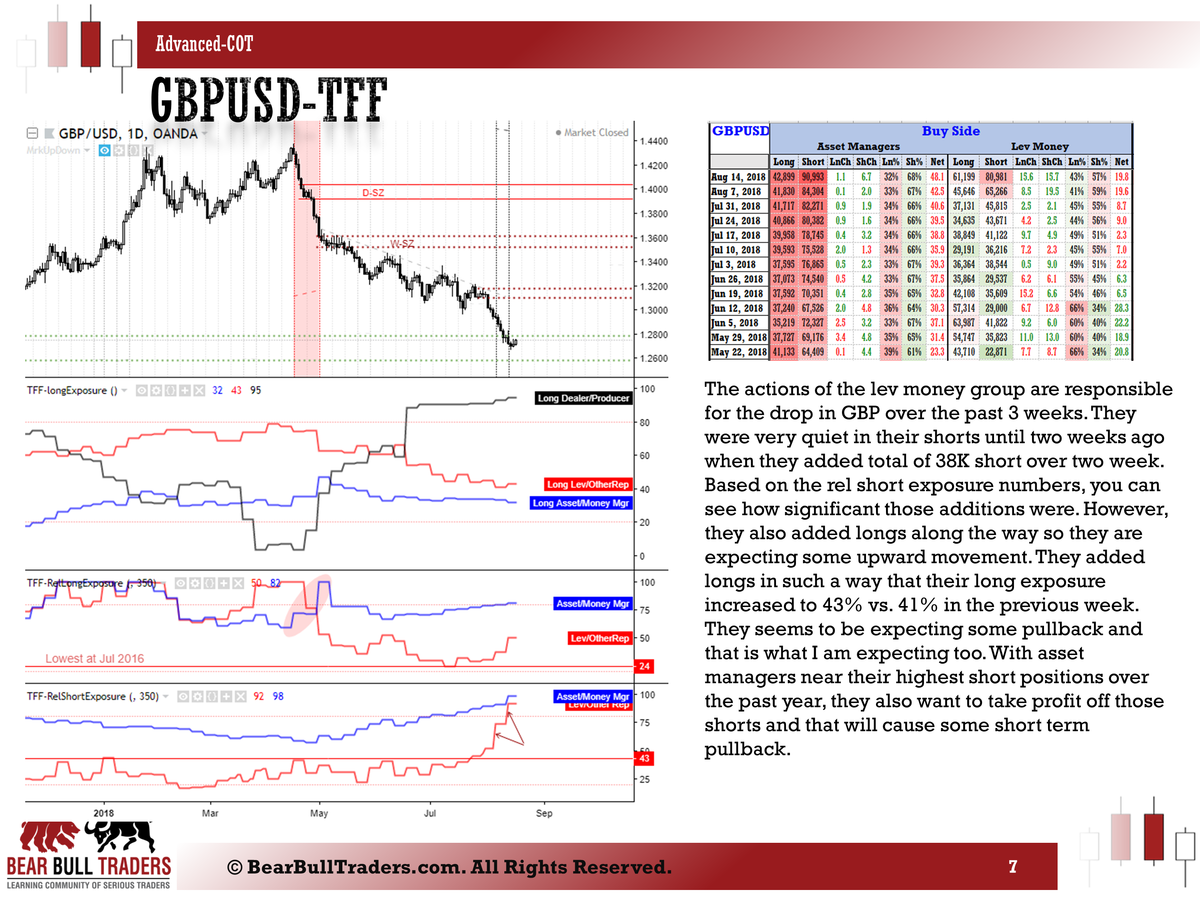
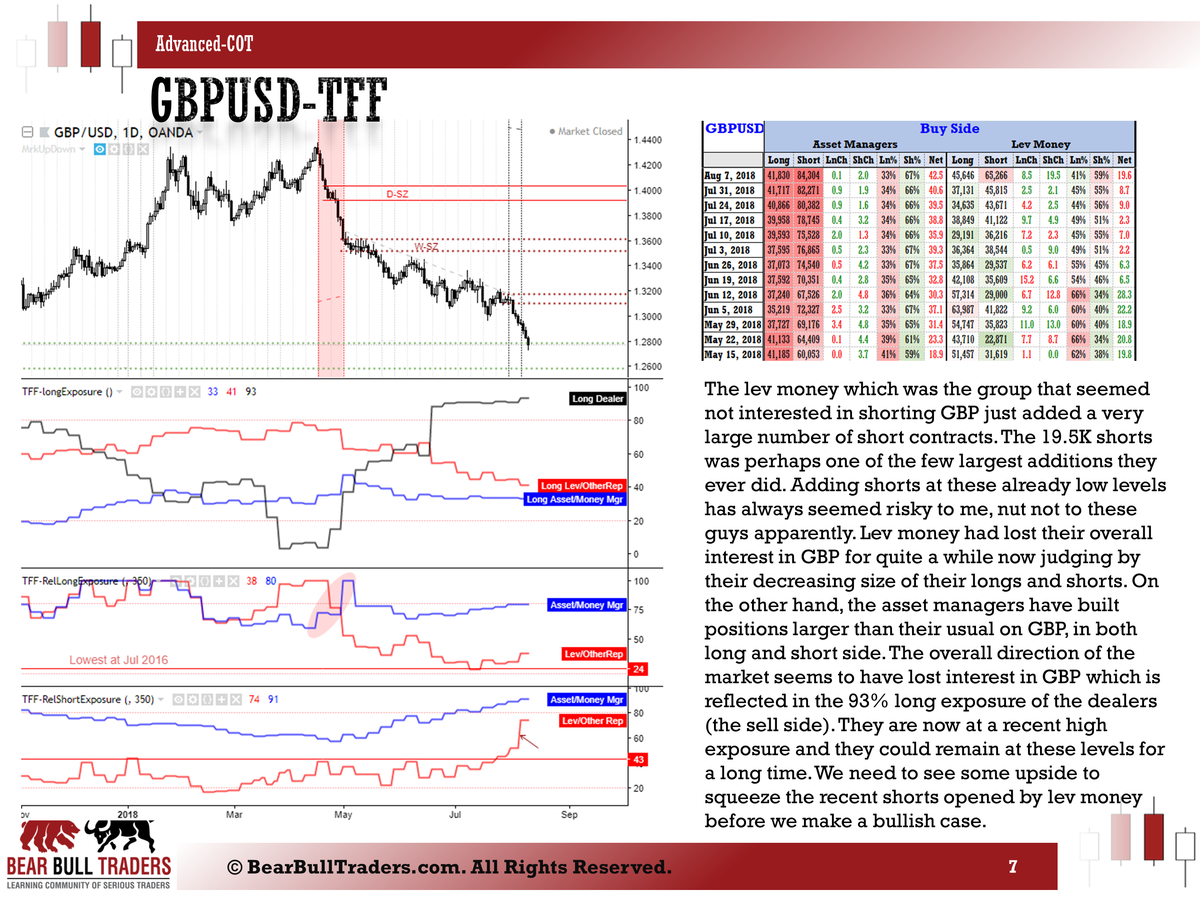
GBP short added so the long exposure dropped again back to 30%.
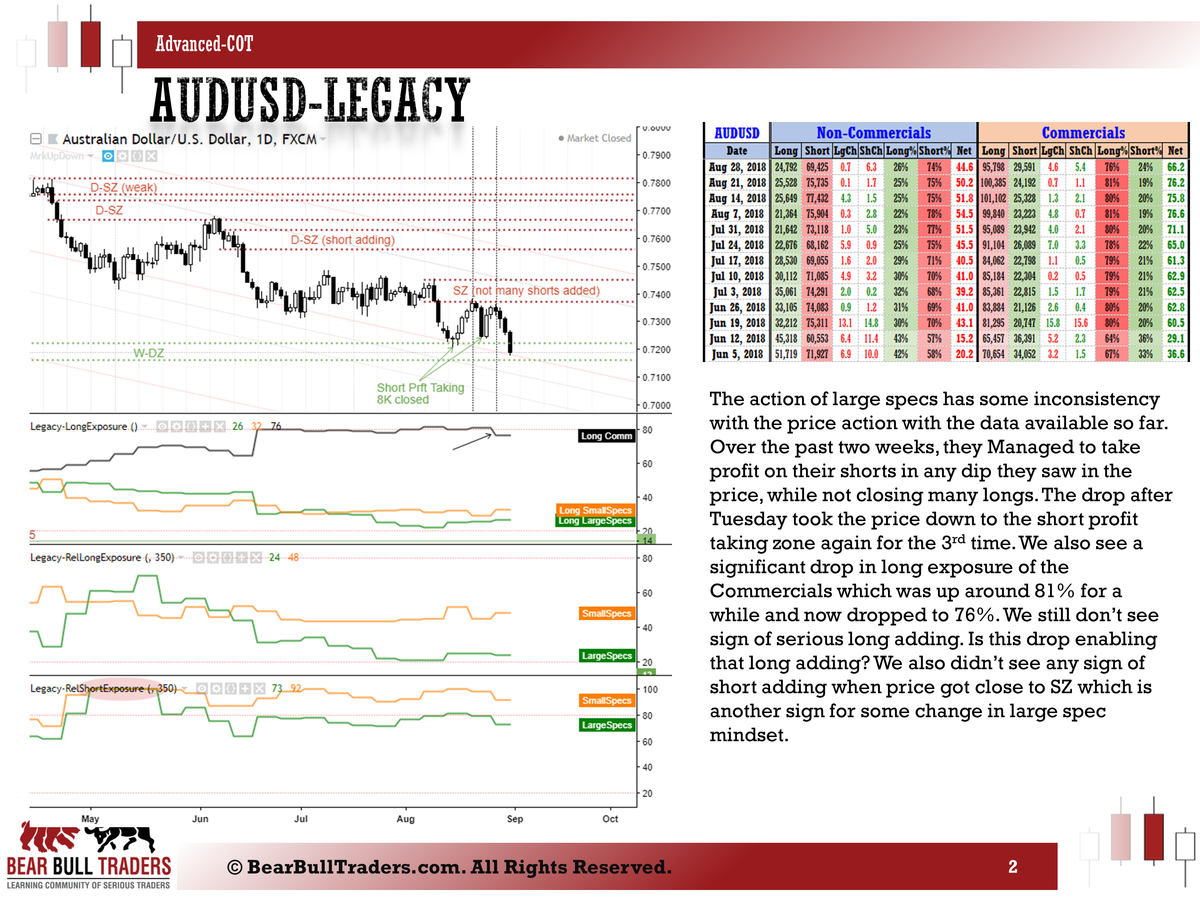
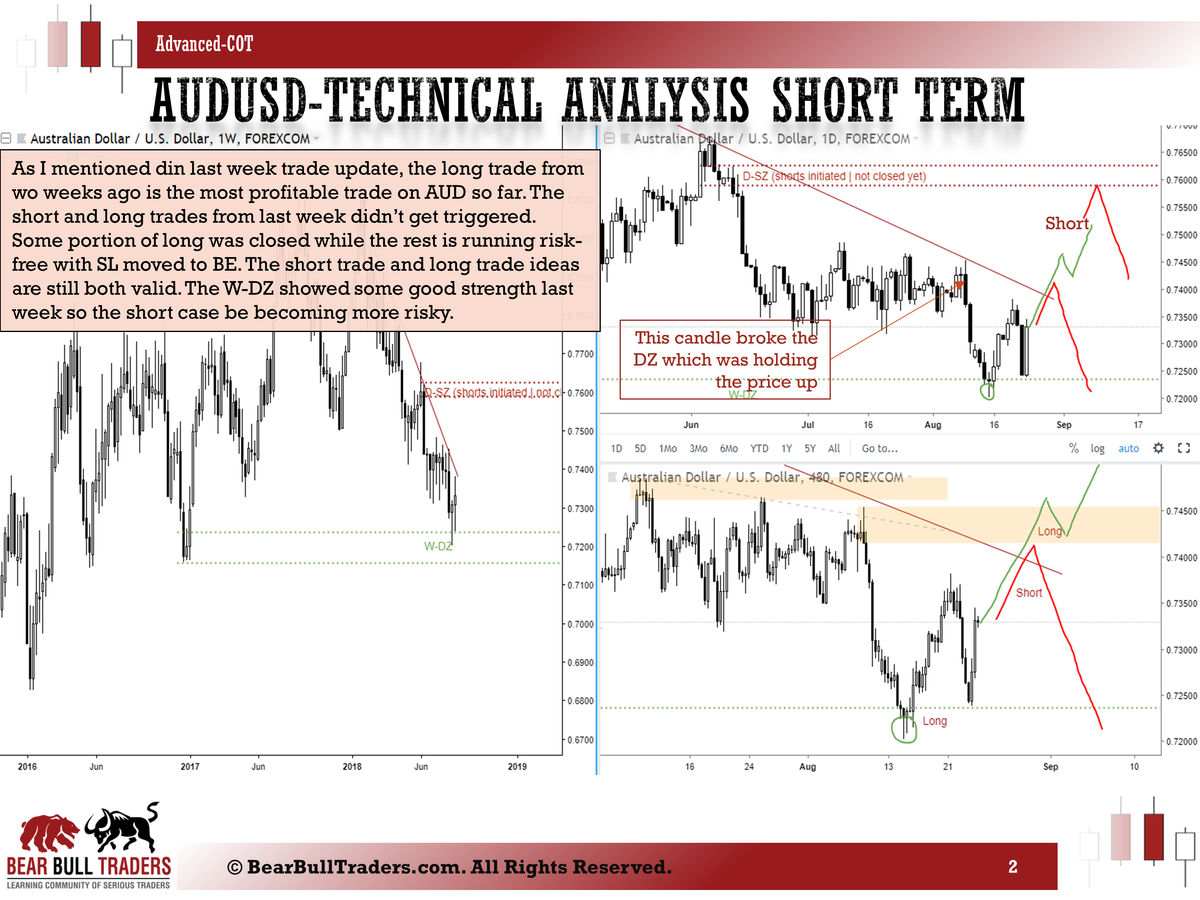
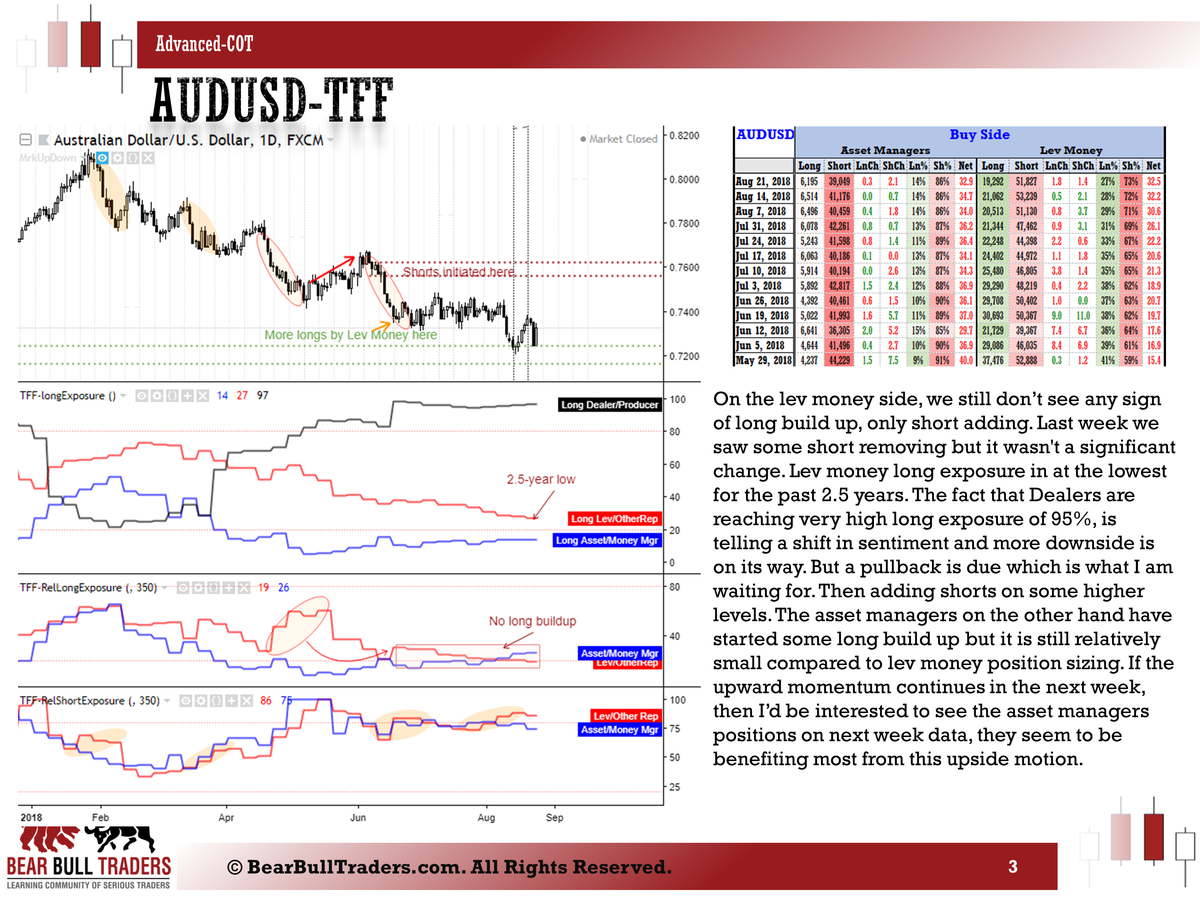
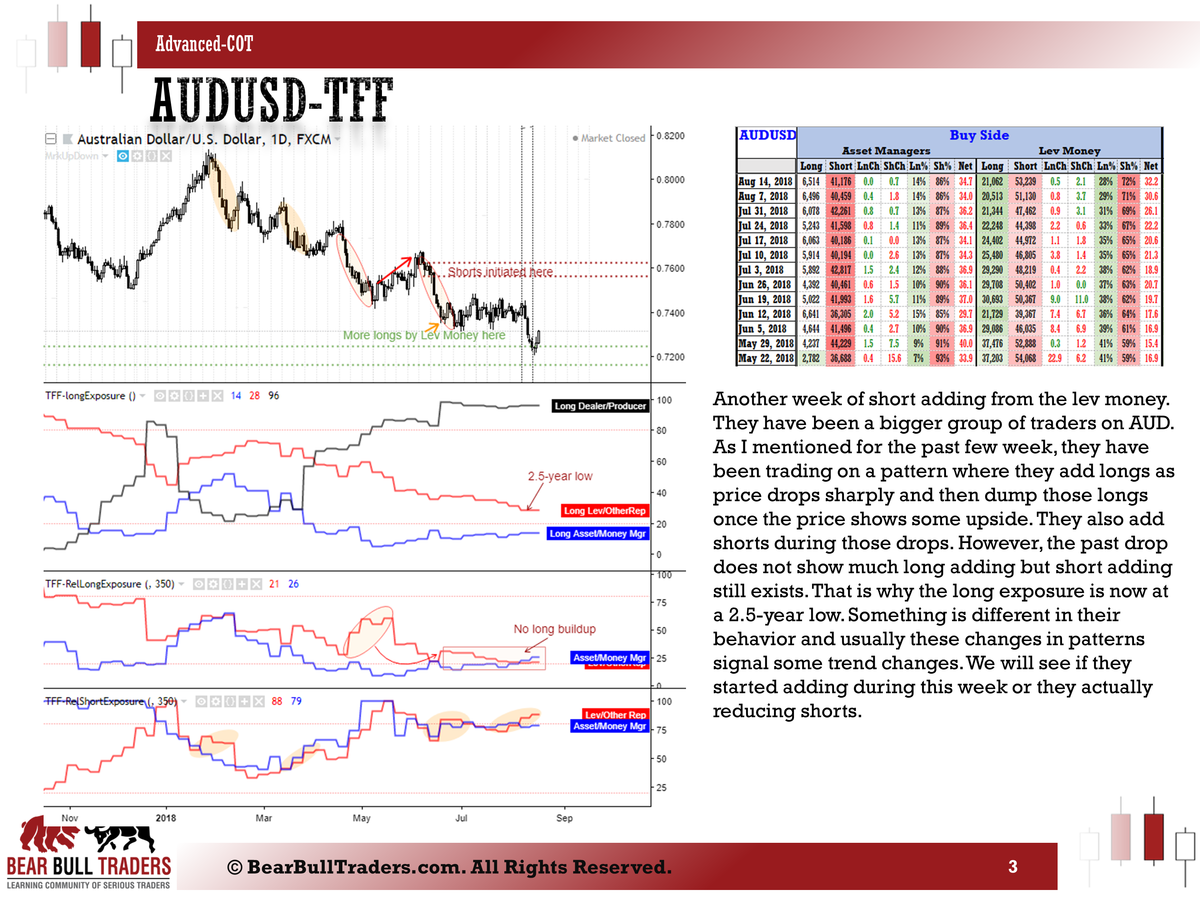
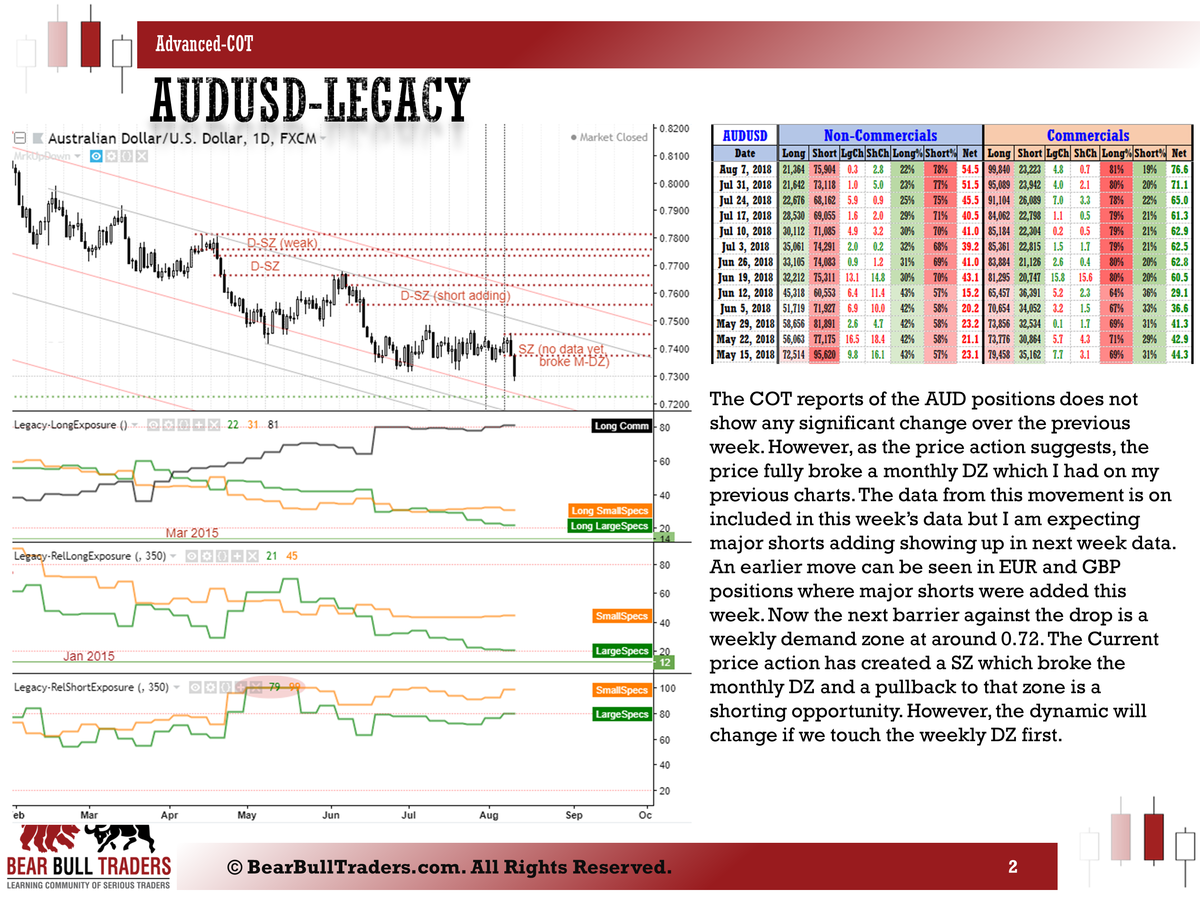
AUD and NZD both seeing second week of long exposure increase.
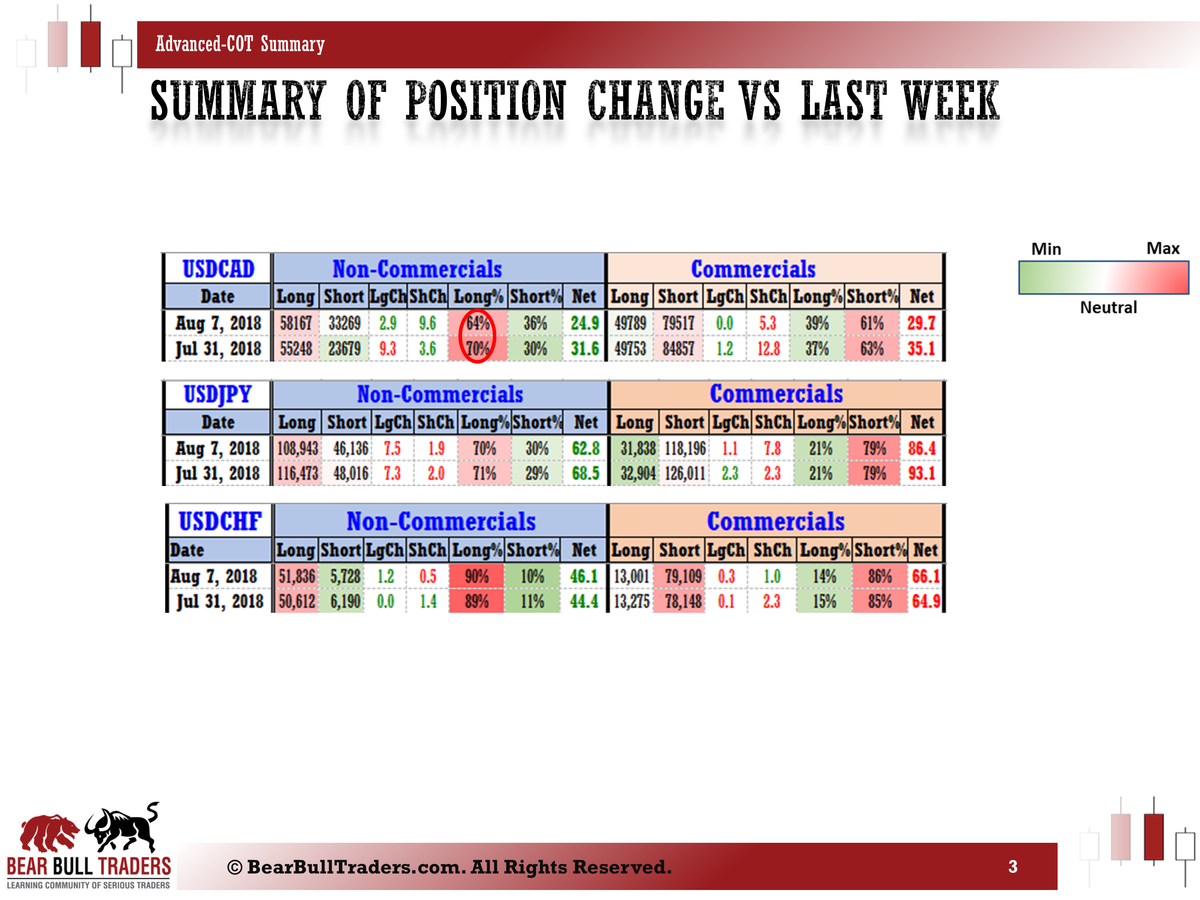
USDCAD longs saw another drop to 63% after 65% last week.
USDJPY saw a small incrase in long exposure after big shift from 69% to 65% long exposure last week.
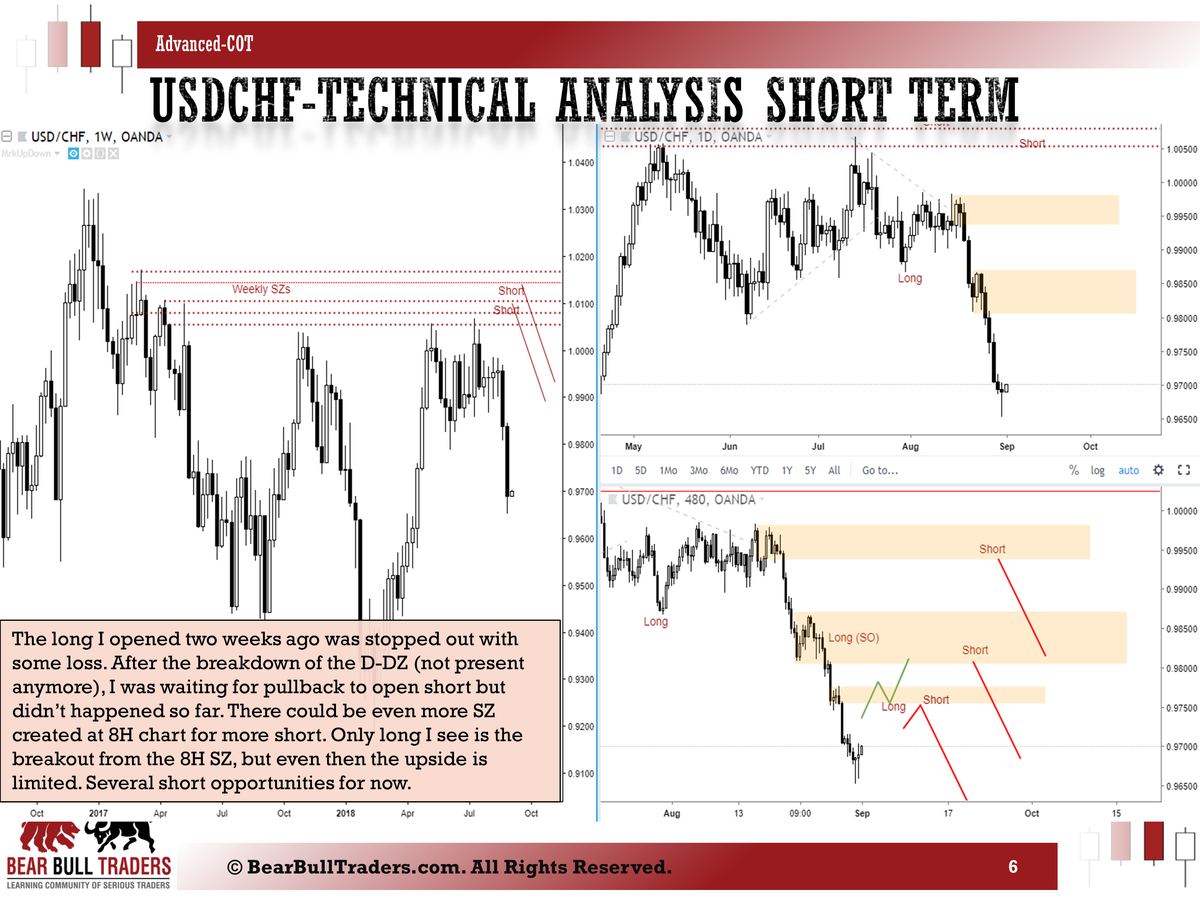
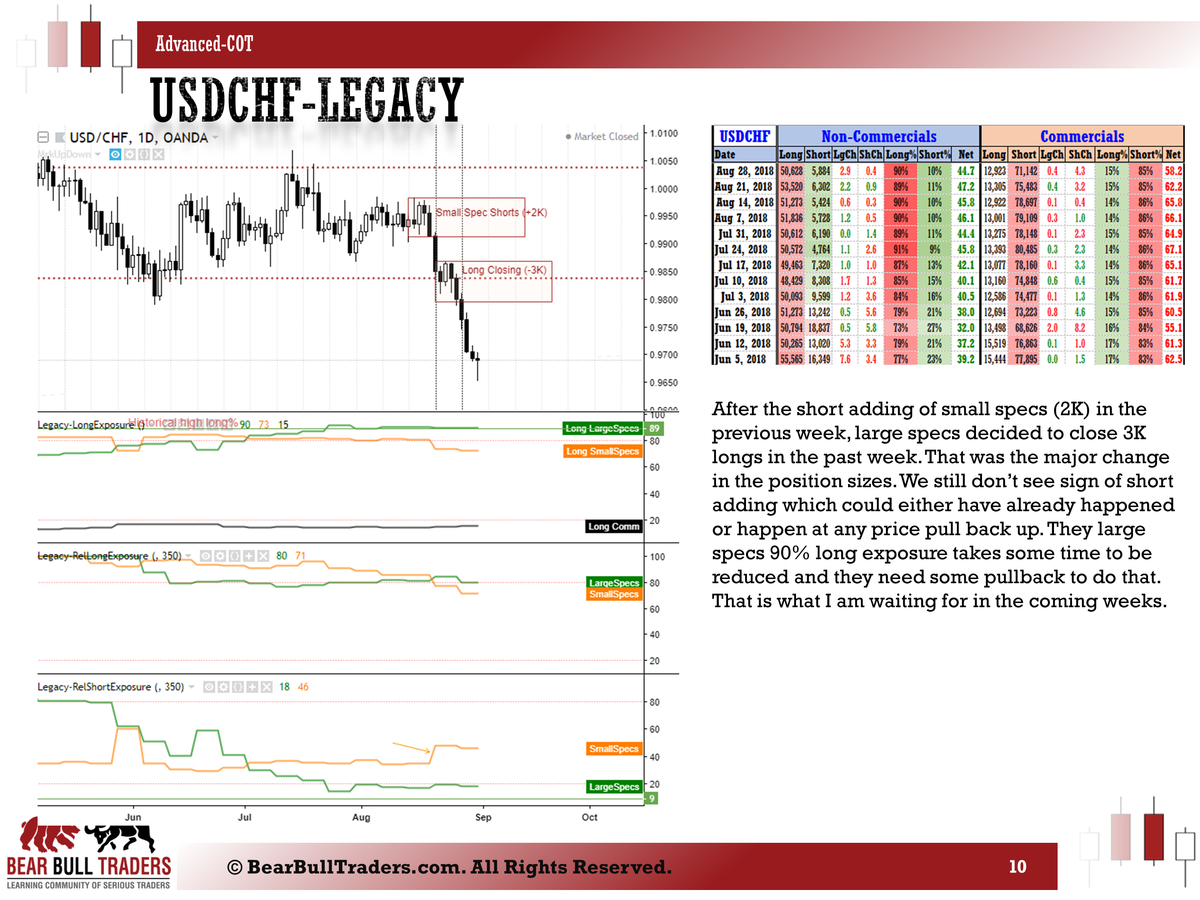
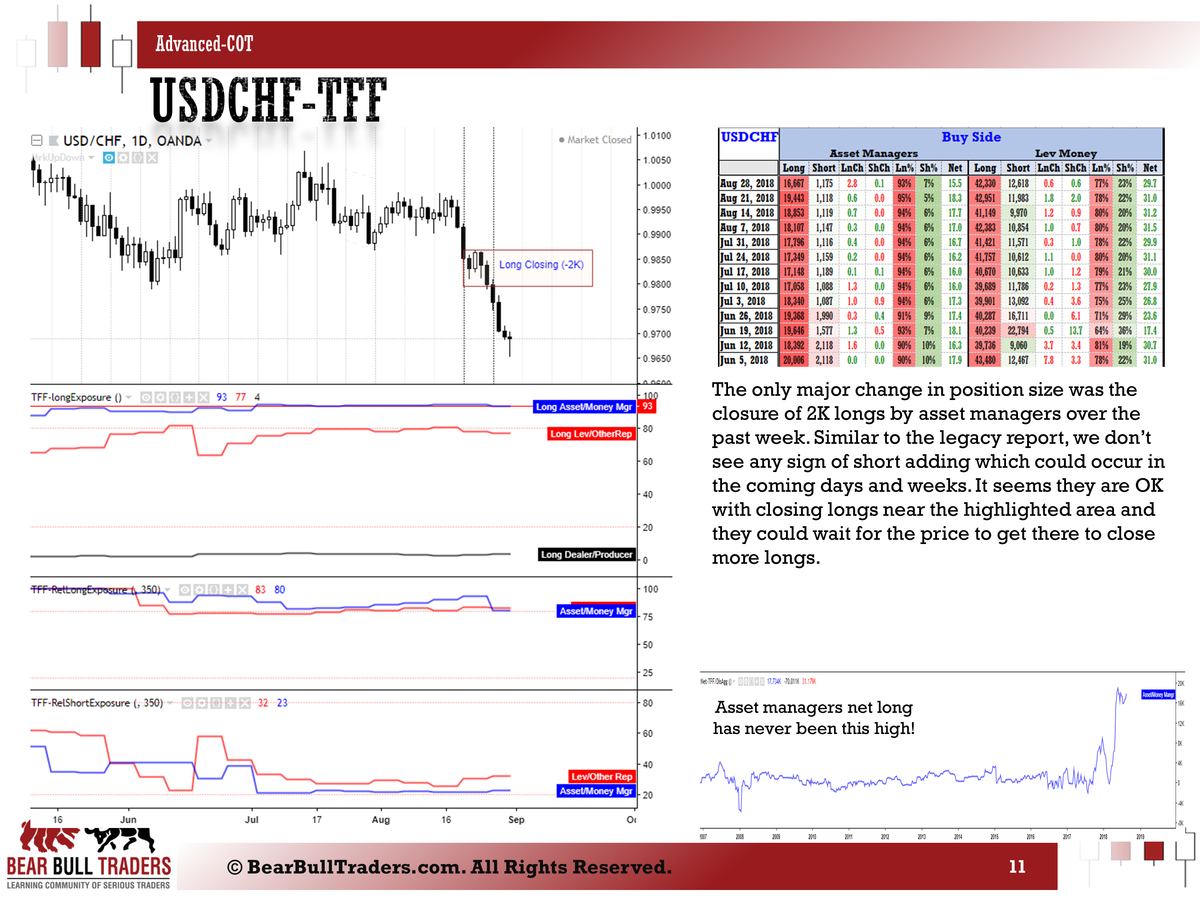
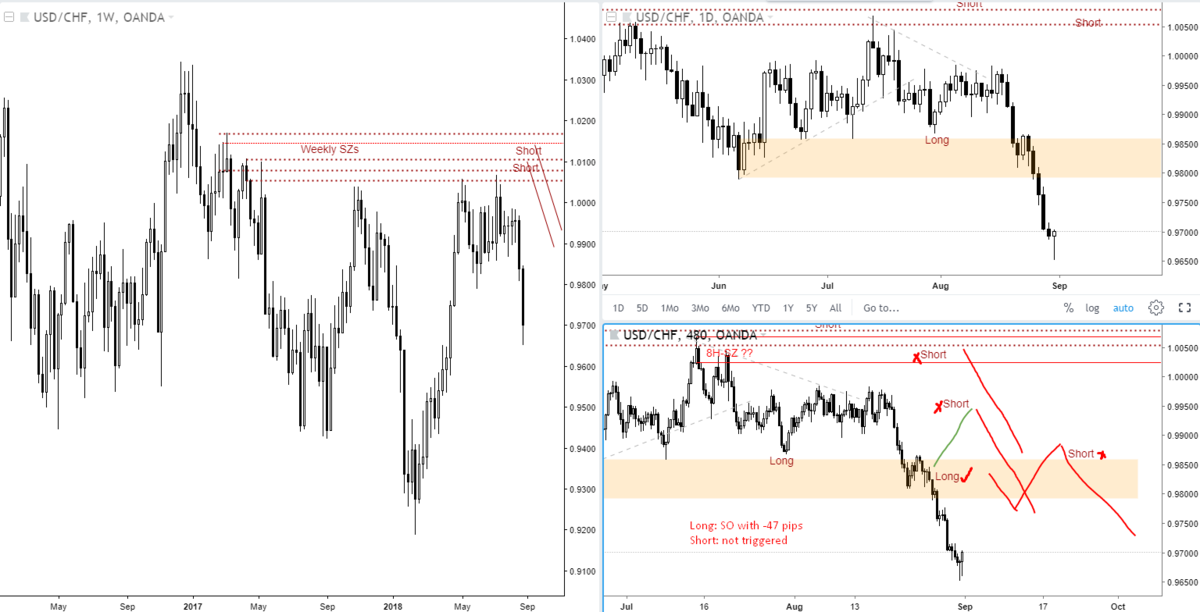
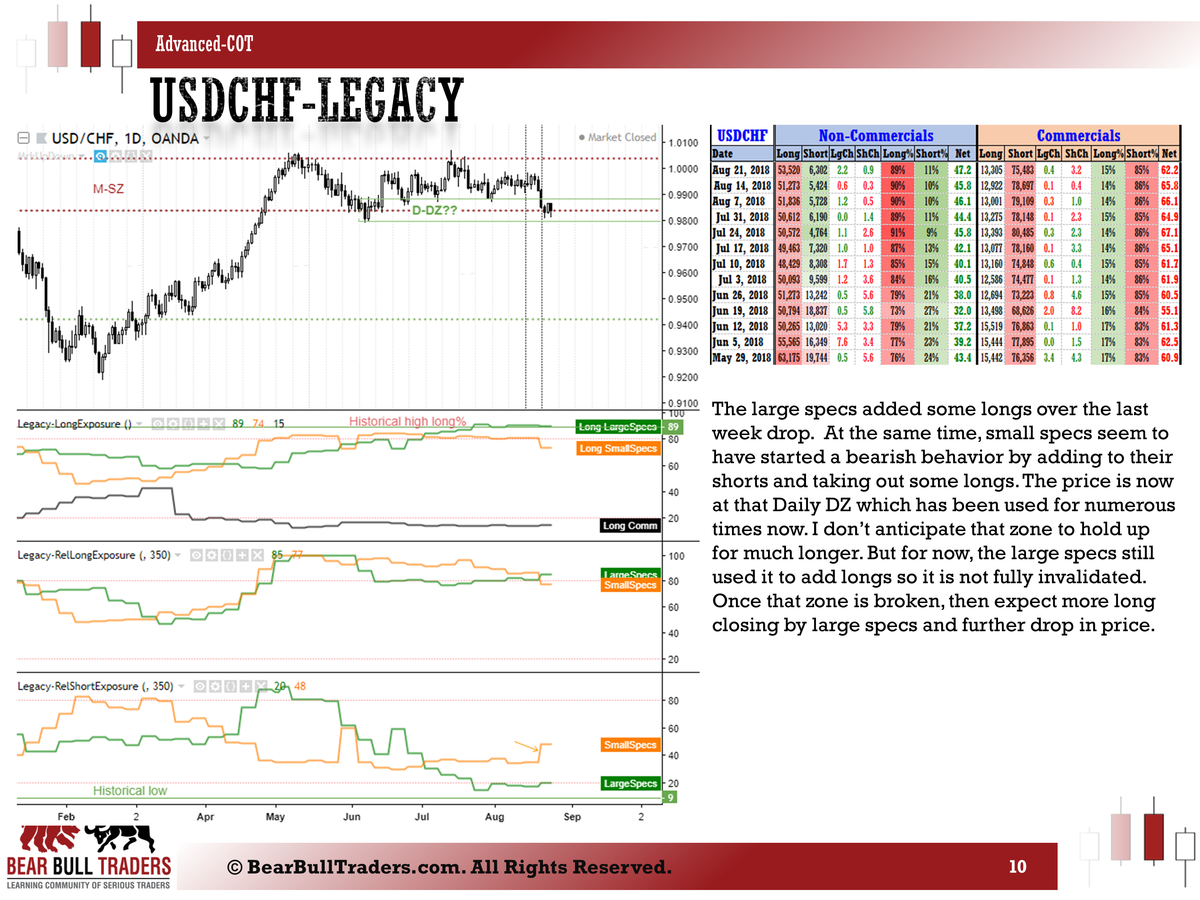
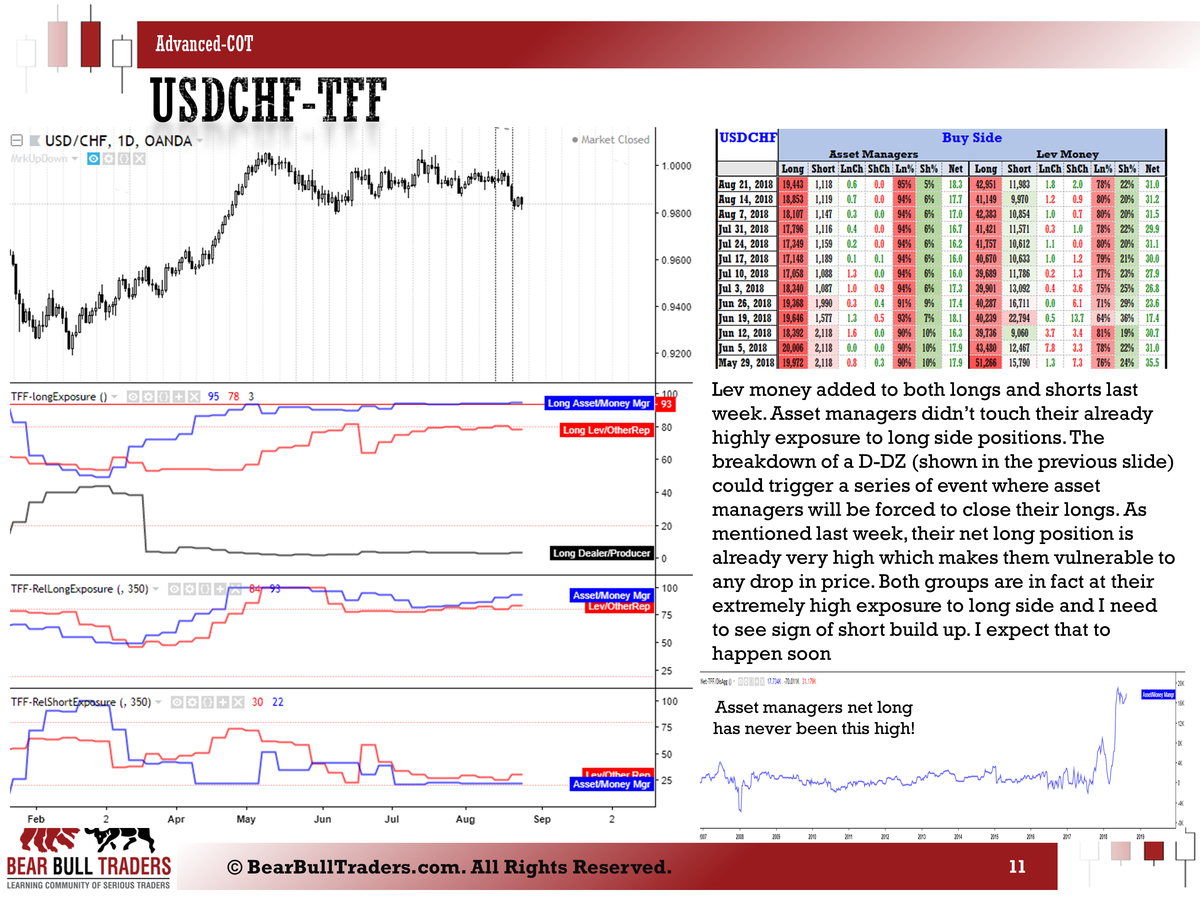
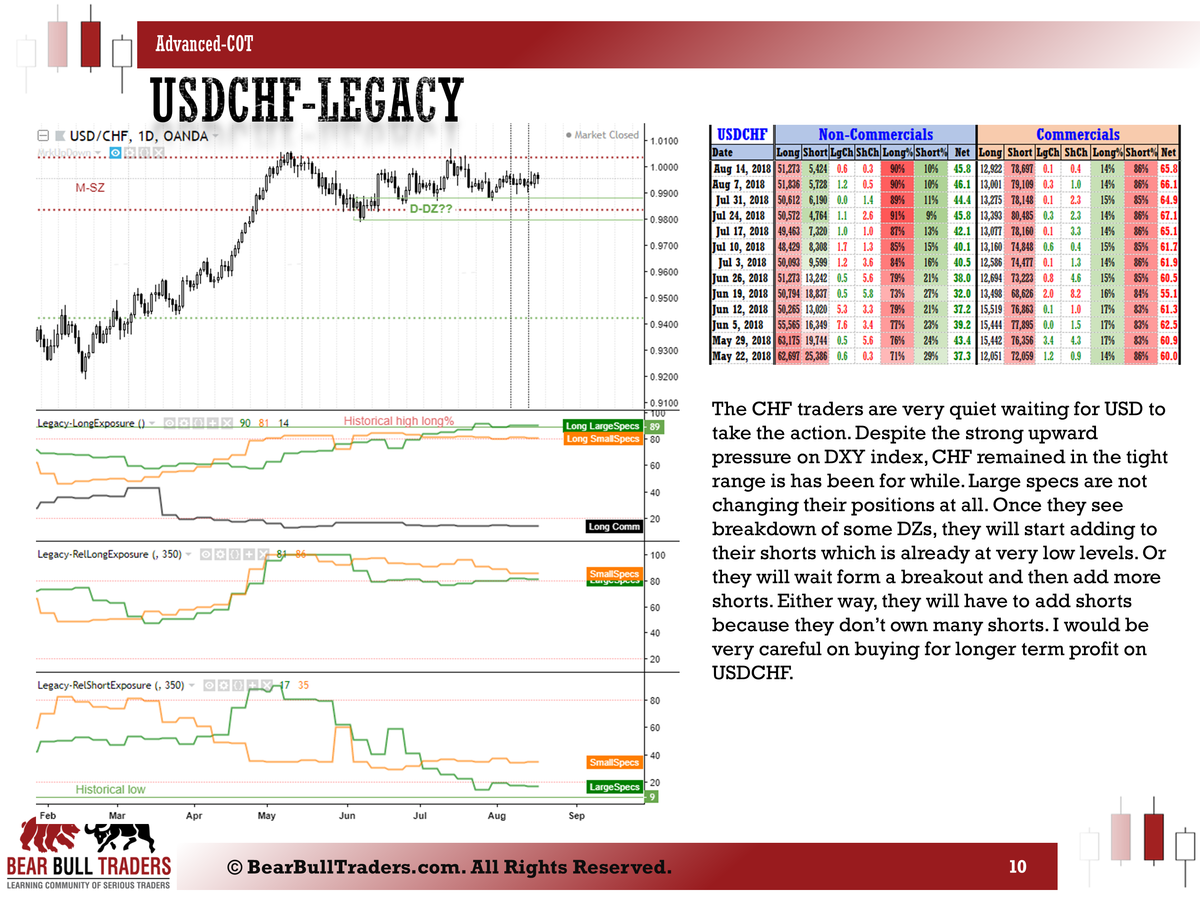
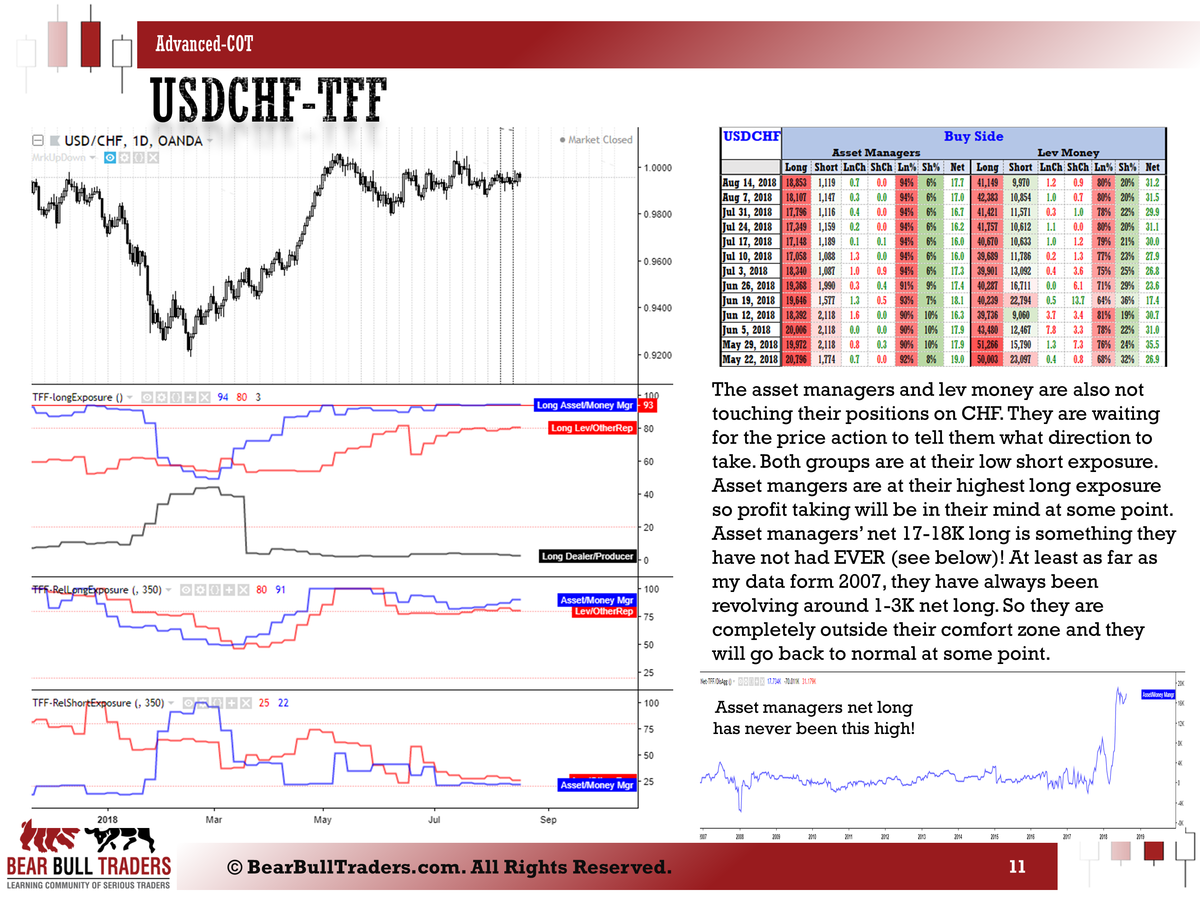
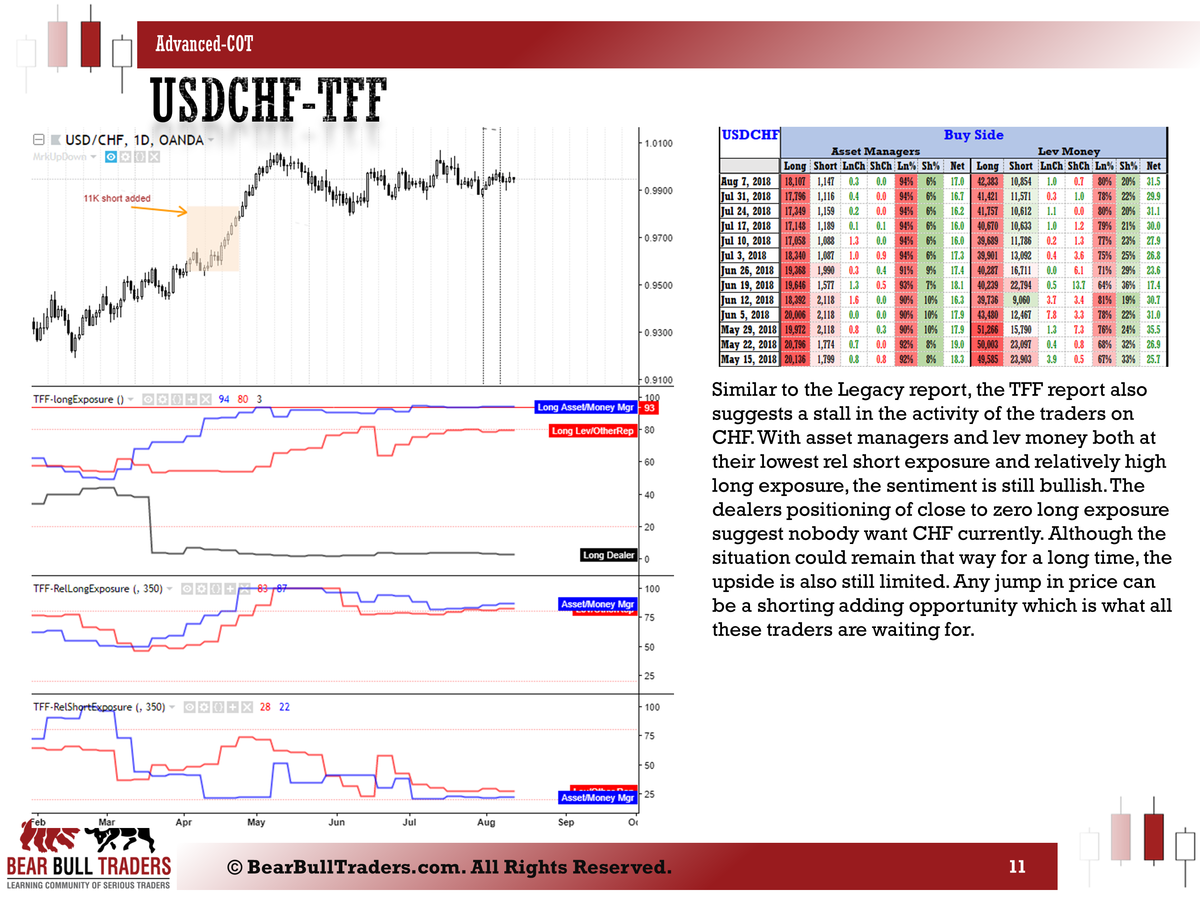
USDCHF does not show the results of the big drop that happened after Tuesday.
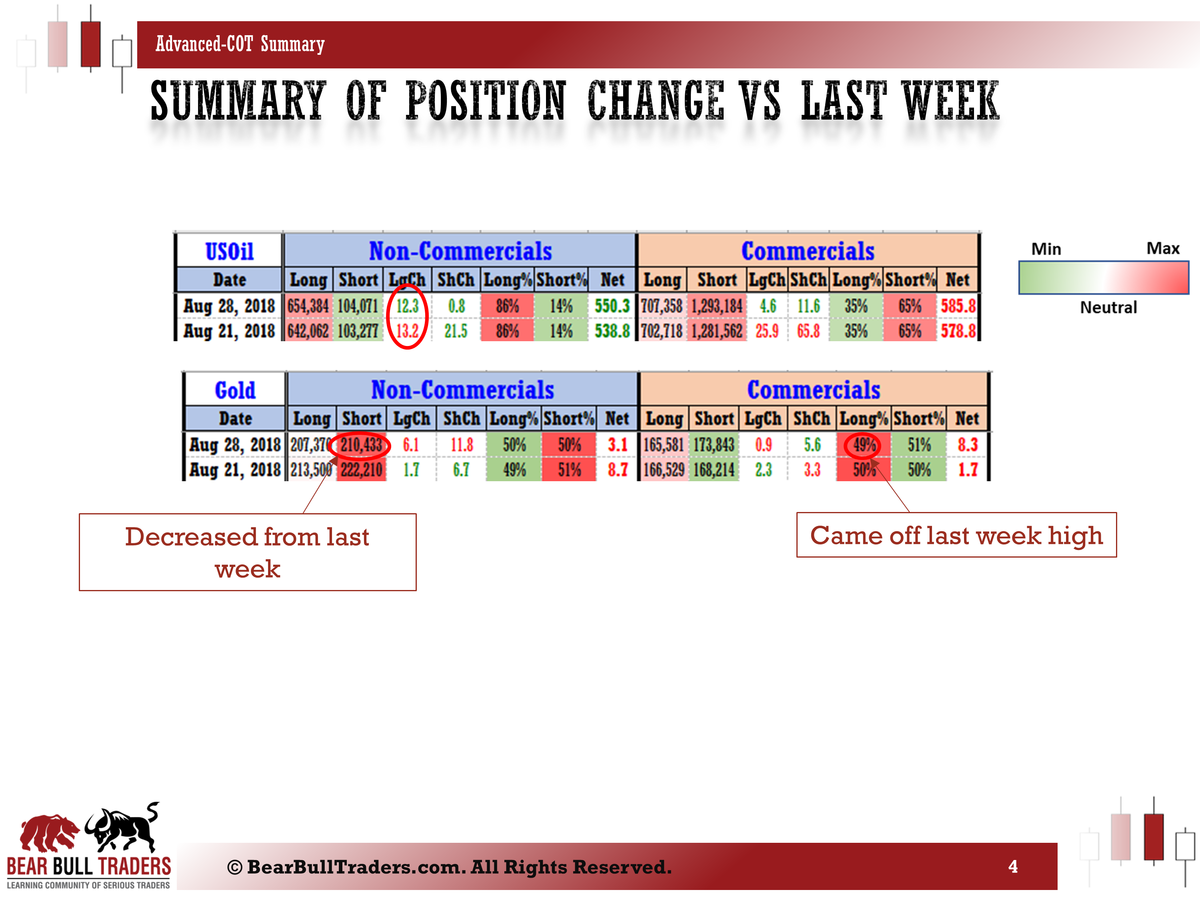
Oil shows a big jump in longs.
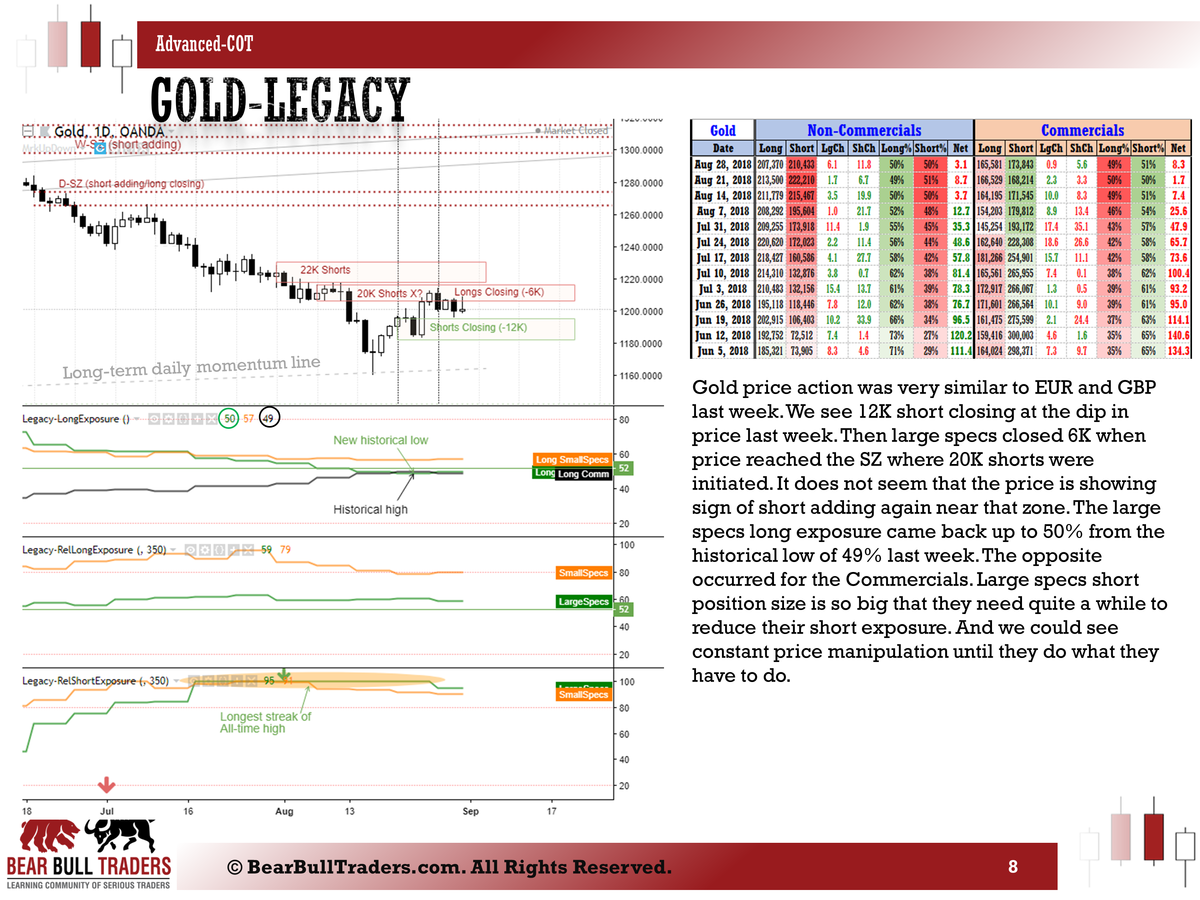
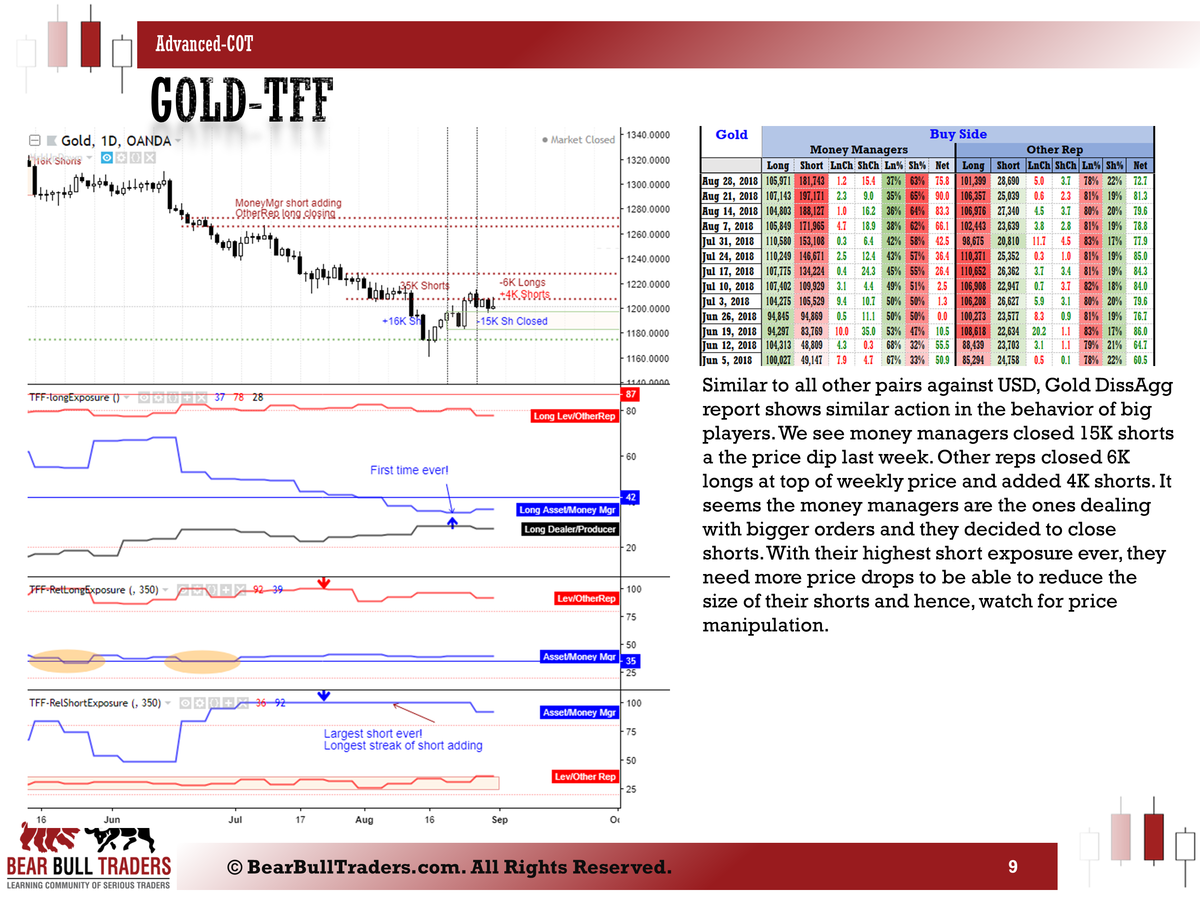
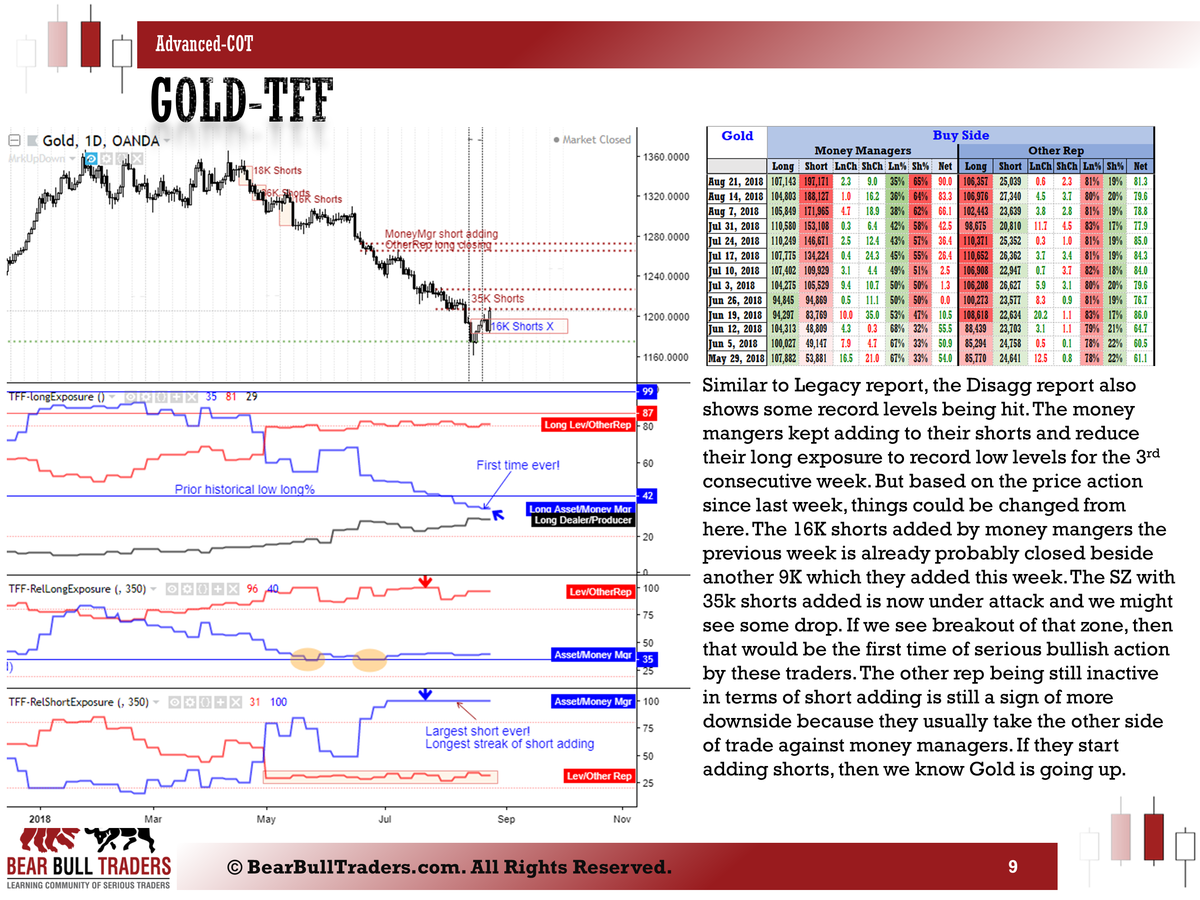
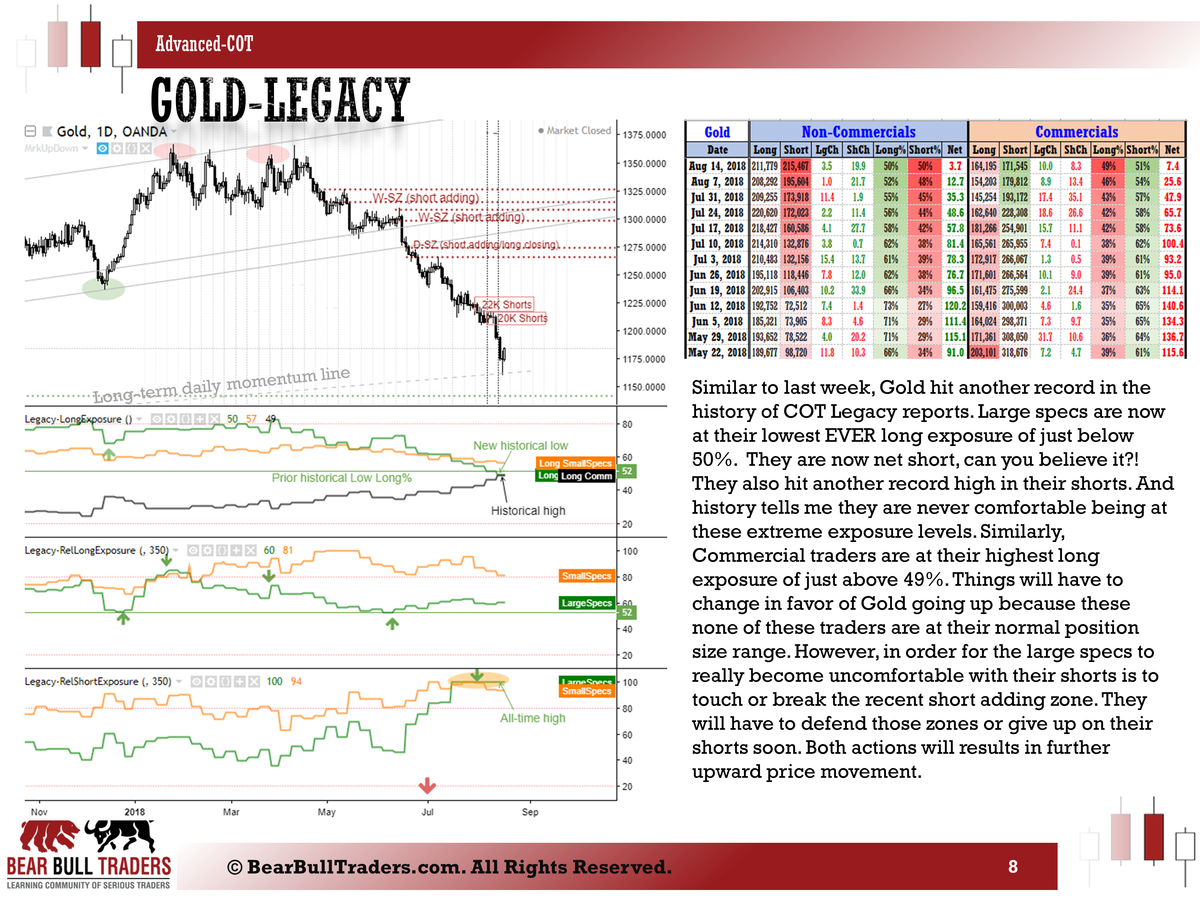
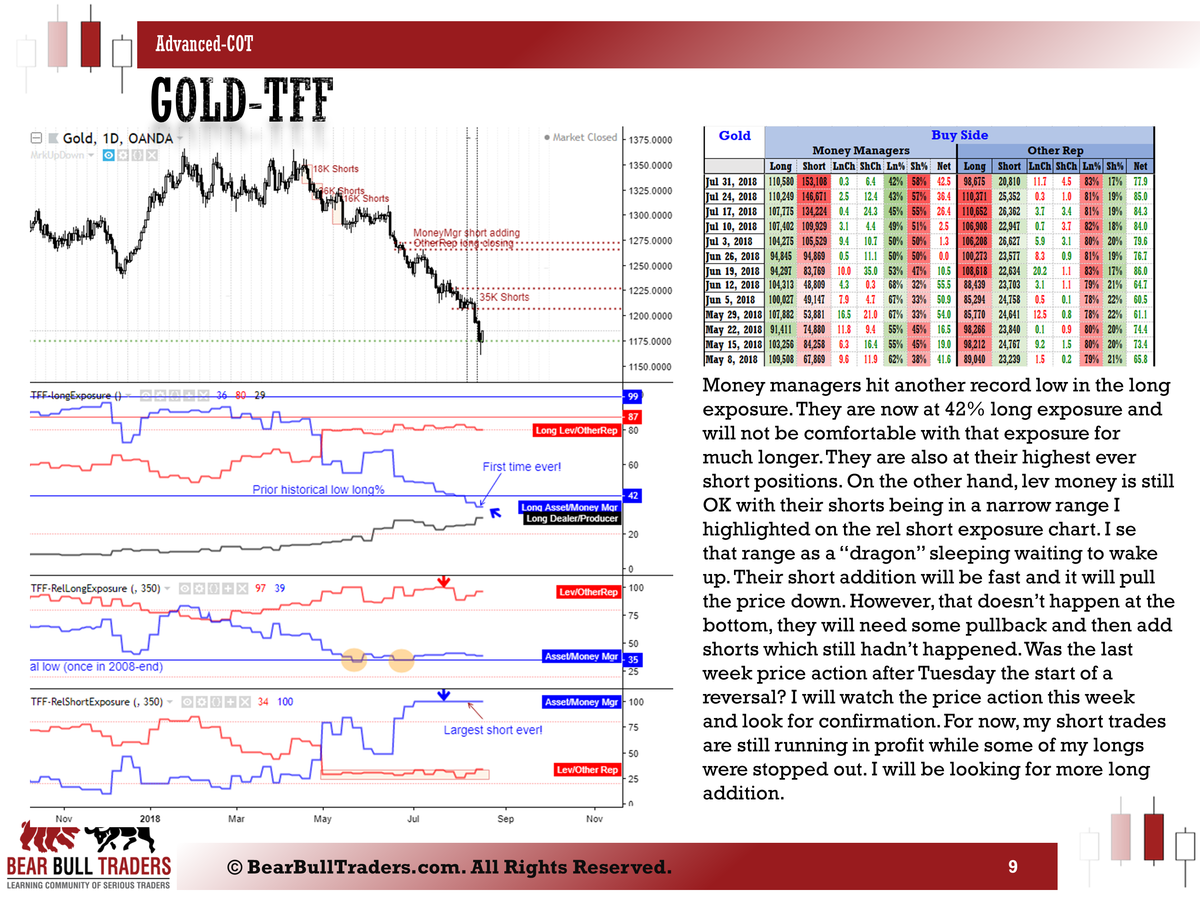
Gold shows some sign of short profit taking after record high levels seen last week.
For more information on this type of analysis check out the previous posts in the education section of the forum here, here, and there.
Create a FREE account to get access to all previous weekly analysis and educational materials using the registration form found in this page.
If you want to discuss further and clarify things, please send me a message to [email protected]
Zack
-
Update on the trade ideas based on the analysis of COT reports last week which were posted here and the trade ideas posted here
COT data will be released shorty at 12:30 EST so stay tuned for more updates.
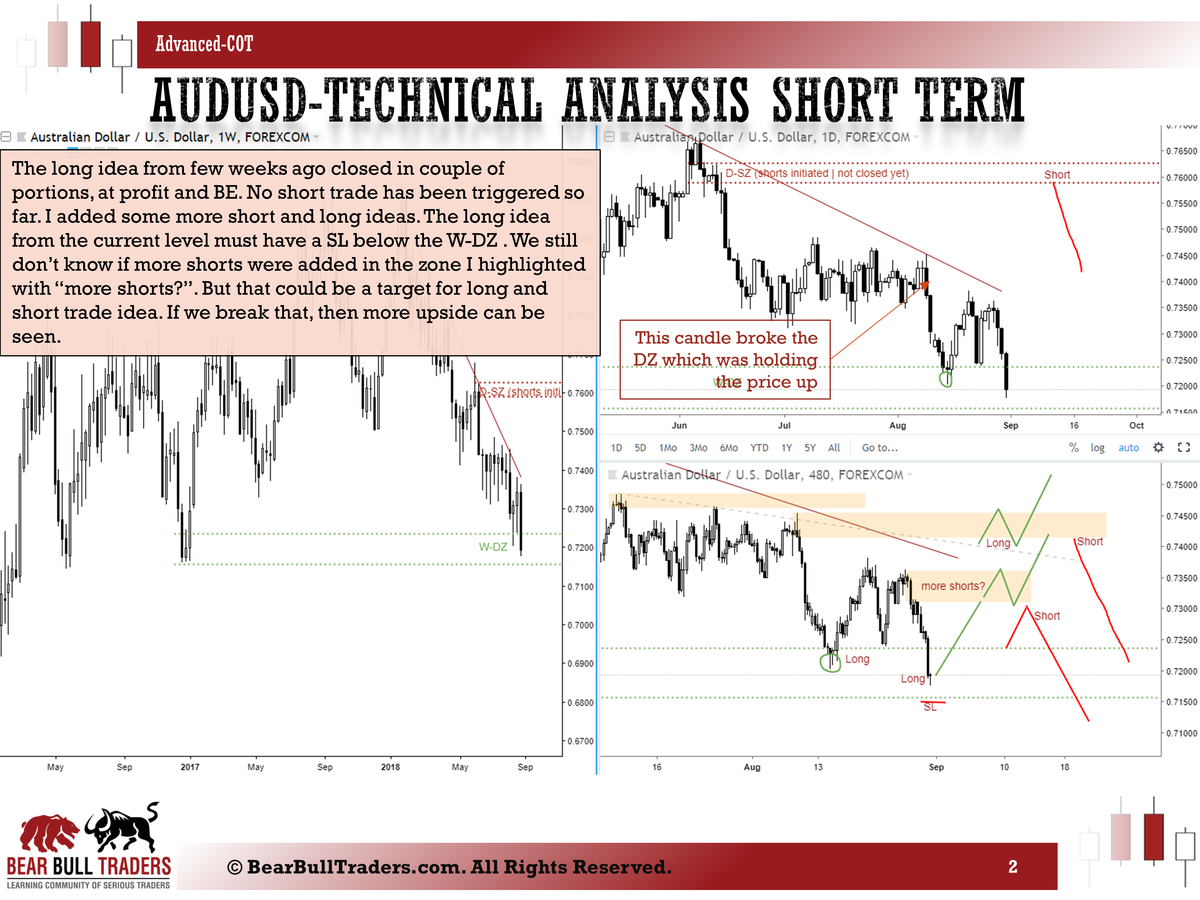
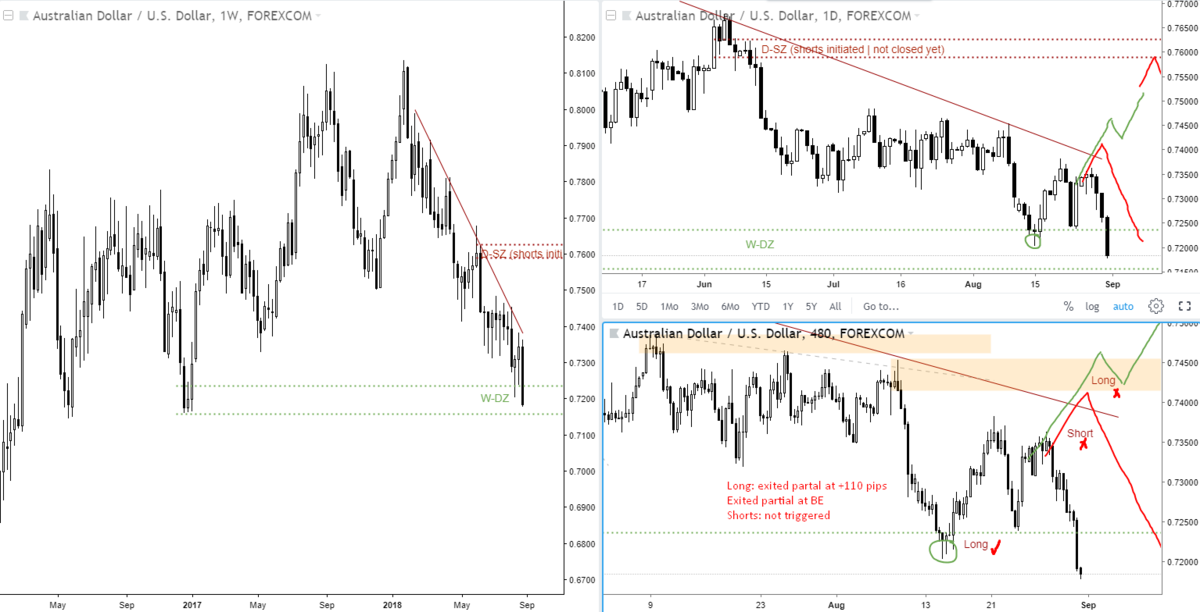
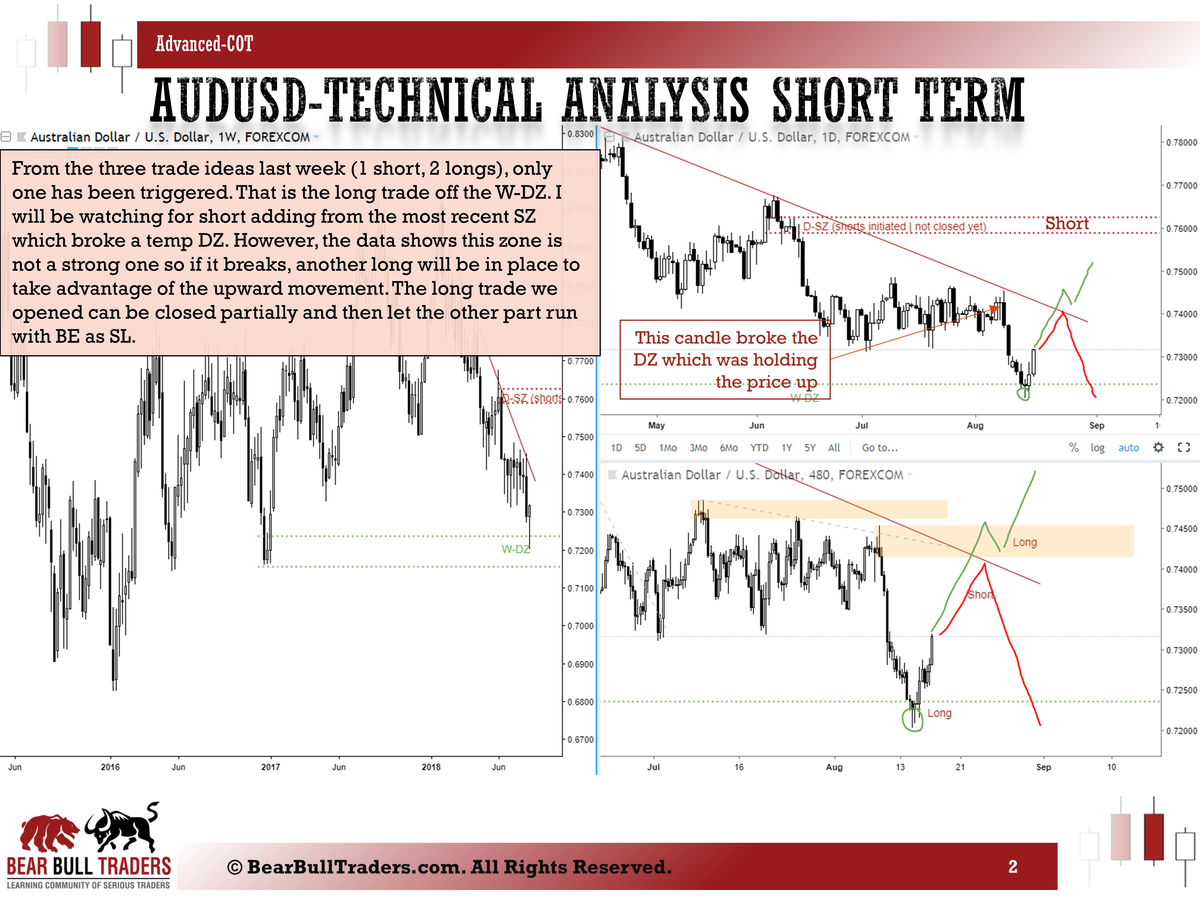
AUDUSD
Long idea: exited partial at +110 pips; exited partial at BE
Short idea: not triggered
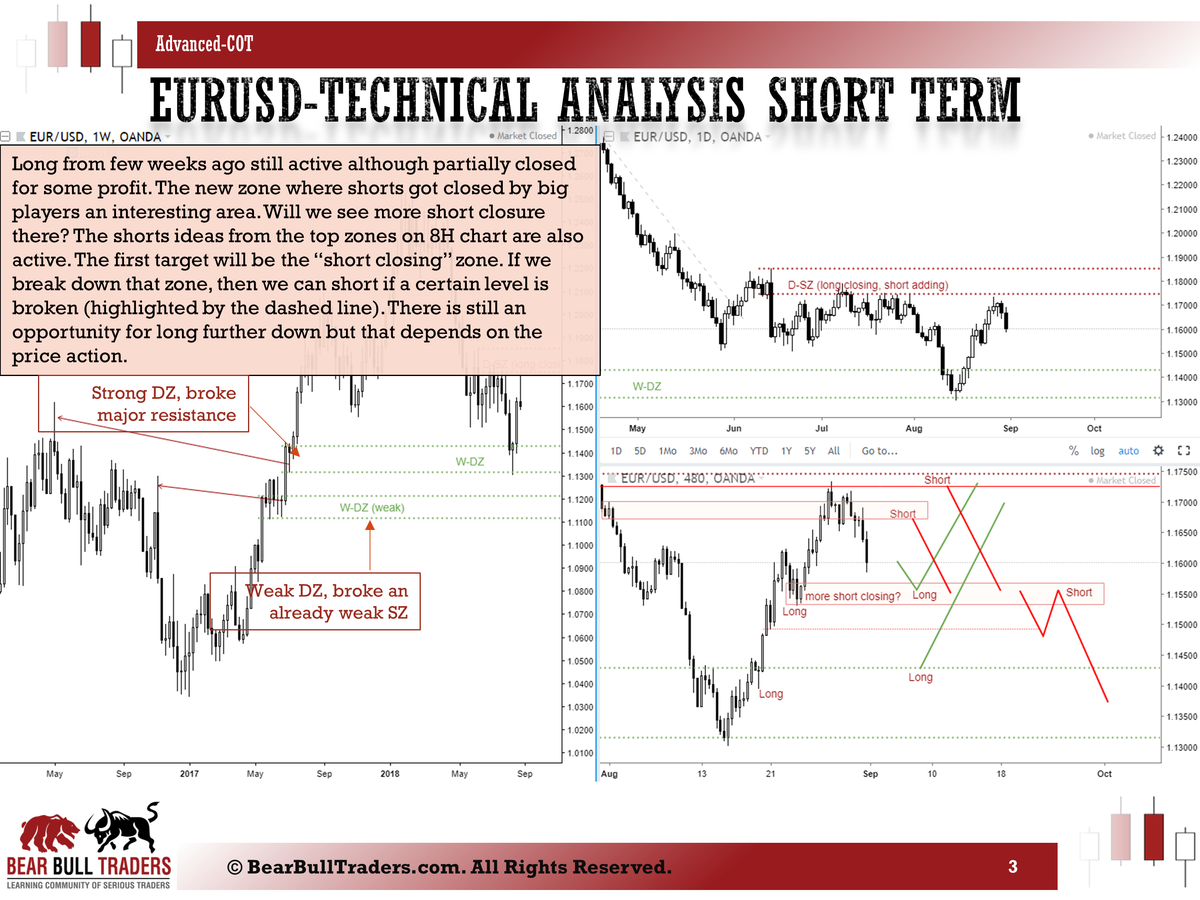
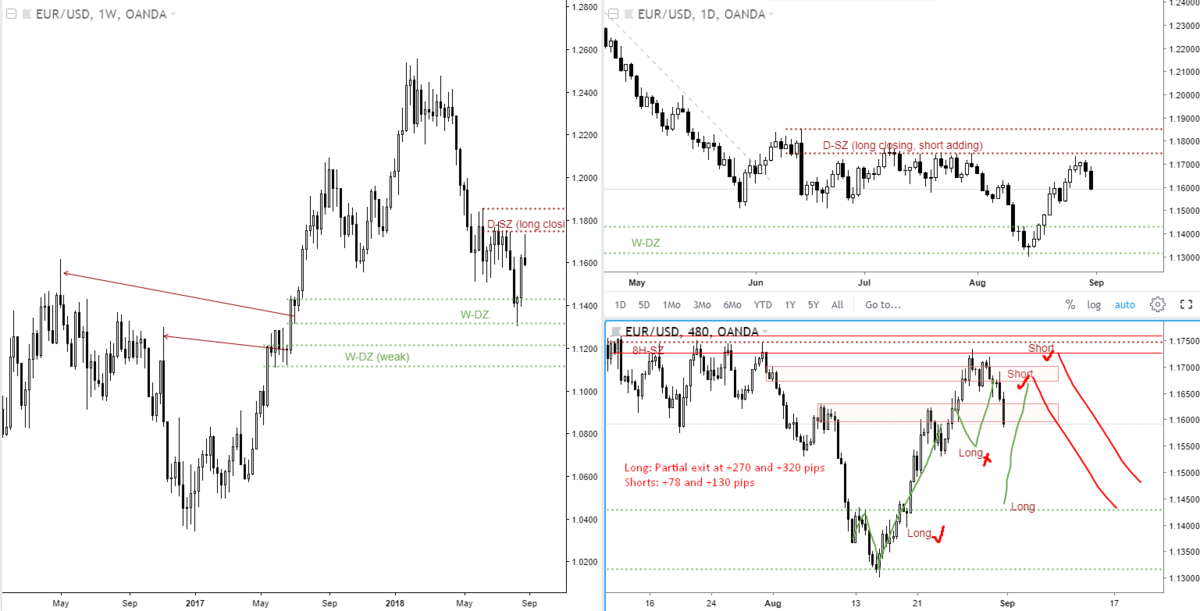
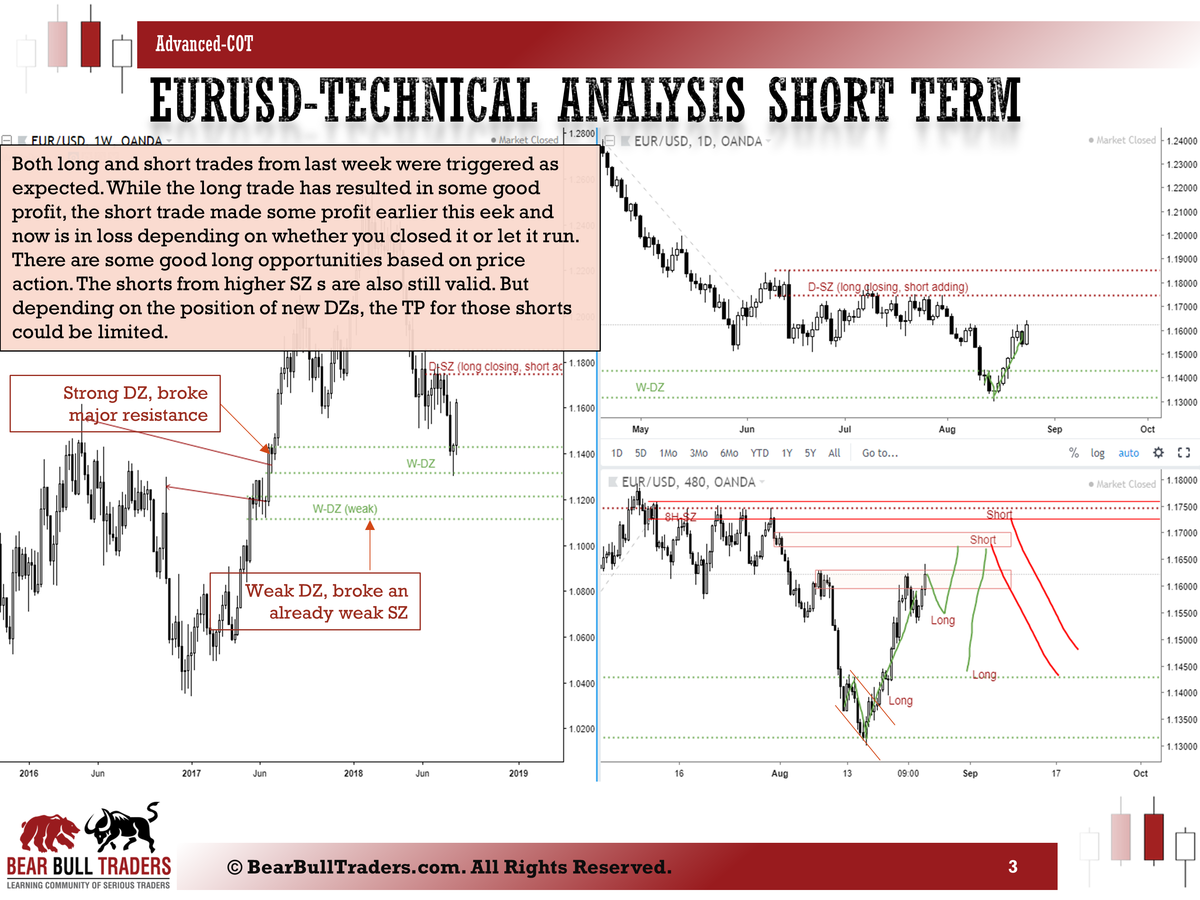
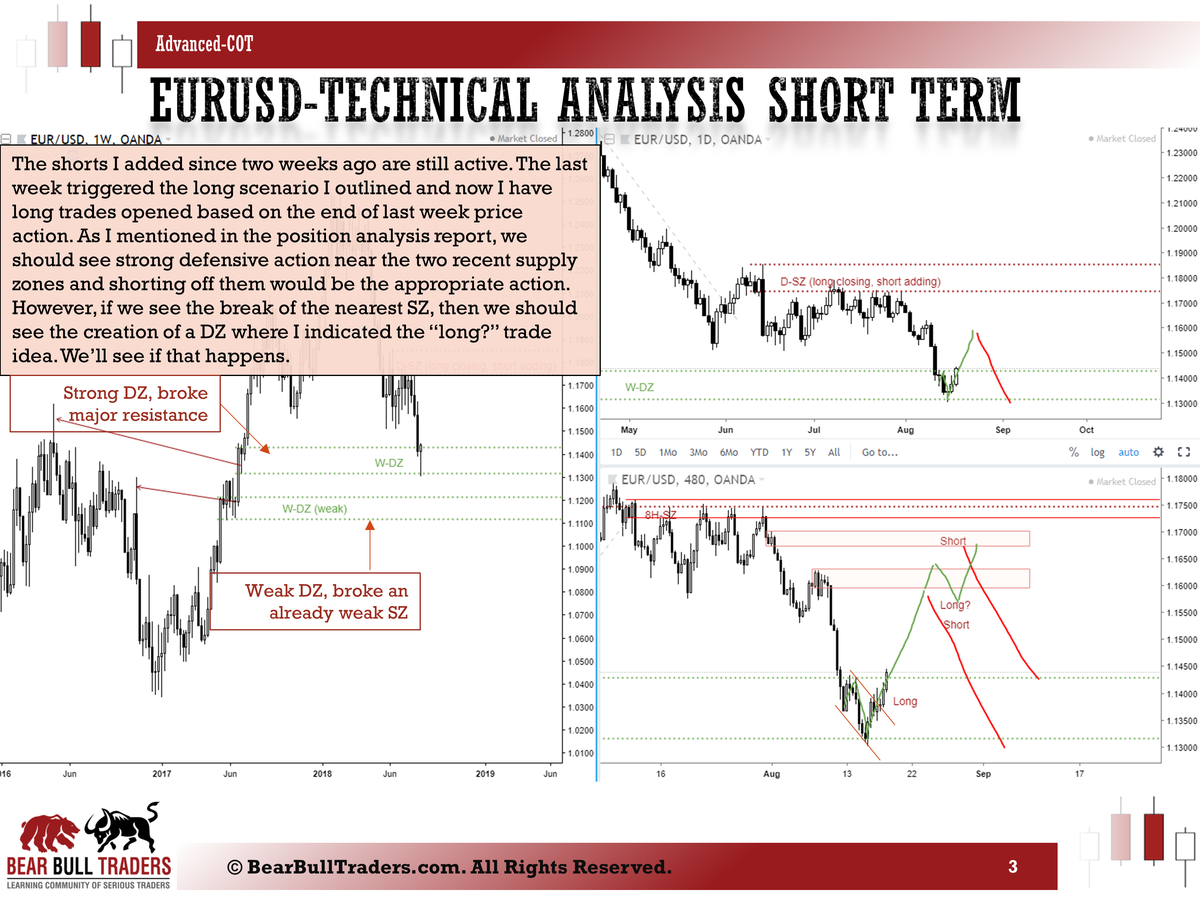
EURUSD
Long idea: Partial exit at +270 and +320 pips; partial running with BE SL
Short idea: Running with +78 and +130 pips
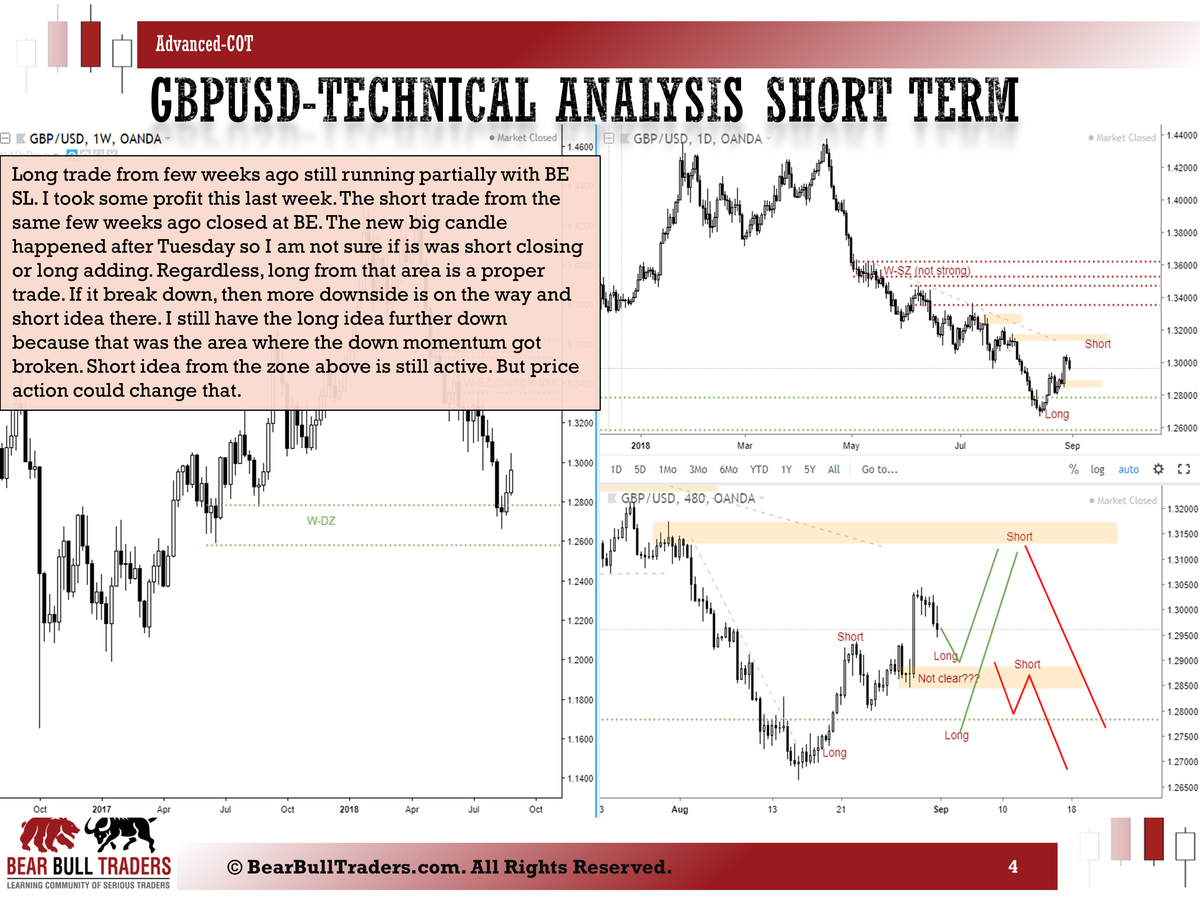
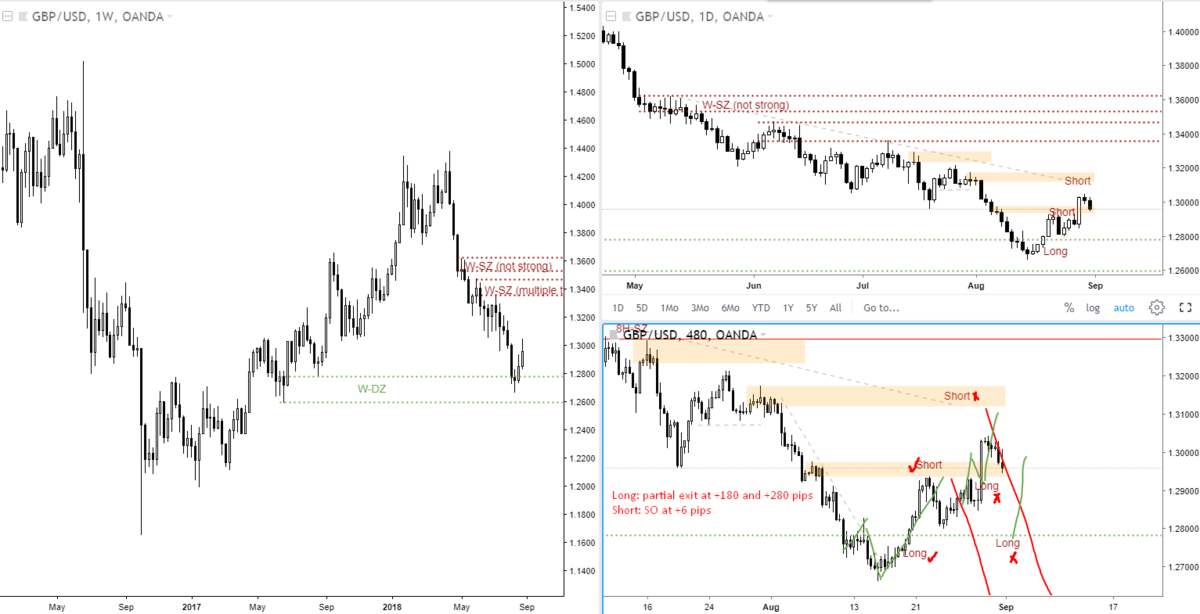
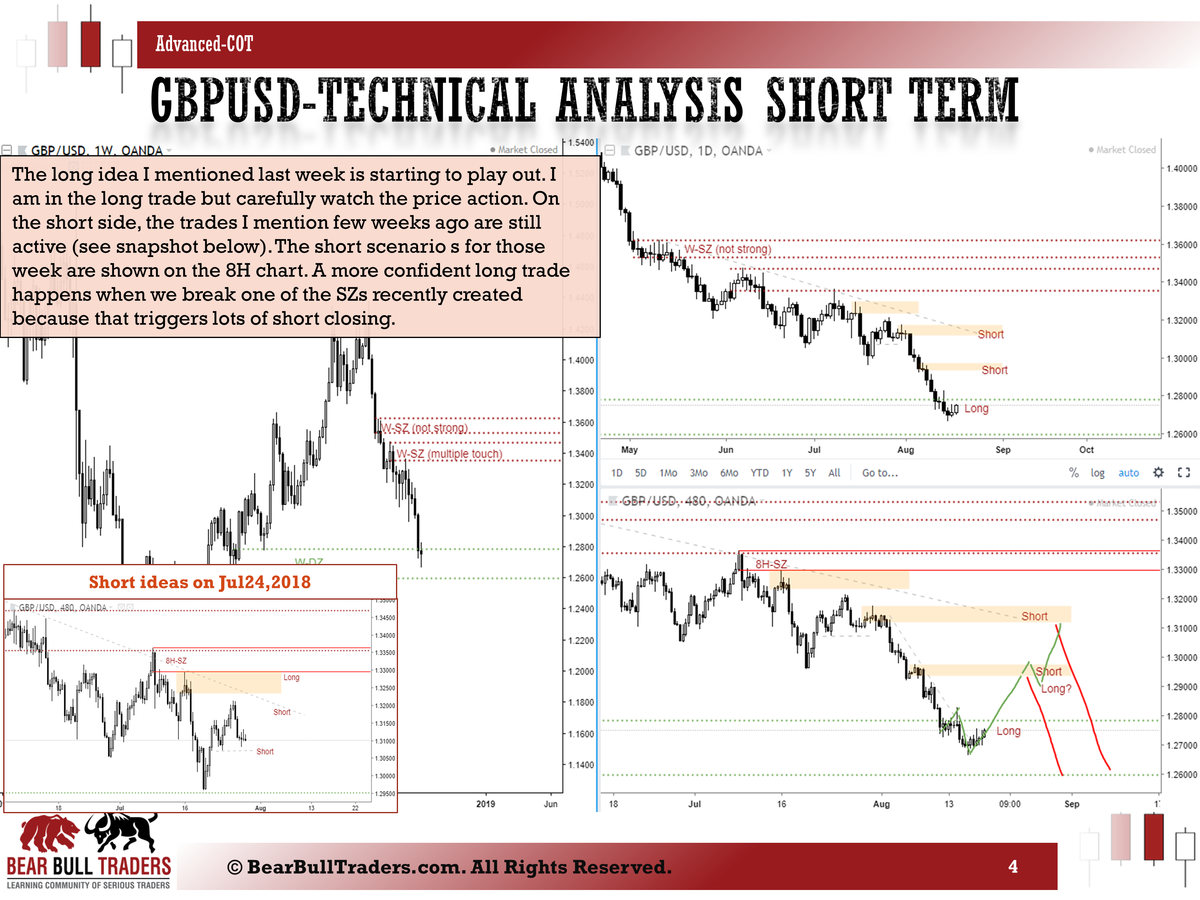
GBPUSD
Long idea: Partial exit at +180 and +280 pips; partial running with BE SL
Short idea: Stopped out with +6 pips, others not triggered
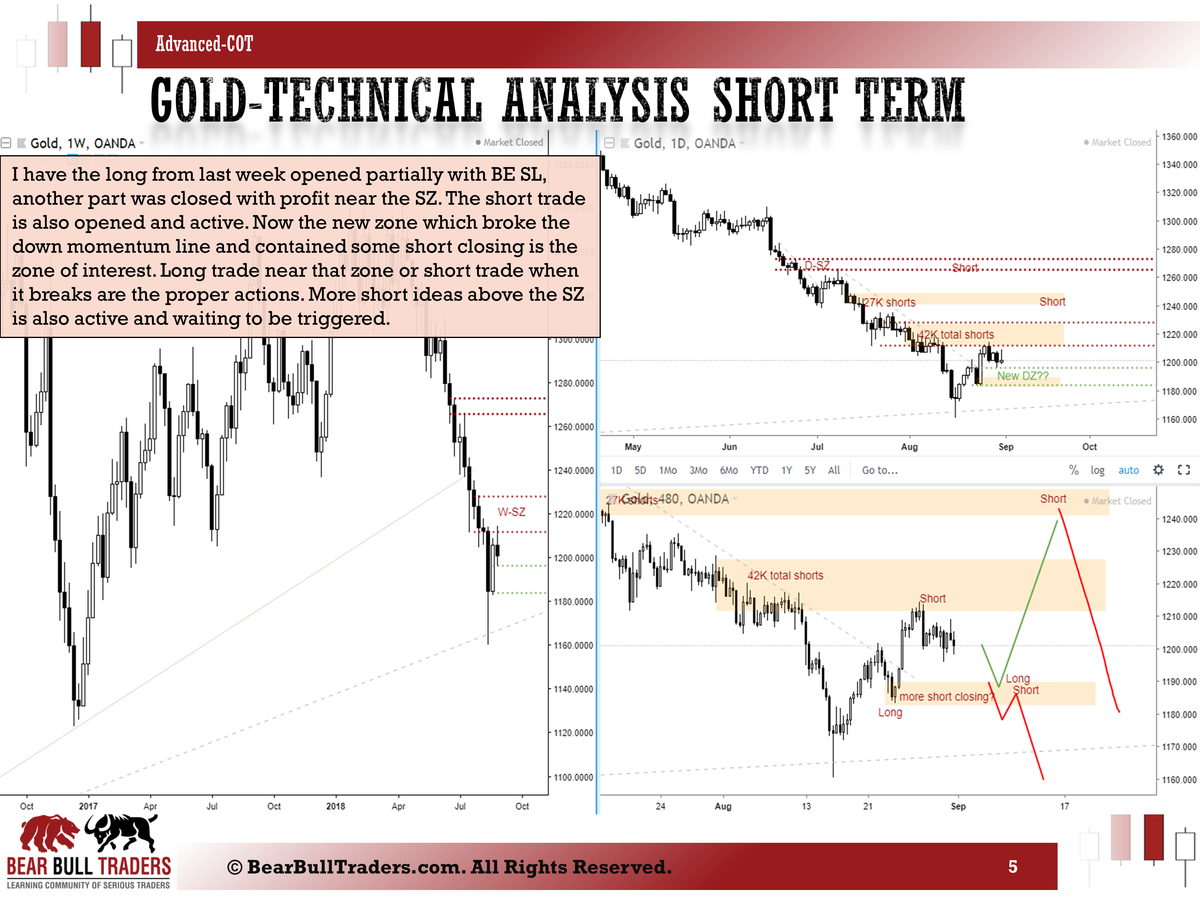
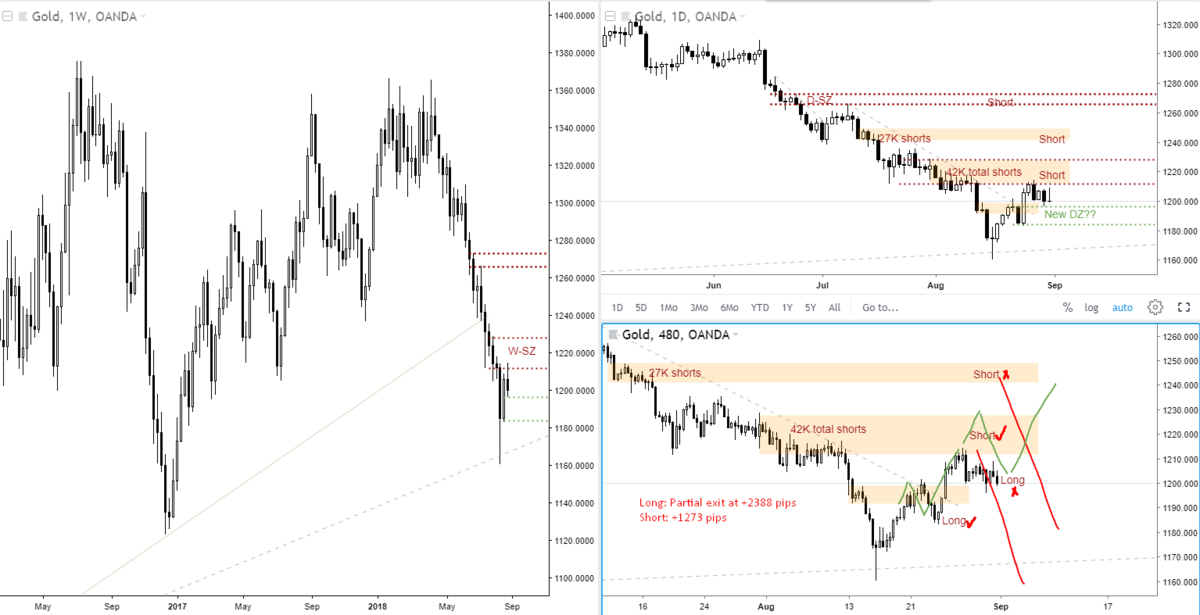
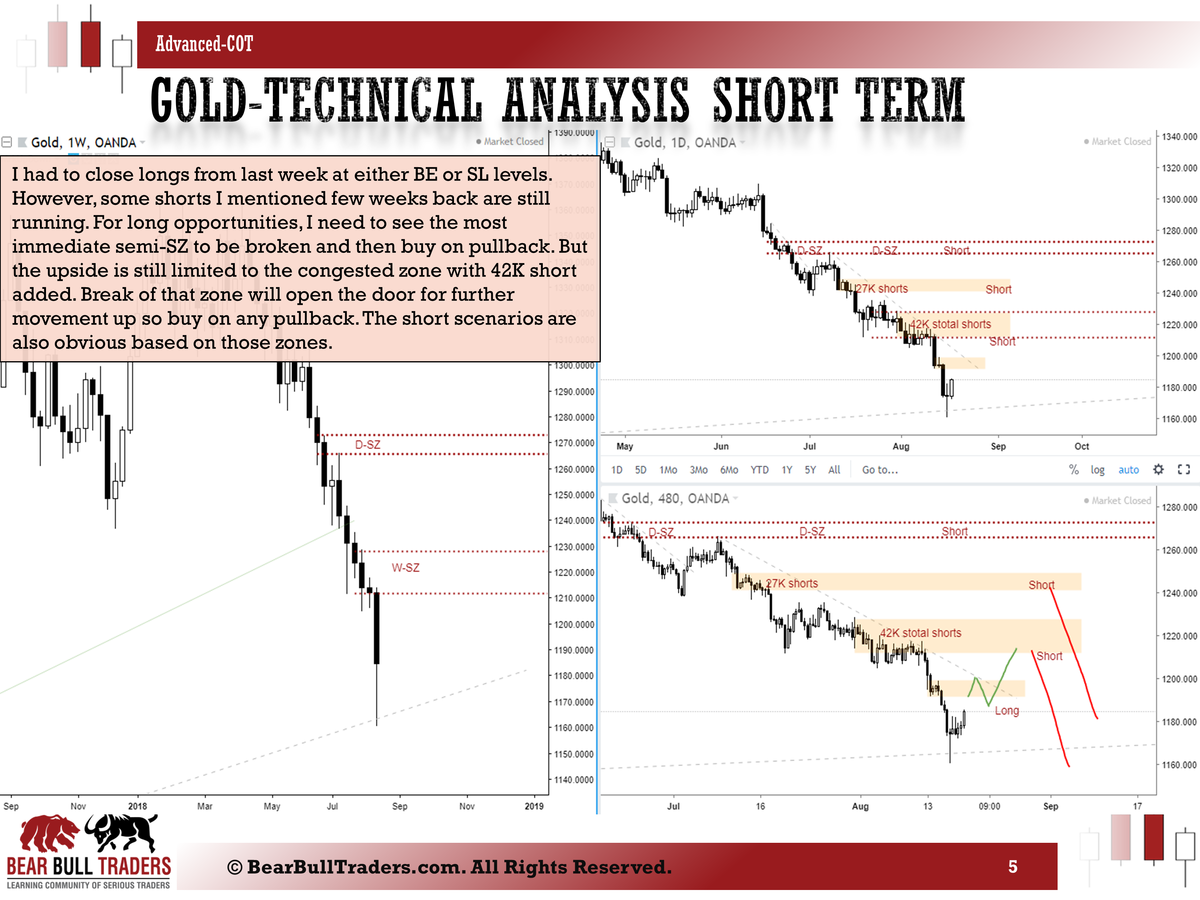
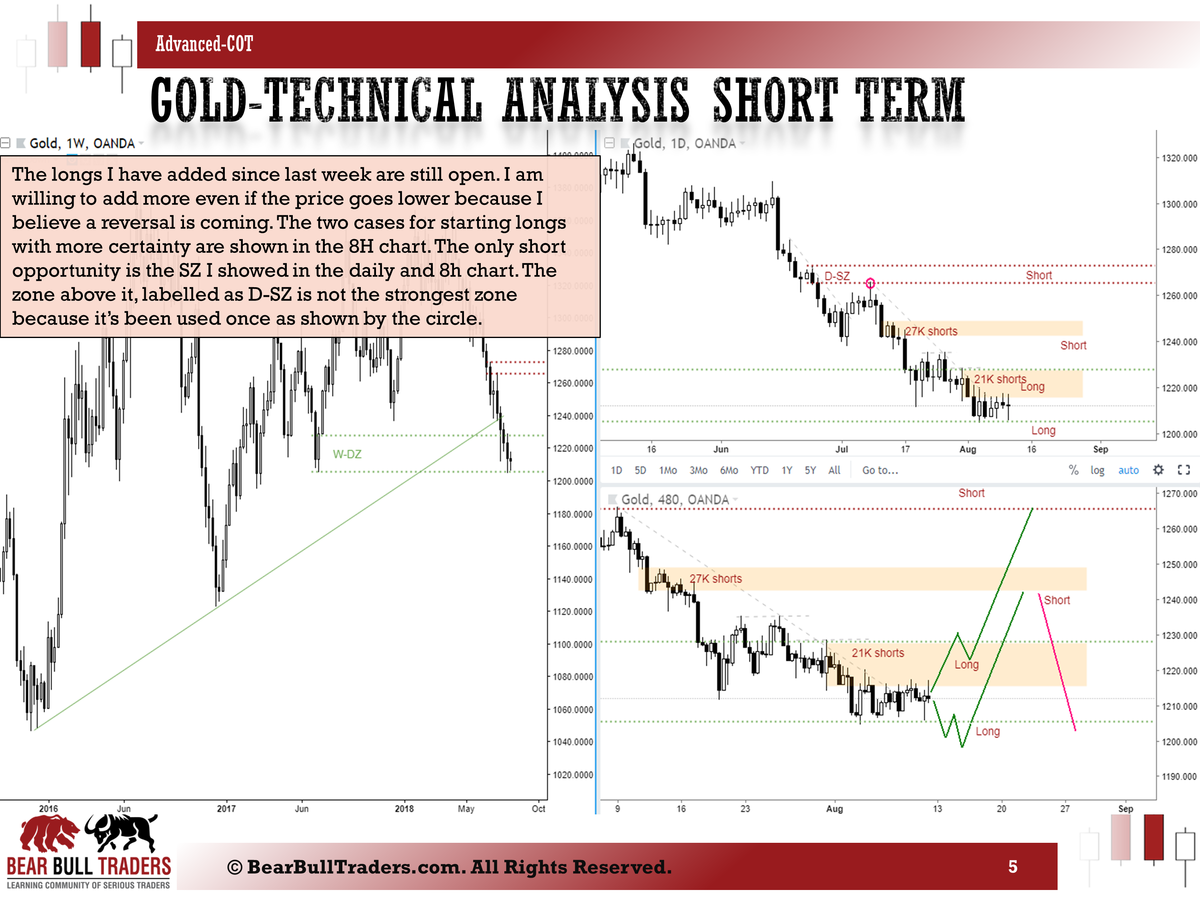
Gold
Long idea: Partial exit at +2388 pips; partial running with BE SL
Short idea: Running at +1273 pips
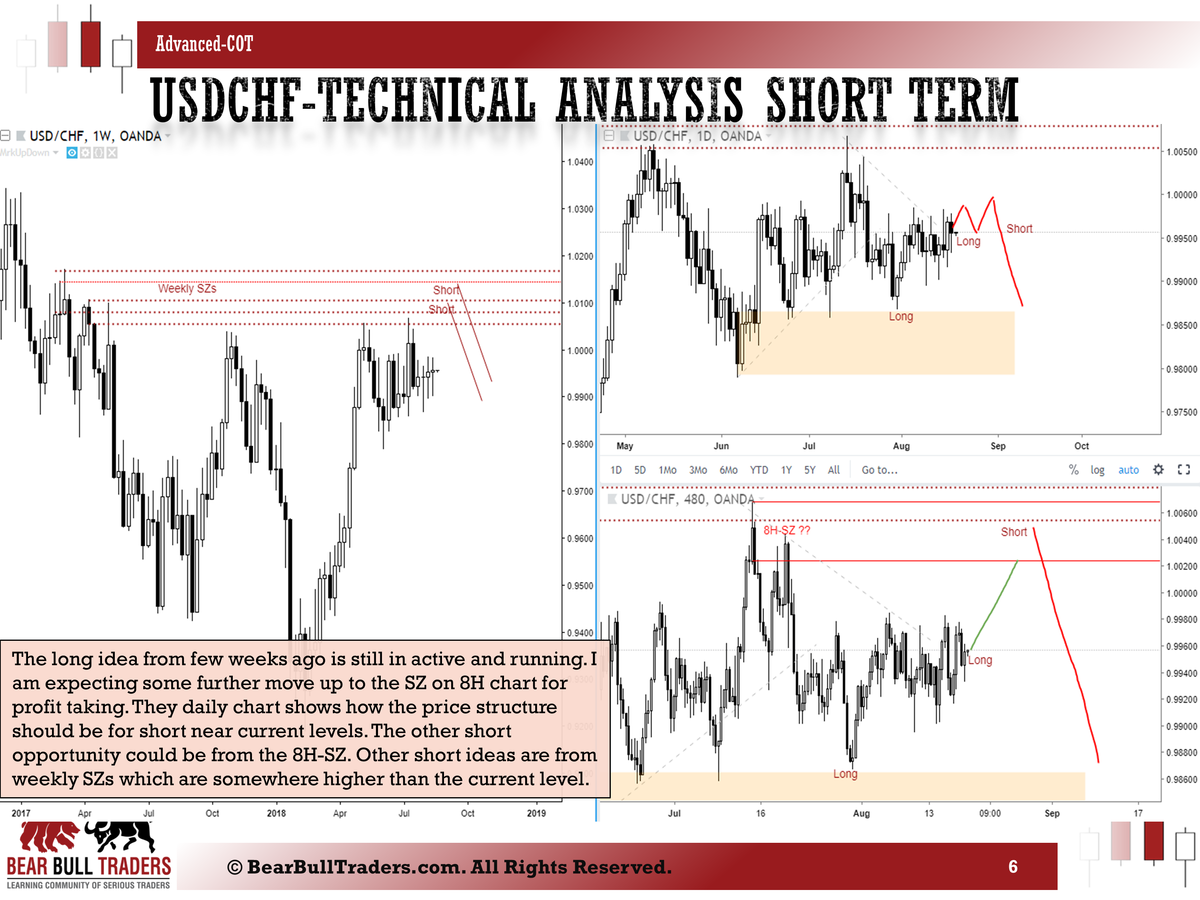
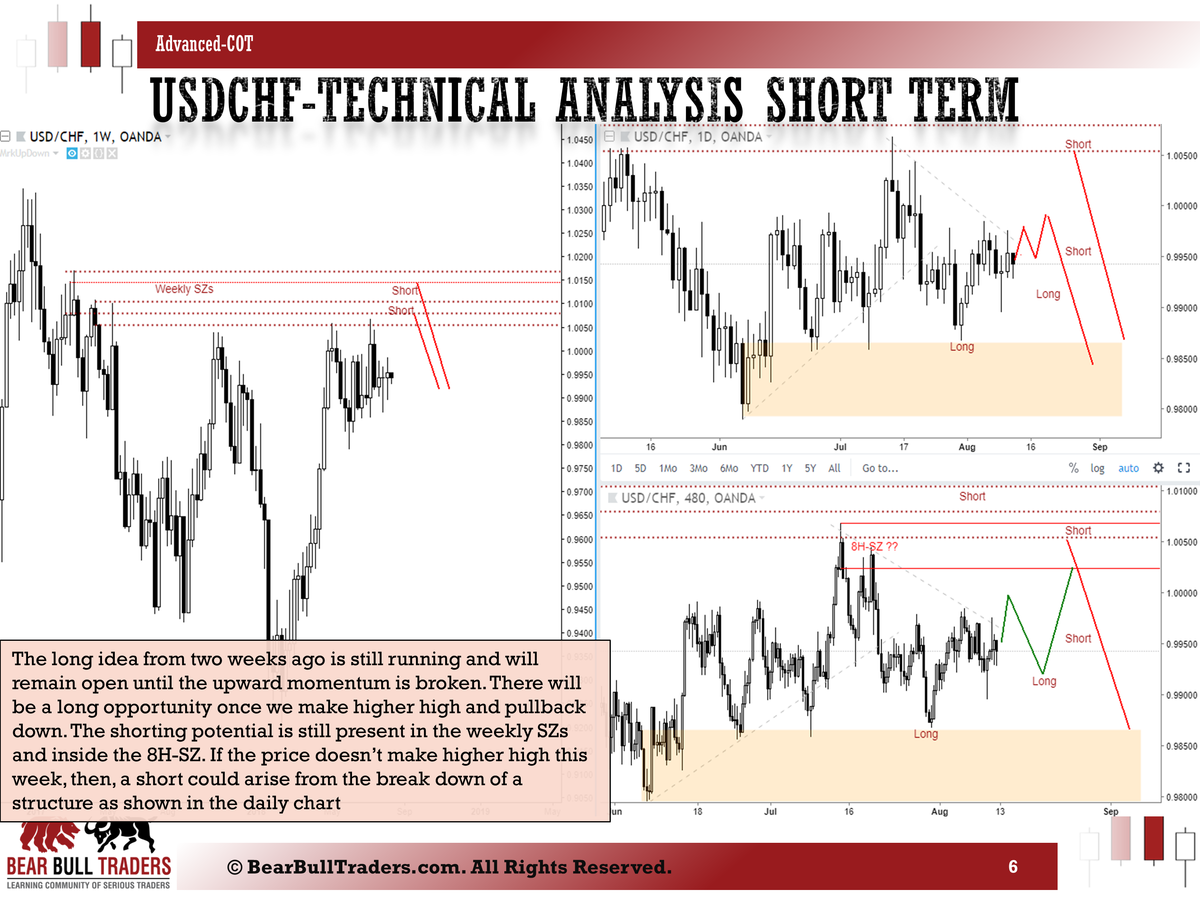
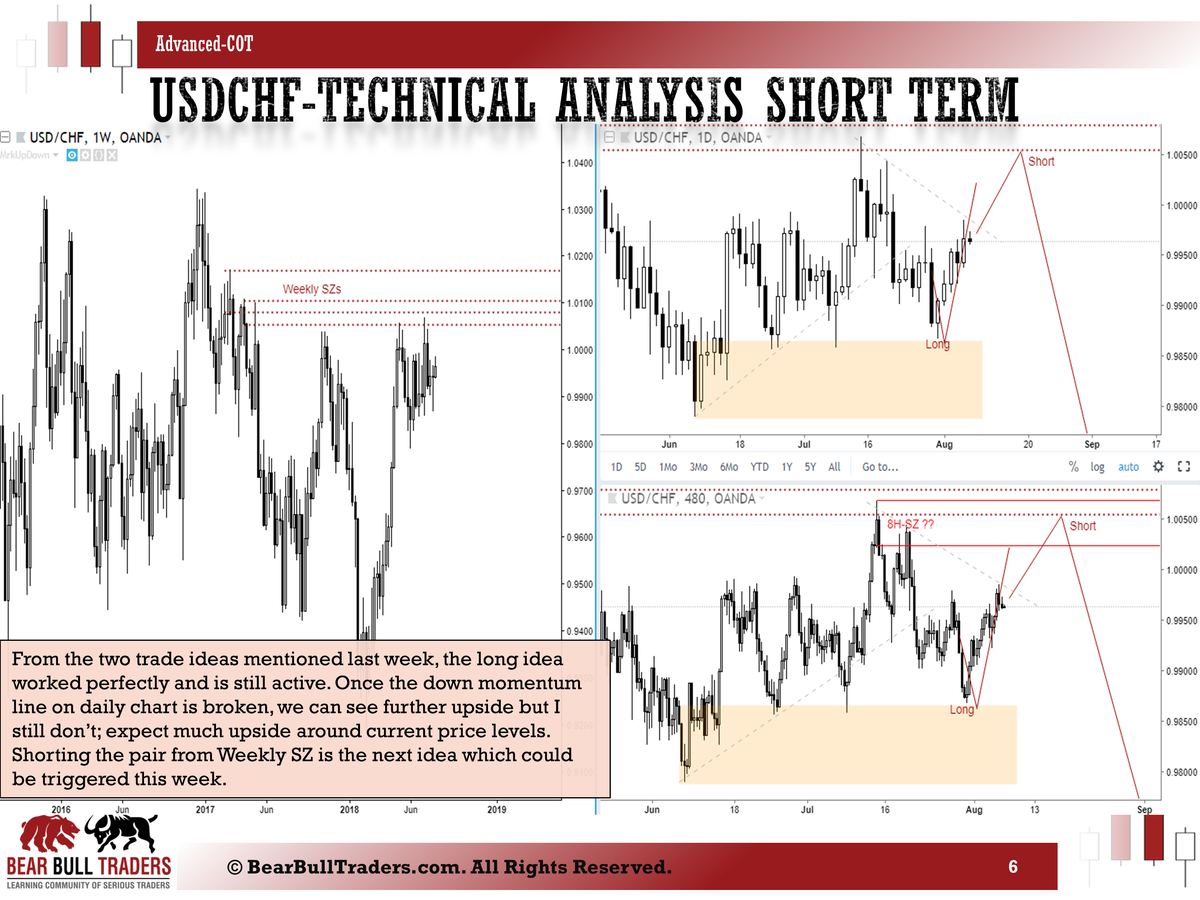
USDCHF
Long idea: Stopped out at -47 pips
Short idea: Not triggered
For more information on this type of analysis check out the previous posts in the education section of the forum here, here, and there.
Create a FREE account to get access to all previous weekly analysis and educational materials using the registration form found in this page.
If you want to discuss further and clarify things, please send me a message to [email protected]
Zack
-
Here are some possible trades based on the COT reports of August 21st, 2018. The trades are based on some lower timeframes for short term profits. The big picture trades are setting up in the bigger timeframes and what I explained in the COT analysis posted here.
For more information on this type of analysis check out the previous posts in the education section of the forum here, here, and there.
If you want to discuss further and clarify things, please send me a message to [email protected]
Zack
-
Here is a snapshot of the weekly analysis based on August 21st, 2018 COT (Legacy, Traders in Financial Futures) reports.
More trade updates will come in the following post.
For more information on this type of analysis check out the previous posts in the education section of the forum here, here, and there.
If you want to discuss further and clarify things, please send me a message to [email protected]
Zack
-
EUR shorts added more over the past week and poke deeper into net short territory.
More GBP shorts were added by large speculators. These are relatively large numbers but they managed to keep exposure to 33% long.
AUD and NZD are seeing some stability in long exposures. Not much action going on in this week's data for NZD and NZD. Perhaps AUD data show up next week after all those political turmoil.
USDCAD longs are stable at 65% exposure for the second week now.
USDJP saw a big shift from 69% to 65% long exposure.
Oil also has shown some serious action in the short direction. long exposure dropped 3% on oil.
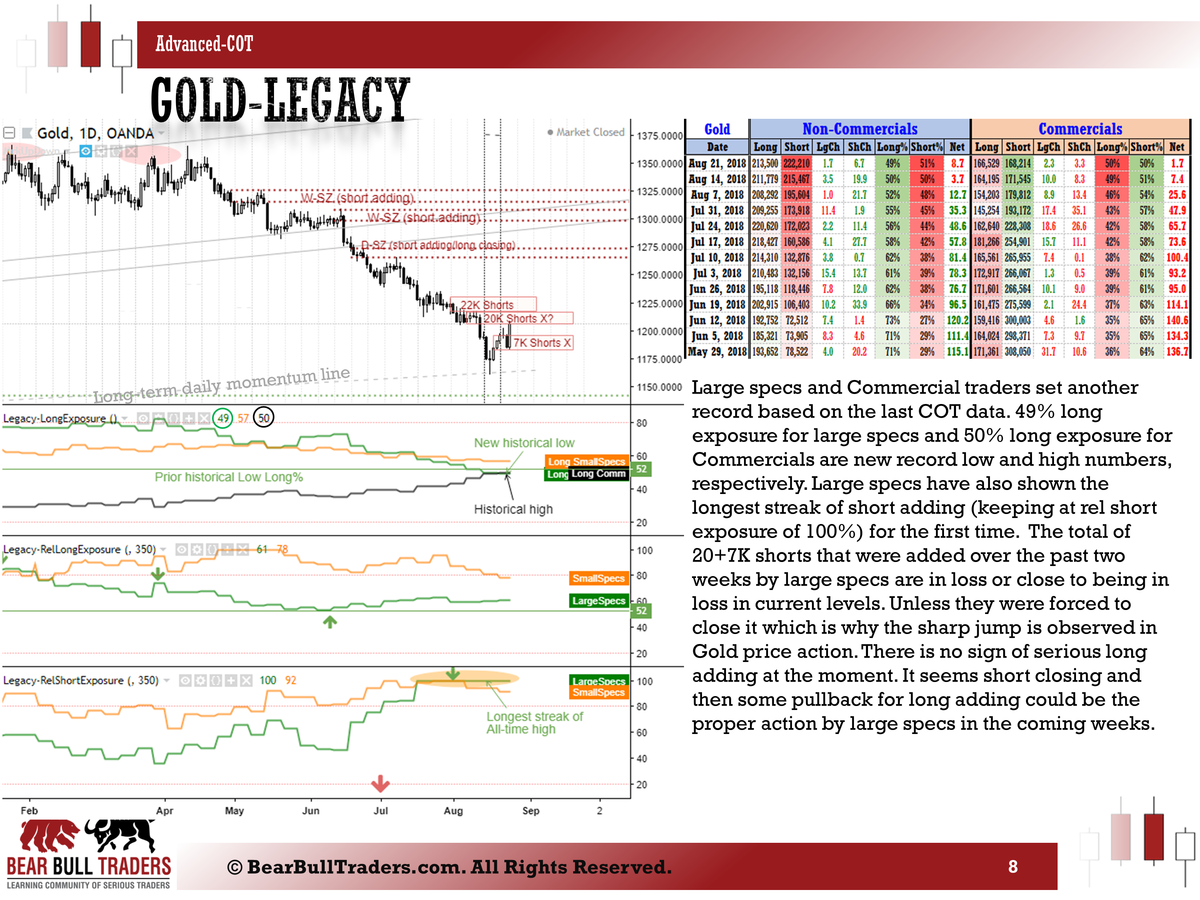
Gold still hitting all-time high record numbers in every metric by large speculators and commercials. Commercial traders have never been this long. Maybe that' what triggered the strong move up in Gold since yesterday.
For more information on this type of analysis check out the previous posts in the education section of the forum here, here, and there.
Create a FREE account to get access to all previous weekly analysis and educational materials using the registration form found in this page.
If you want to discuss further and clarify things, please send me a message to [email protected]
Zack
-
Update on the trade ideas based on the analysis of COT reports last week which were posted here and the trade ideas posted here
COT data will be released shorty at 12:30 EST so stay tuned for more updates.
AUDUSD
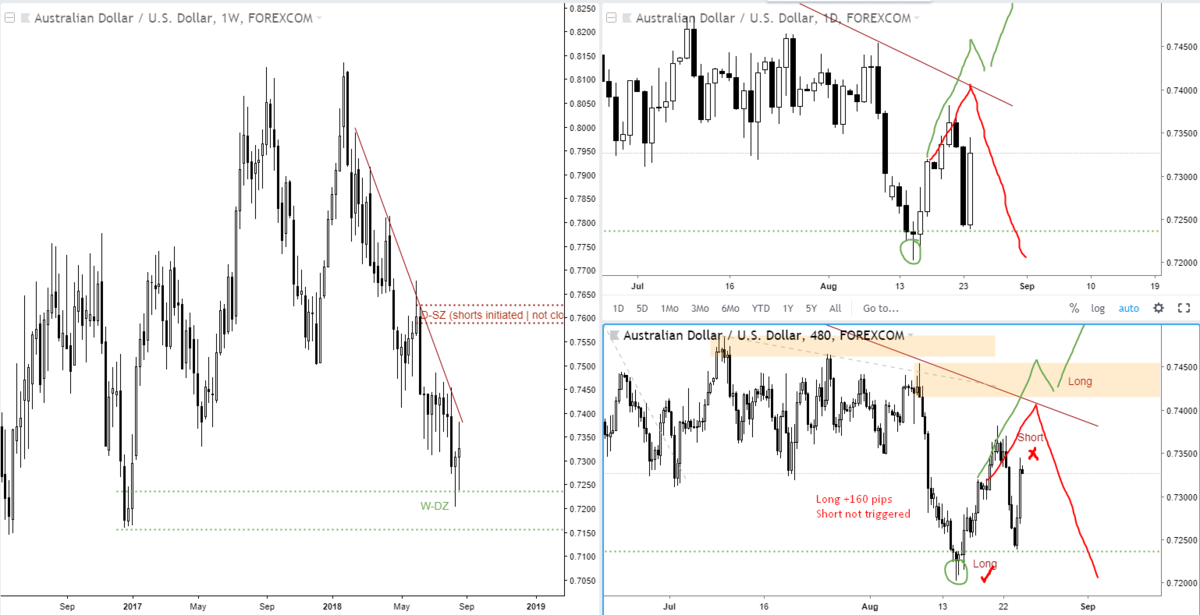
Long idea: +160 pips
Short idea: not triggered
EURUSD
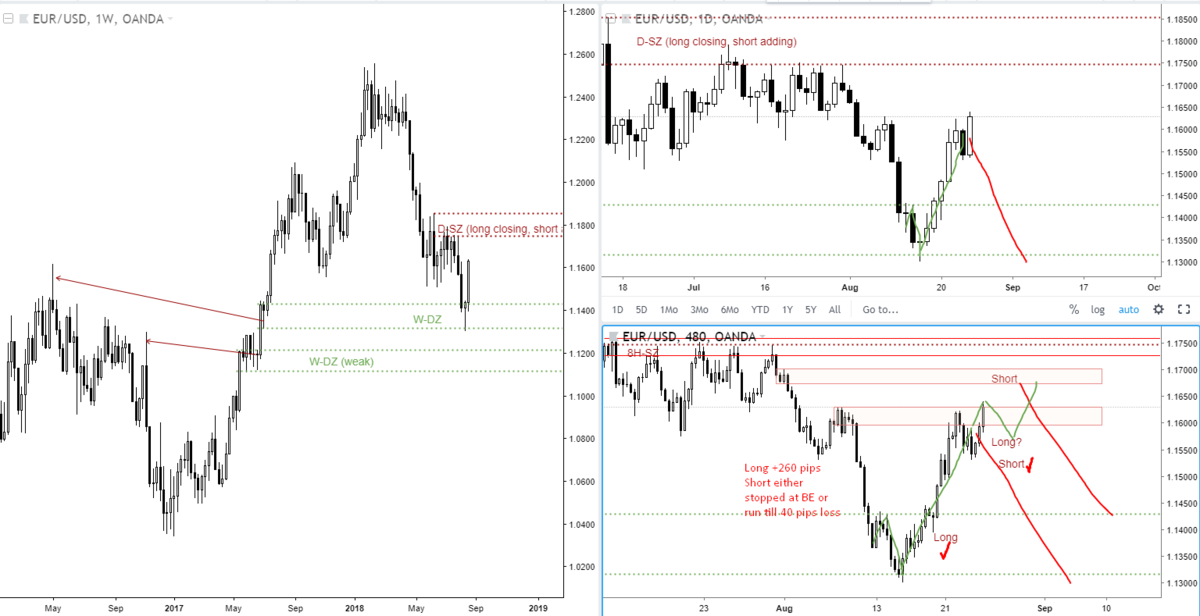
Long idea: +260 pips
Short idea: either stopped at BE or run with ~40 pips SL
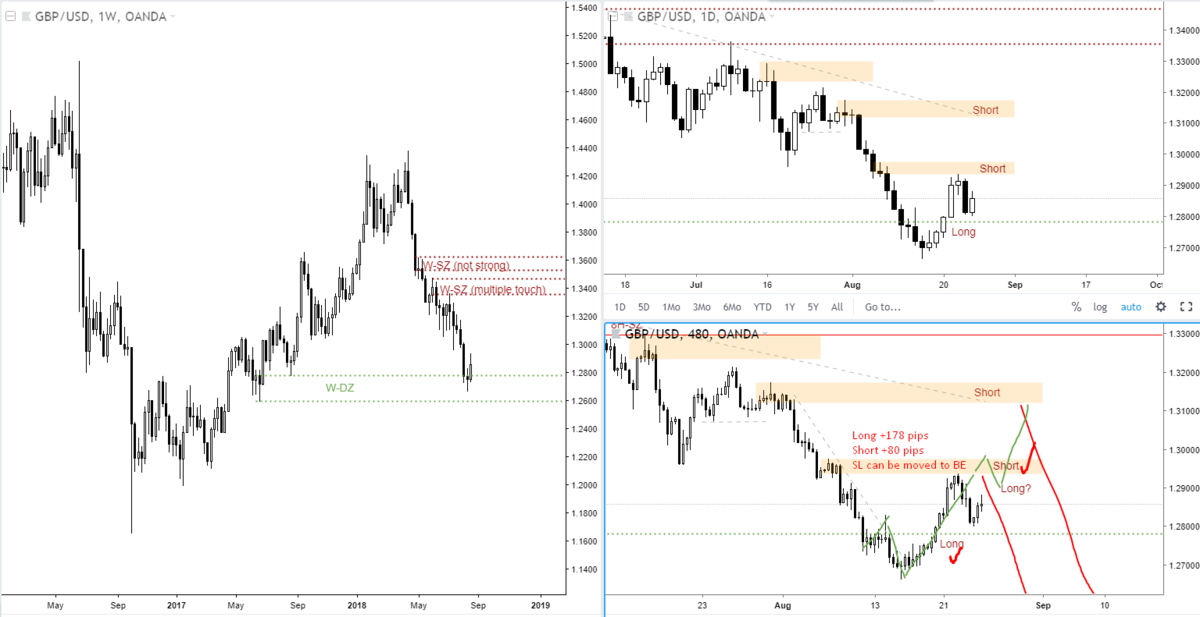
GBPUSD
Long idea: +178 pips
Short idea: + 80 pips , SL can be moved to BE
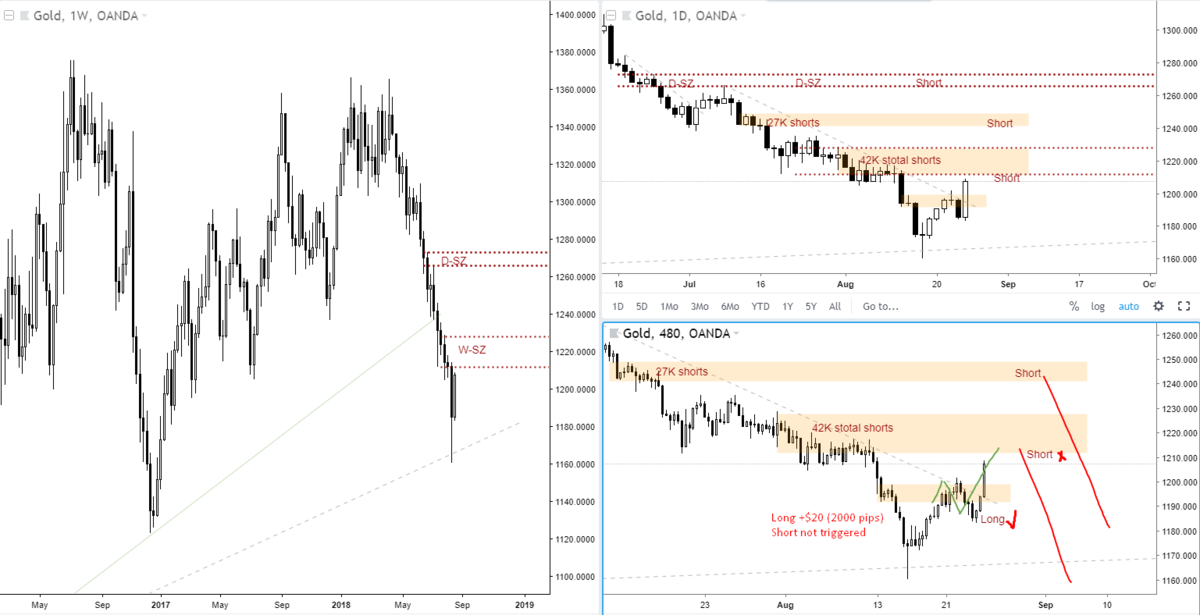
Gold
Long idea: +$20 or 2,000 pips
Short idea: not triggered
For more information on this type of analysis check out the previous posts in the education section of the forum here, here, and there.
Create a FREE account to get access to all previous weekly analysis and educational materials using the registration form found in this page.
If you want to discuss further and clarify things, please send me a message to [email protected]
Zack
-
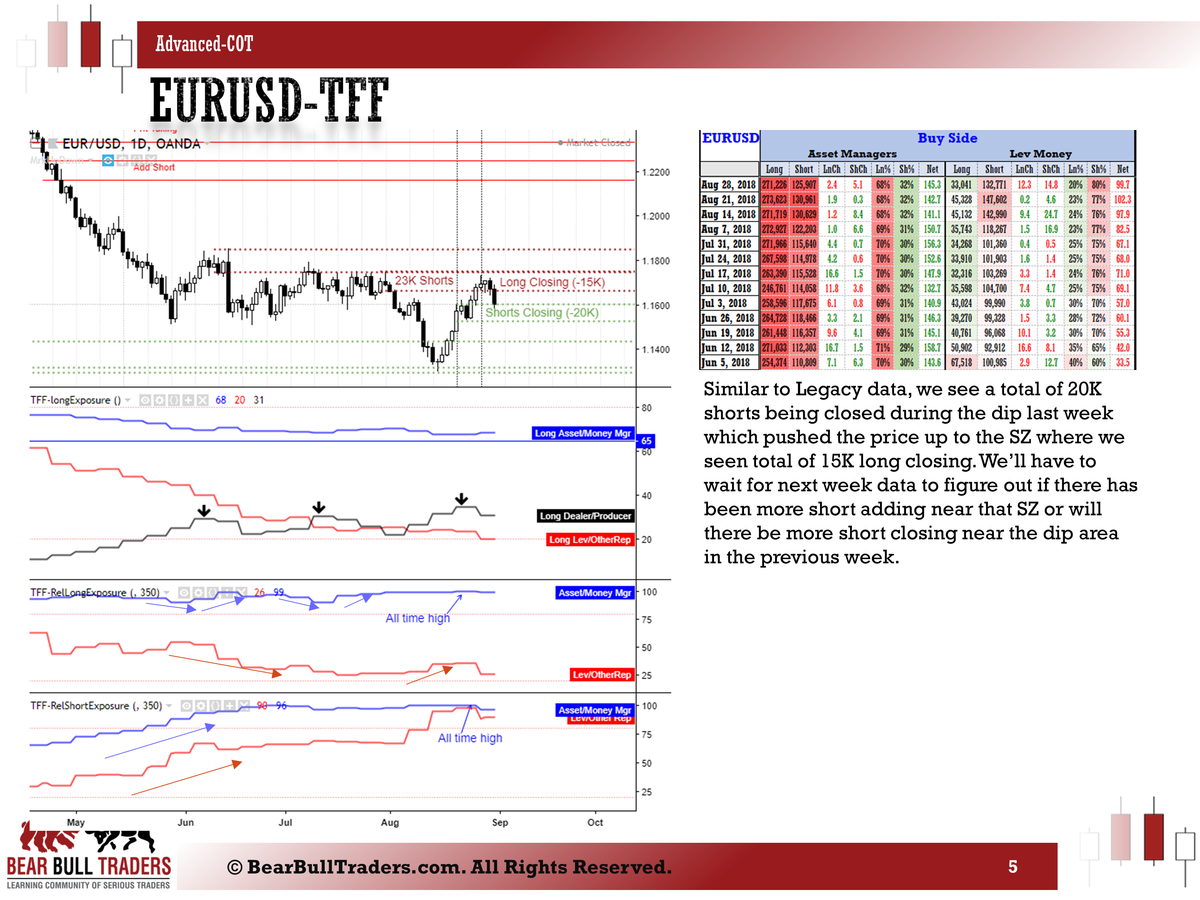
EURUSD: does this recent upside move look like a short closing (profit taking) or long adding?
Price already forced all those 23K shorts to close IMO. But wait until the zone is fully broken, then look for the demand zone.
-
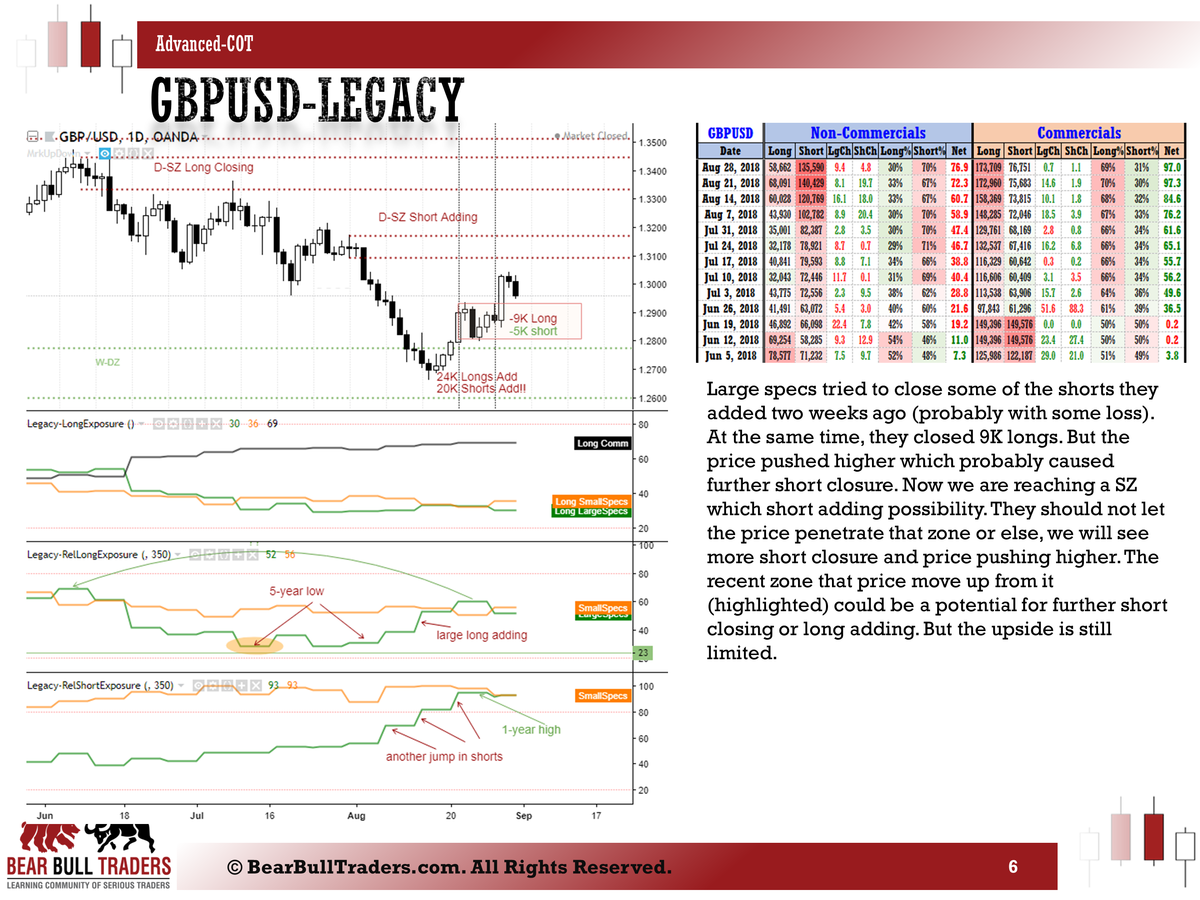
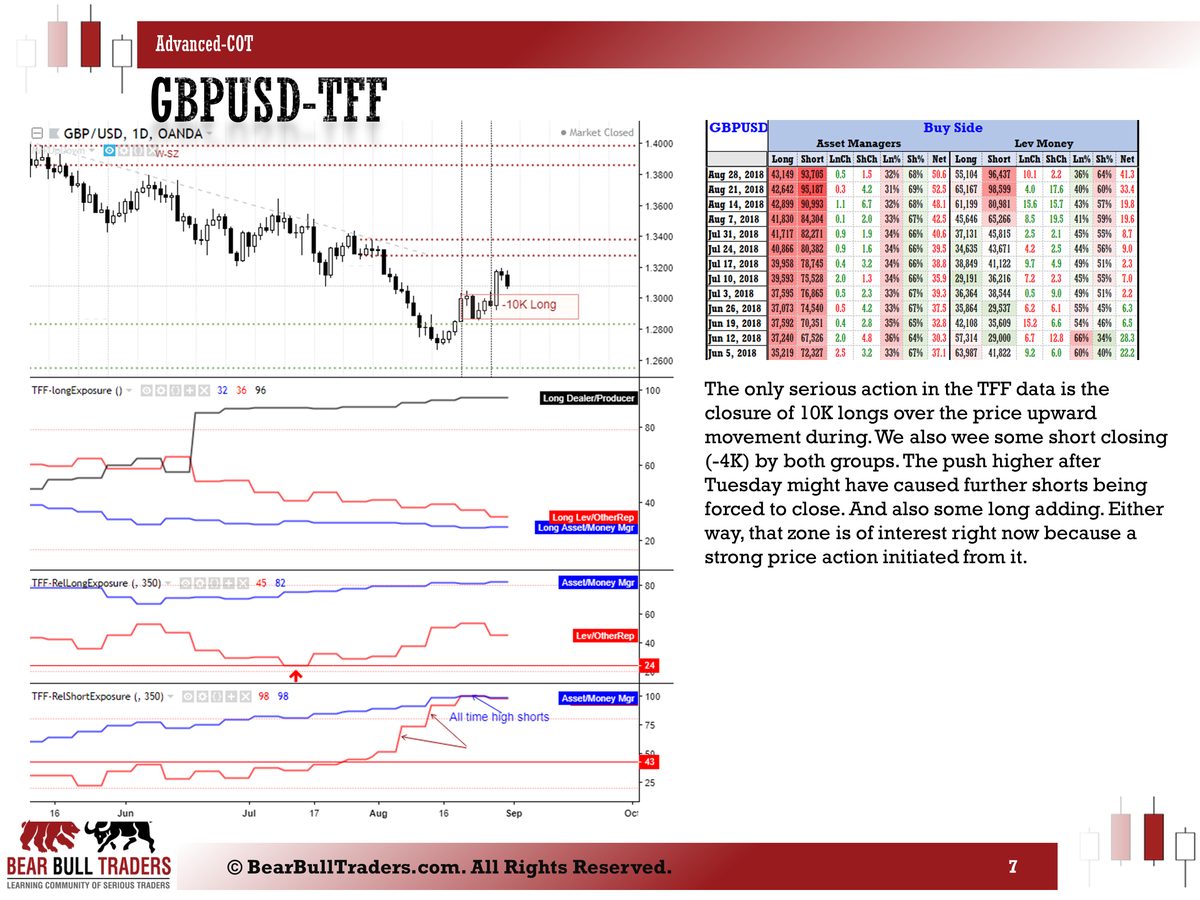
GBPUSD long also working out as expected. Now near the SZ, short trade with minimal risk.
-
AUDUSD long now in 140 pips profit. Still has room till the SZ.
-
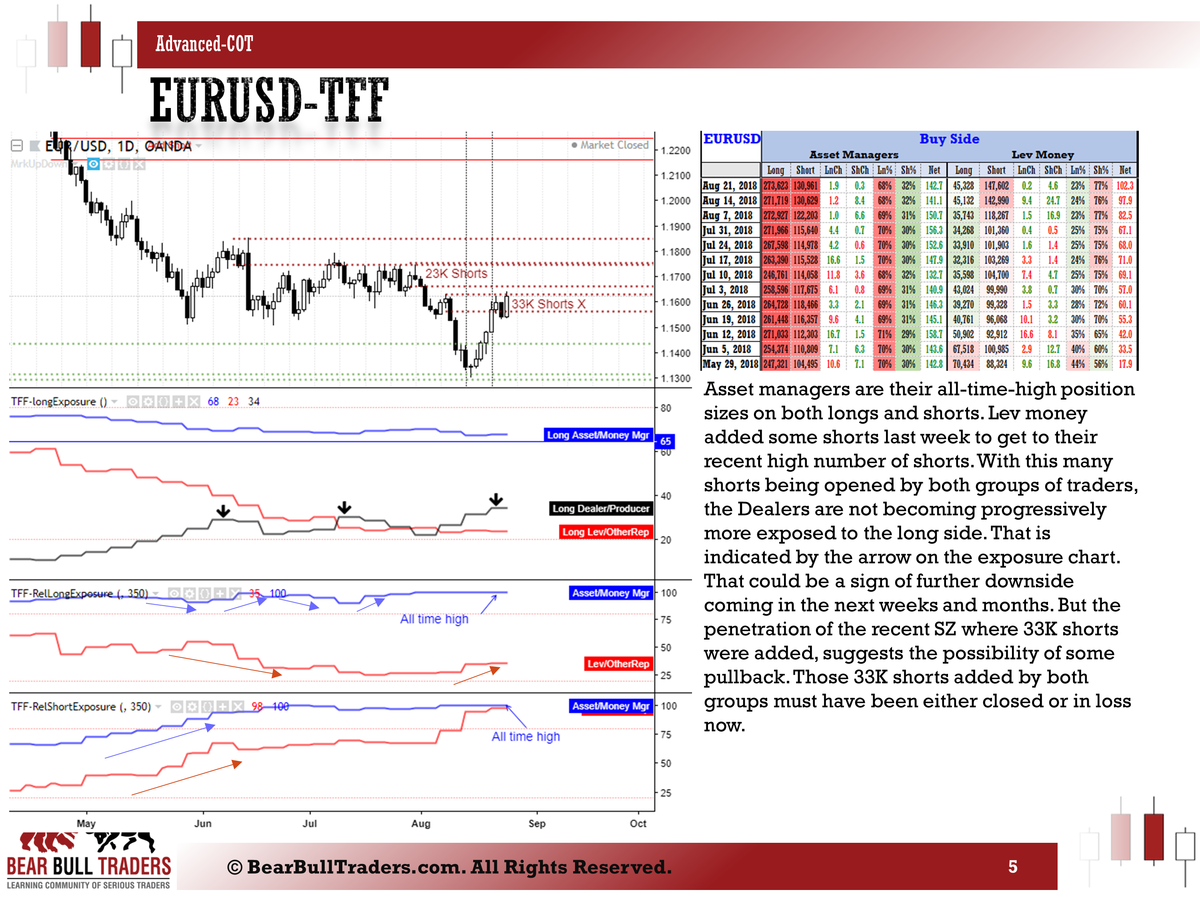
EURUSD long looking good so far (210 pips). Waiting to see breakout of that heavily shorted zone.
If shorting here, SL has to be above the all short pile ups not right above the current zone.
-
Here is a snapshot of the weekly analysis based on August 14th, 2018 COT (Legacy, Traders in Financial Futures) reports.
More trade updates will come in the following post.
For more information on this type of analysis check out the previous posts in the education section of the forum here, here, and there.
Create a FREE account to get access to all previous weekly analysis and educational materials using the registration form found in this page.
If you want to discuss further and clarify things, please send me a message to [email protected]
Zack
-
Here are some possible trades based on the COT reports of August 14th, 2018. The trades are based on some lower timeframes for short term profits. The big picture trades are setting up in the bigger timeframes and what I explained in the COT analysis posted here.
For more information on this type of analysis check out the previous posts in the education section of the forum here, here, and there.
If you want to discuss further and clarify things, please send me a message to [email protected]
Zack
-
Here is a snapshot of the weekly analysis based on August 14th, 2018 COT (Legacy, Traders in Financial Futures) reports.
More trade updates will come in the following post.
For more information on this type of analysis check out the previous posts in the education section of the forum here, here, and there.
If you want to discuss further and clarify things, please send me a message to [email protected]
Zack
-
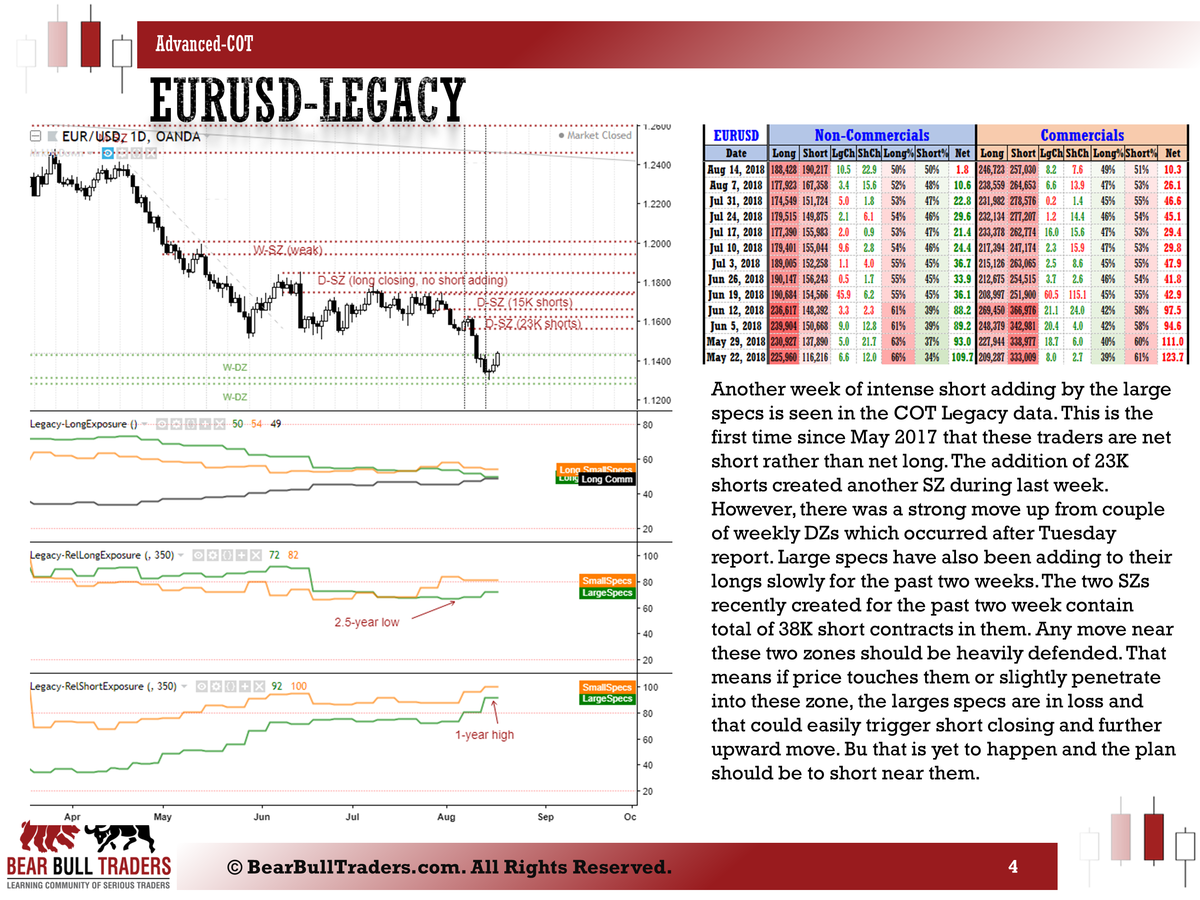
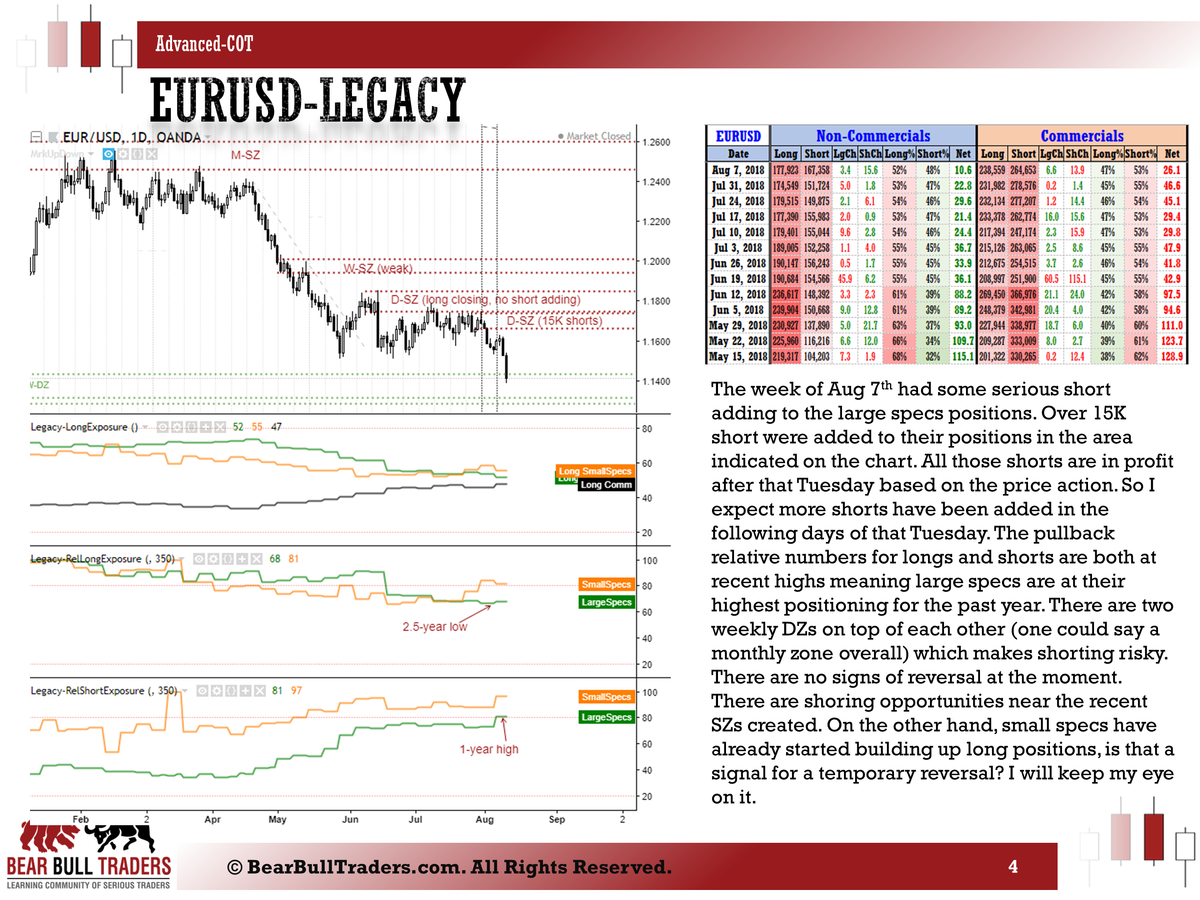
EUR shorts are their highest level over the past year and Large Speculators are now Net Short for the first time since May 2017.
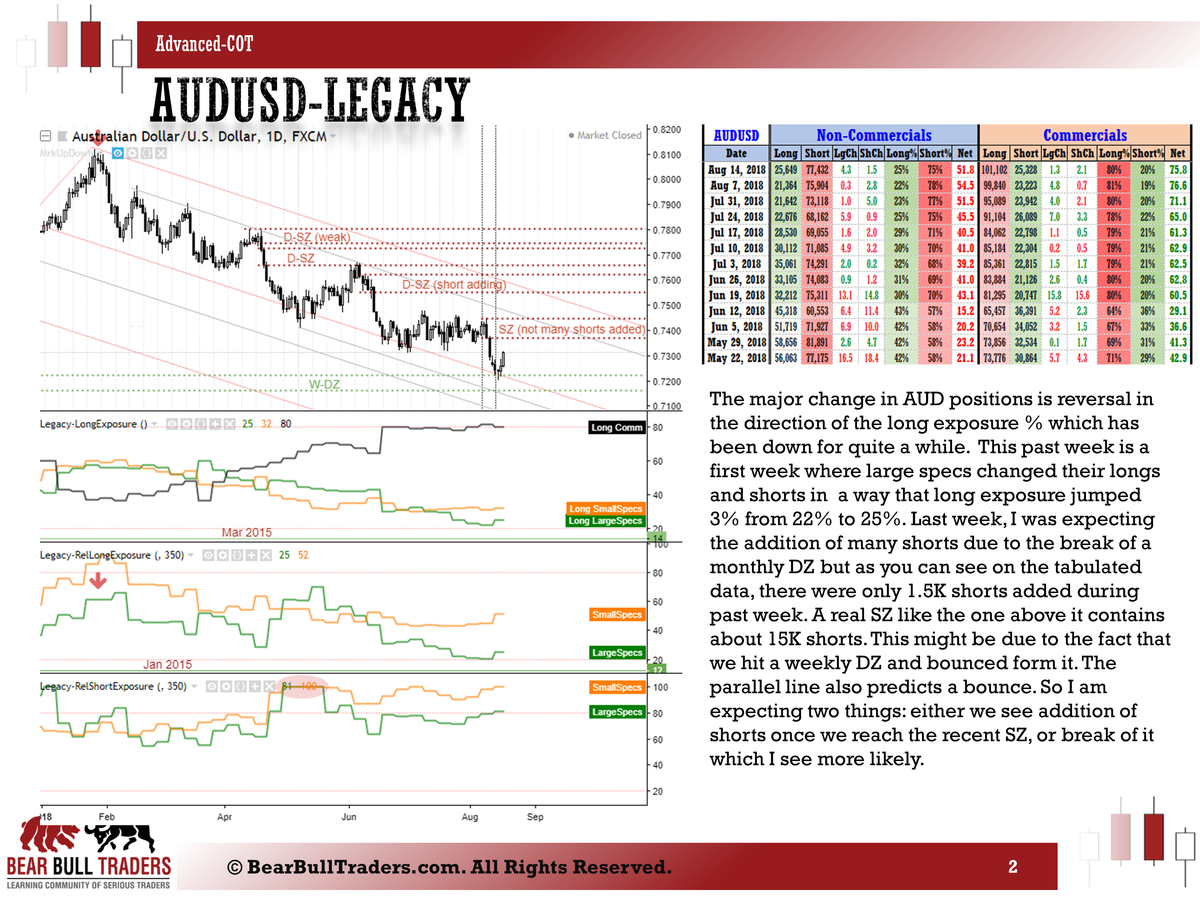
NZD traders don't show significant changes but AUD longs increased so that the long exposure jumped 3%.
CAD keeps showing the strength in continuation of last week.
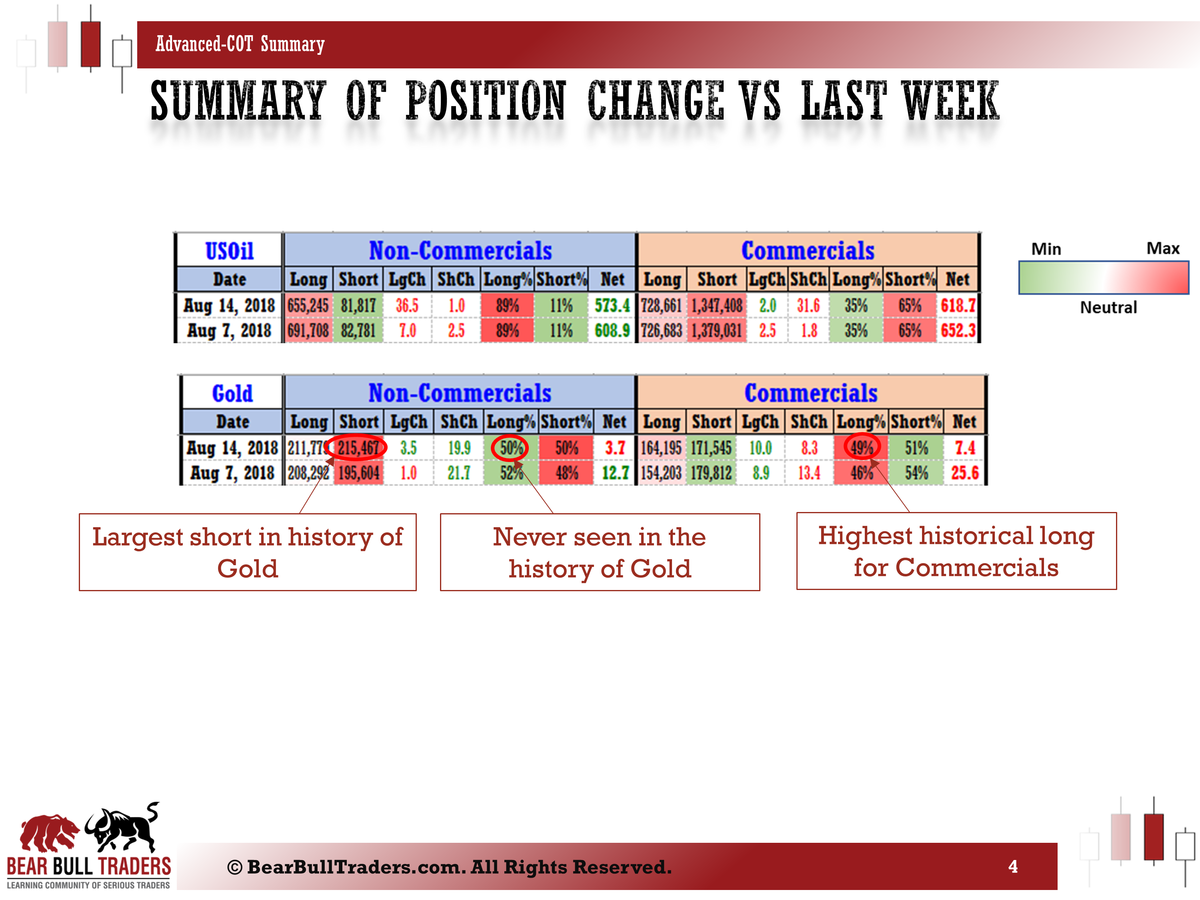
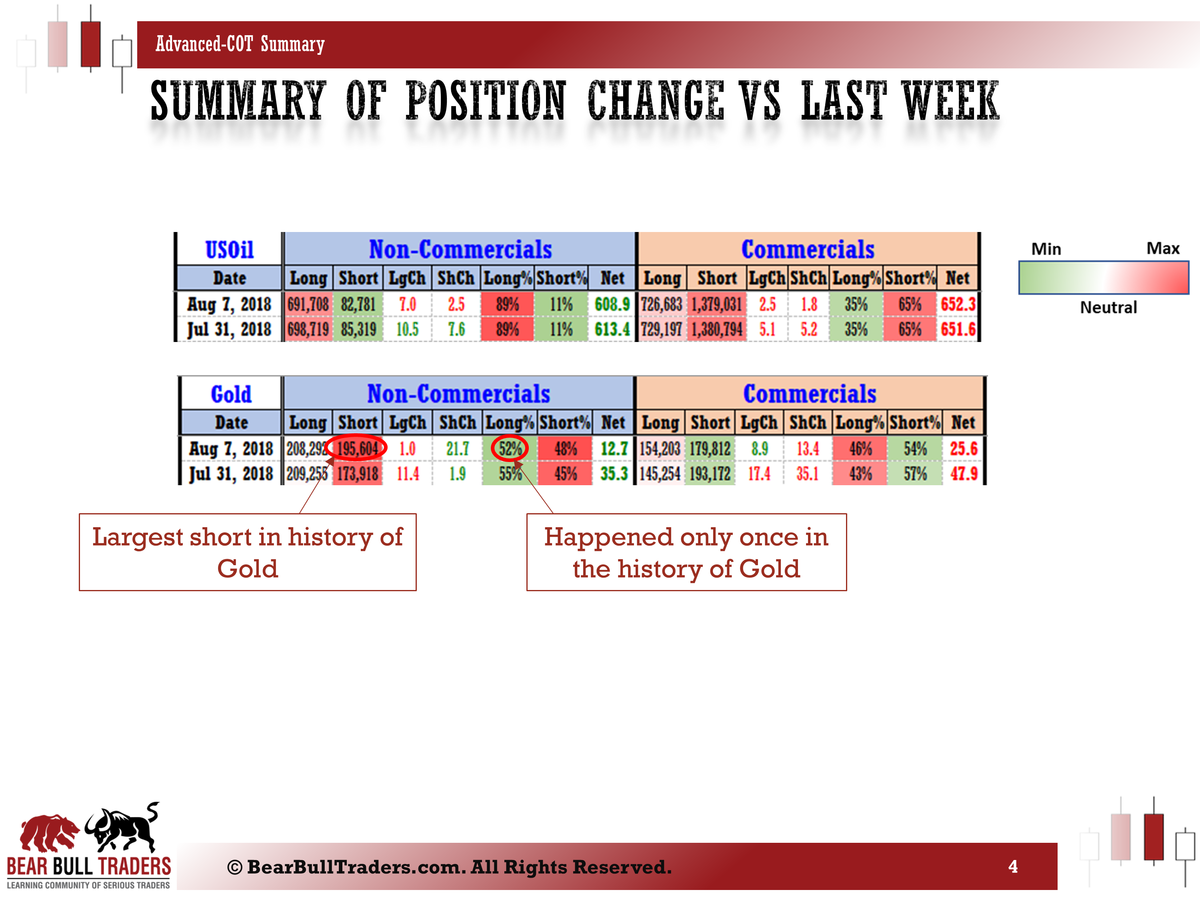
Again, Gold saw the most important change,. This is the first time in history of COT reports (at least as far as I my data goes, that is since 2007) that Large Speculators are Net short and long exposure is just below 50%. Another important factor is the Commercials long exposure which has been capped to 49% for as far as the data goes. Note that the data comes from the end of Tuesday and the reversal might have already started judging by the price action since Thursday.
For more information on this type of analysis check out the previous posts in the education section of the forum here, here, and there.
If you want to discuss further and clarify things, please send me a message to [email protected]
Zack
-
EUR shorts are their highest level over the past year and Large Speculators are now Net Short for the first time since May 2017.
NZD traders don't show significant changes but AUD longs increased so that the long exposure jumped 3%.
CAD keeps showing the strength in continuation of last week.
Again, Gold saw the most important change,. This is the first time in history of COT reports (at least as far as I my data goes, that is since 2007) that Large Speculators are Net short and long exposure is just below 50%. Another important factor is the Commercials long exposure which has been capped to 49% for as far as the data goes. Note that the data comes from the end of Tuesday and the reversal might have already started judging by the price action since Thursday.
For more information on this type of analysis check out the previous posts in the education section of the forum here, here, and there.
Create a FREE account to get access to all previous weekly analysis and educational materials using the registration form found in this page.
If you want to discuss further and clarify things, please send me a message to [email protected]
Zack
-
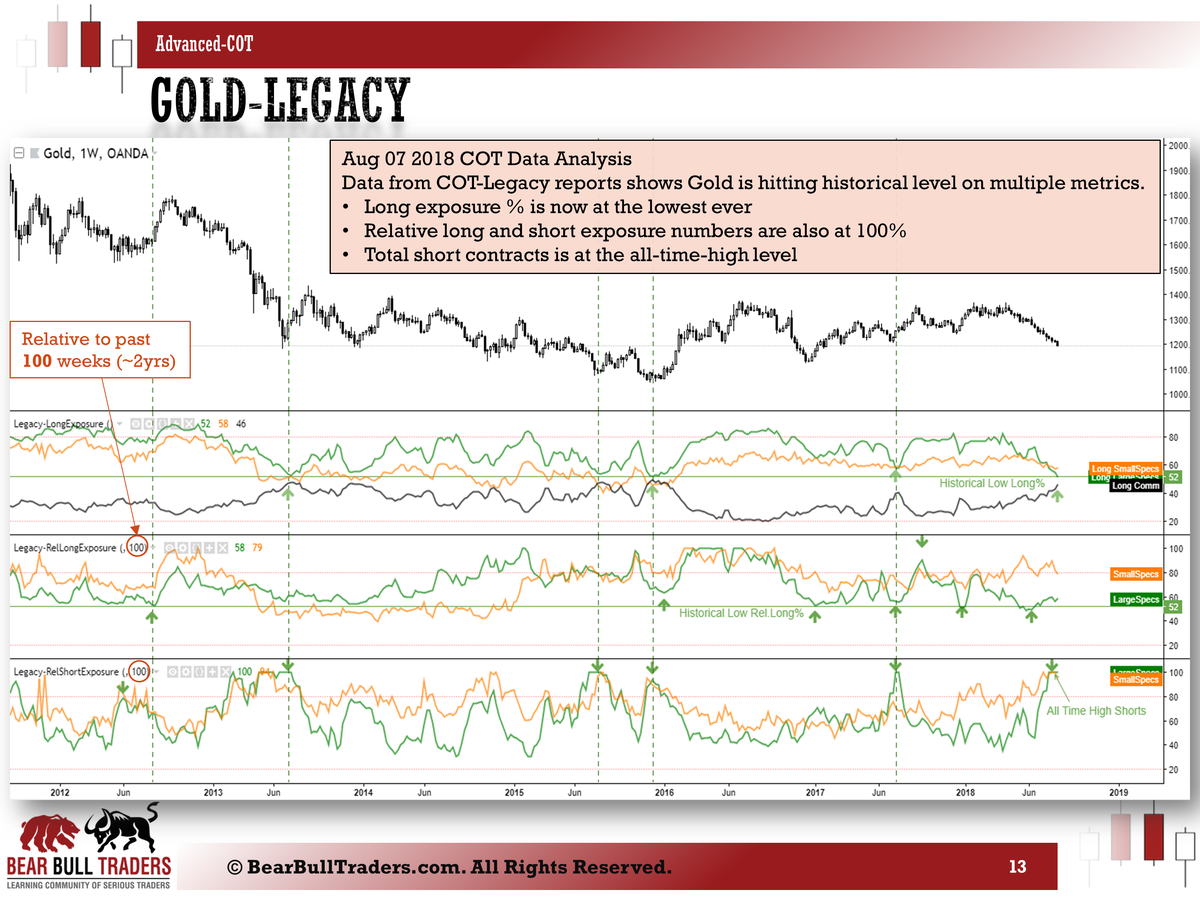
Aug 07 2018 COT Data Analysis
Data analysis of the COT reports (Legacy, Disaggregated) shows Gold is hitting many extreme levels. Here is the charts with COT data overlays.
Summary:
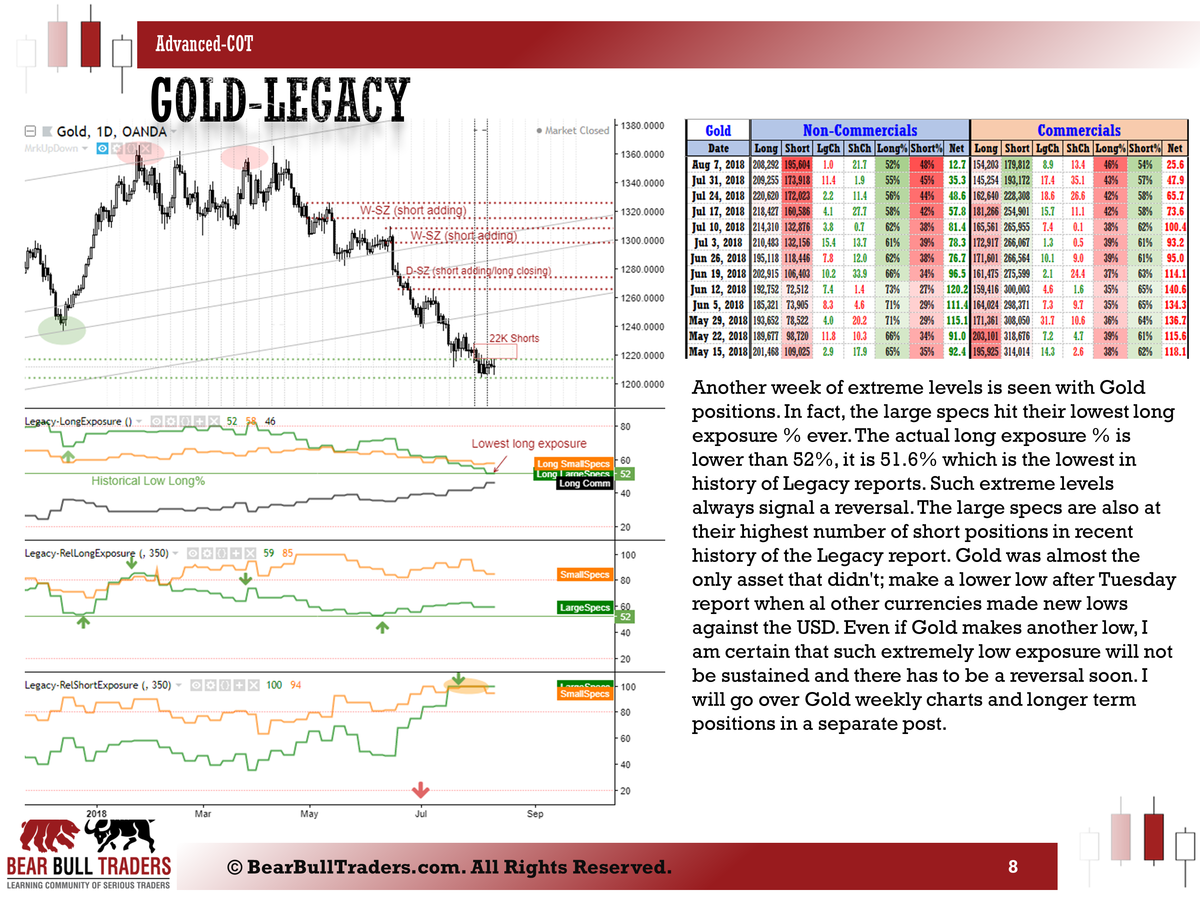
Data from COT-Legacy reports shows Gold is hitting historical level on multiple metrics.- Long exposure % is now at the lowest ever
- Relative long and short exposure numbers are also at 100%
- Total short contracts is at the all-time-high level
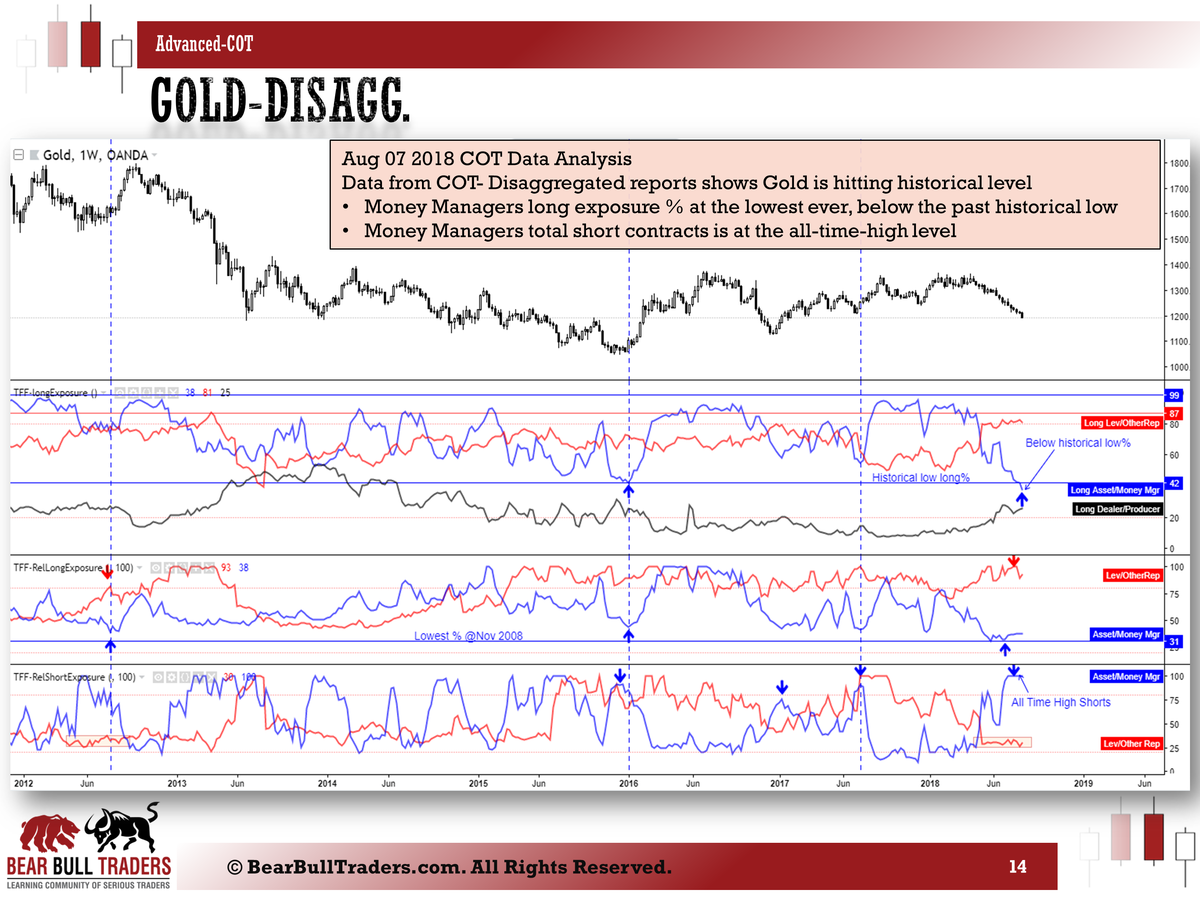
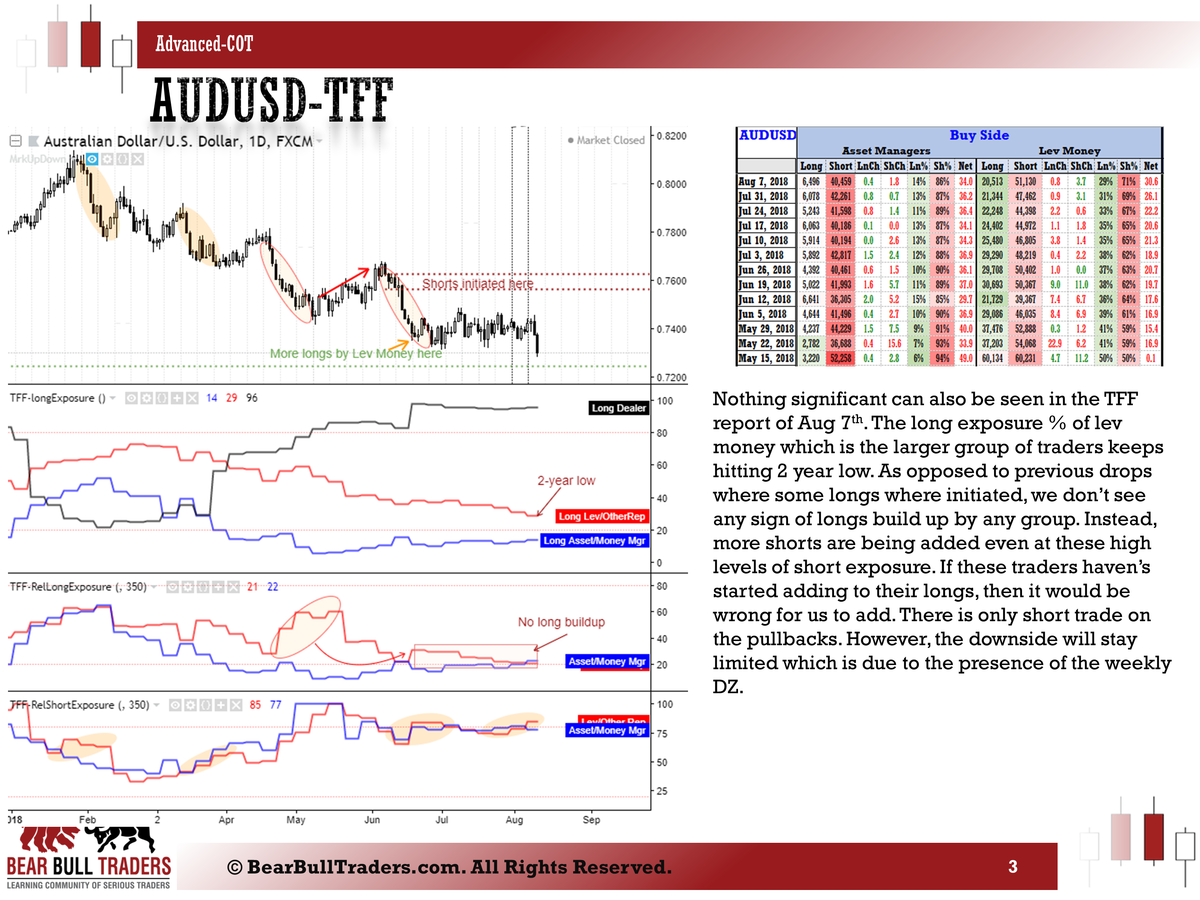
Data from COT- Disaggregated reports shows Gold is hitting historical level
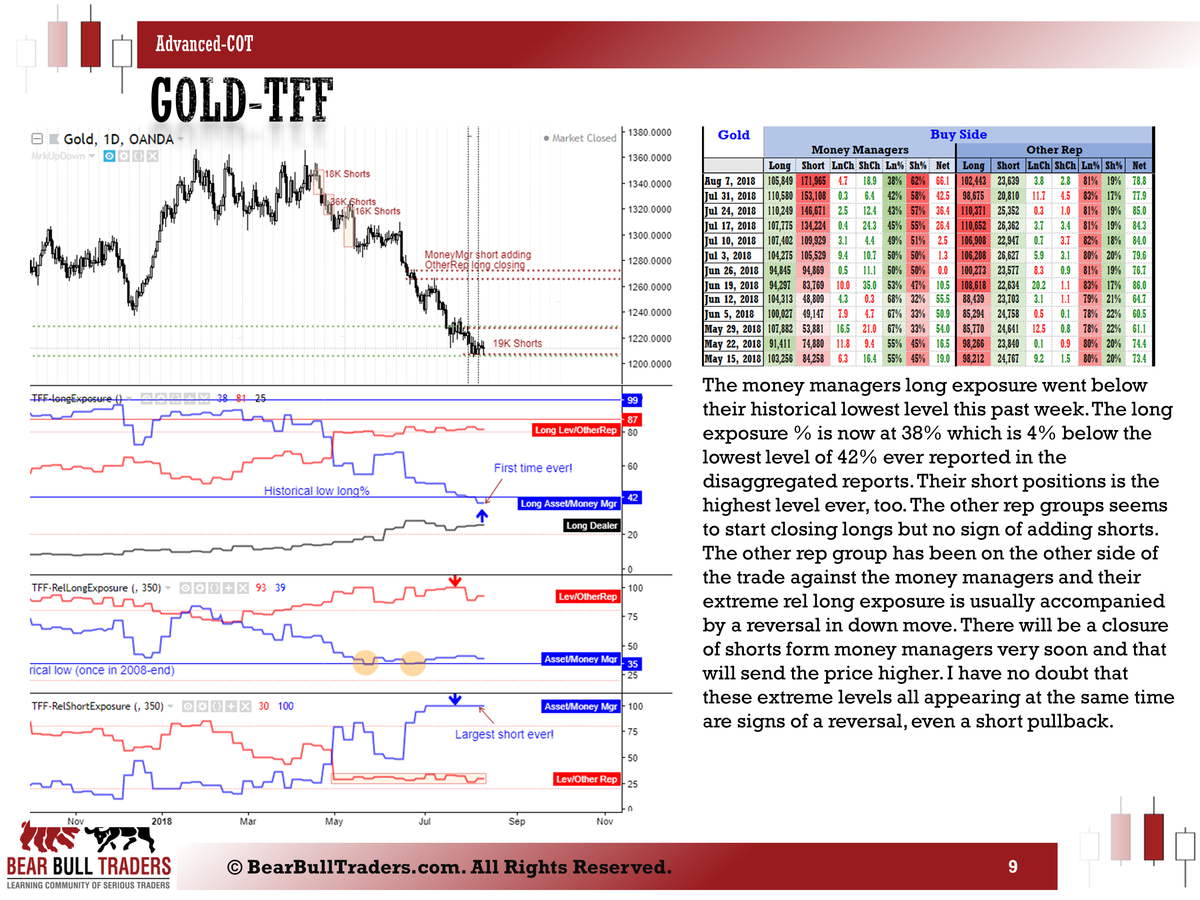
- Money Managers long exposure % at the lowest ever, below the past historical low
- Money Managers total short contracts is at the all-time-high level
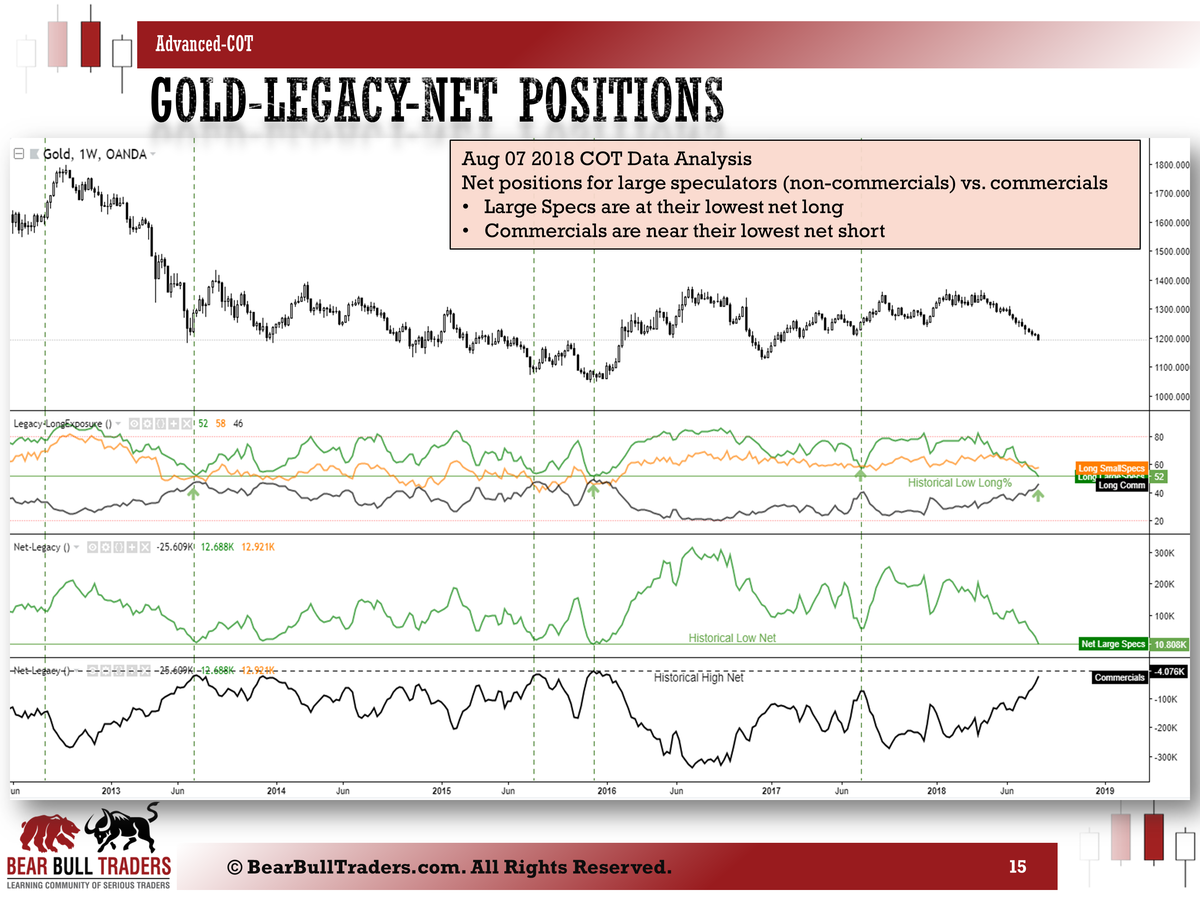
Net positions for large speculators (non-commercials) vs. commercials
- Large Specs are at their lowest net long
- Commercials are near their lowest net short
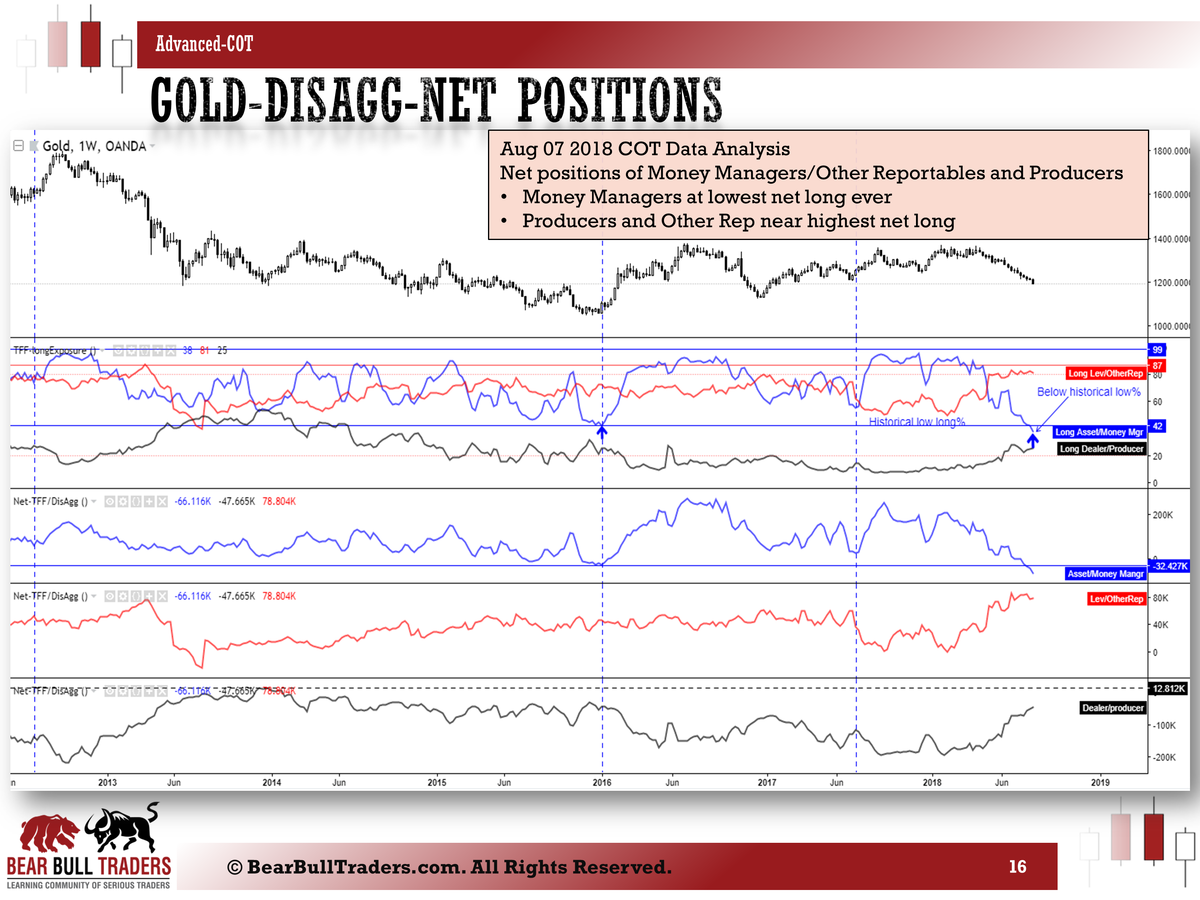
Net positions of Money Managers/Other Reportables and Producers
- Money Managers at lowest net long ever
- Producers and Other Rep near highest net long
Conclusion: there will be a reversal coming very soon.
For more information on this type of analysis check out the previous posts in the education section of the forum here, here, and there.
Create a FREE account to get access to all previous weekly analysis and educational materials using the registration form found in this page.
If you want to discuss further and clarify things, please send me a message to [email protected]
Zack
-
Aug 07 2018 COT Data Analysis
Data analysis of the COT reports (Legacy, Disaggregated) shows Gold is hitting many extreme levels. Here is the charts with COT data overlays.
Summary:
Data from COT-Legacy reports shows Gold is hitting historical level on multiple metrics.- Long exposure % is now at the lowest ever
- Relative long and short exposure numbers are also at 100%
- Total short contracts is at the all-time-high level
Data from COT- Disaggregated reports shows Gold is hitting historical level
- Money Managers long exposure % at the lowest ever, below the past historical low
- Money Managers total short contracts is at the all-time-high level
Net positions for large speculators (non-commercials) vs. commercials
- Large Specs are at their lowest net long
- Commercials are near their lowest net short
Net positions of Money Managers/Other Reportables and Producers
- Money Managers at lowest net long ever
- Producers and Other Rep near highest net long
Conclusion: there will be a reversal coming very soon.
For more information on this type of analysis check out the previous posts in the education section of the forum here, here, and there.
If you want to discuss further and clarify things, please send me a message to [email protected]
Zack
-
Here are some possible trades based on the COT reports of August 7th, 2018. The trades are based on some lower timeframes for short term profits. The big picture trades are setting up in the bigger timeframes and what I explained in the COT analysis posted here.
For more information on this type of analysis check out the previous posts in the education section of the forum here, here, and there.
If you want to discuss further and clarify things, please send me a message to [email protected]
Zack
-
Here is a snapshot of the weekly analysis based on July 7th, 2018 COT (Legacy, Traders in Financial Futures) reports.
More trade updates will come in the following post.
For more information on this type of analysis check out the previous posts in the education section of the forum here, here, and there.
If you want to discuss further and clarify things, please send me a message to [email protected]
Zack
-
Another week of EUR and GBP selling. EUR shorts are their highest level over the past year.
AUD and NZD don't show significant changes but wait until the next week data, because the real change happened after Tuesday!
CAD shows some strength and now USDCAD shorts are starting to build up.
Biggest change is in the GOLD. Now we reached a historical long exposure % almost never seen before. And that is due to the largest short position EVER, by non-commercial traders. And these extreme levels do not sustain for very long. Reversal is coming.
For more information on this type of analysis check out the previous posts in the education section of the forum here, here, and there.
Create a FREE account to get access to all previous weekly analysis and educational materials using the registration form found in this page.
If you want to discuss further and clarify things, please send me a message to [email protected]
Zack
-
Another week of EUR and GBP selling. EUR shorts are their highest level over the past year.
AUD and NZD don't show significant changes but wait until the next week data, because the real change happened after Tuesday!
CAD shows some strength and now USDCAD shorts are starting to build up.
Biggest change is in the GOLD. Now we reached a historical long exposure % almost never seen before. And that is due to the largest short position EVER, by non-commercial traders. And these extreme levels do not sustain for very long. Reversal is coming.
For more information on this type of analysis check out the previous posts in the education section of the forum here, here, and there.
If you want to discuss further and clarify things, please send me a message to [email protected]
Zack
-
Here are some possible trades based on the COT reports of July 31st, 2018. The trades are based on some lower timeframes for short term profits. The big picture trades are setting up in the bigger timeframes and what I explained in the COT analysis posted here.
For more information on this type of analysis check out the previous posts in the education section of the forum here, here, and there.
If you want to discuss further and clarify things, please send me a message to [email protected]
Zack


FX Weekly Analysis based on September-04-2018 COT Reports
in Forex Trade Ideas
Posted
Here is a snapshot of the weekly analysis based on September 4th, 2018 COT (Legacy, Traders in Financial Futures) reports.
More trade updates will come in the following post.
For more information on this type of analysis check out the previous posts in the education section of the forum here, here, and there.
If you want to discuss further and clarify things, please send me a message to [email protected]
Zack