

Zack Zarr
-
Content Count
128 -
Joined
-
Last visited
-
Days Won
1
Posts posted by Zack Zarr
-
-
By now, everyone is most likely aware of the big rally Gold had last week to break the $1400 level and highest level in the past six year!
And that is exactly what happens when a commodity price or a currency pair breaks our/down from a multi-year range. These events are generally indication of big macroeconomic event coming ahead. People talk about things like stock market top (every one putting their money into safe assets like Gold), Fed starting to cut rates, etc. Generally, there are two sides of to a story that people choose to believe in. The Headlines vs. the Data! This post summarizes my view on the current state of Gold price and what seems to be a statistically viable scenario.
The Headlines
As mentioned, every finance new outlet, and blog is talking about the great bullish action that is happening for Gold. There are clear evidence of governments and central banks piling up Gold in their reserves. See links such as this one and this one talking about how Russia and China have been stocking Gold for the past few years. Similar news can be found for other central banks around the world. so there is a clear evidence that Gold has been on demand for quite a while. But, is it clear that these giant entities keep piling up Gold at these current prices?
Also, in almost all cases, the top headlines are generated by the big investment banks who have been already long on Gold way before and it is time for them to take some profit on those longs. I accept the fact that there is a case for Gold bullishness but buying it at the current level is just too risky. As someone who has been long on Gold since $1195 (see my posts here and here), I am now thinking of taking profit on the last few long trades I had left on Gold and adding shorts.
Fundamental Data
It has been somewhat understood that whenever the Fed starts cutting rates, Gold has a bullish reaction. The chart below shows examples of the past decade. And we know that the Fed has already stated their intention to cut rates and the dot plot shows the potential for two rate cuts this year.

So from the correlation between the interest rates and Gold price, we should expect more bullish action in Gold. But, I'd still argue that the recent rally in Gold was some sort of a response to the news of Fed cutting rates. So some impact of the rate cut is already priced in the Gold price. Plus the fact that the next rate announcement is in almost three weeks. I expect a retracement in Gold price.
COT Data
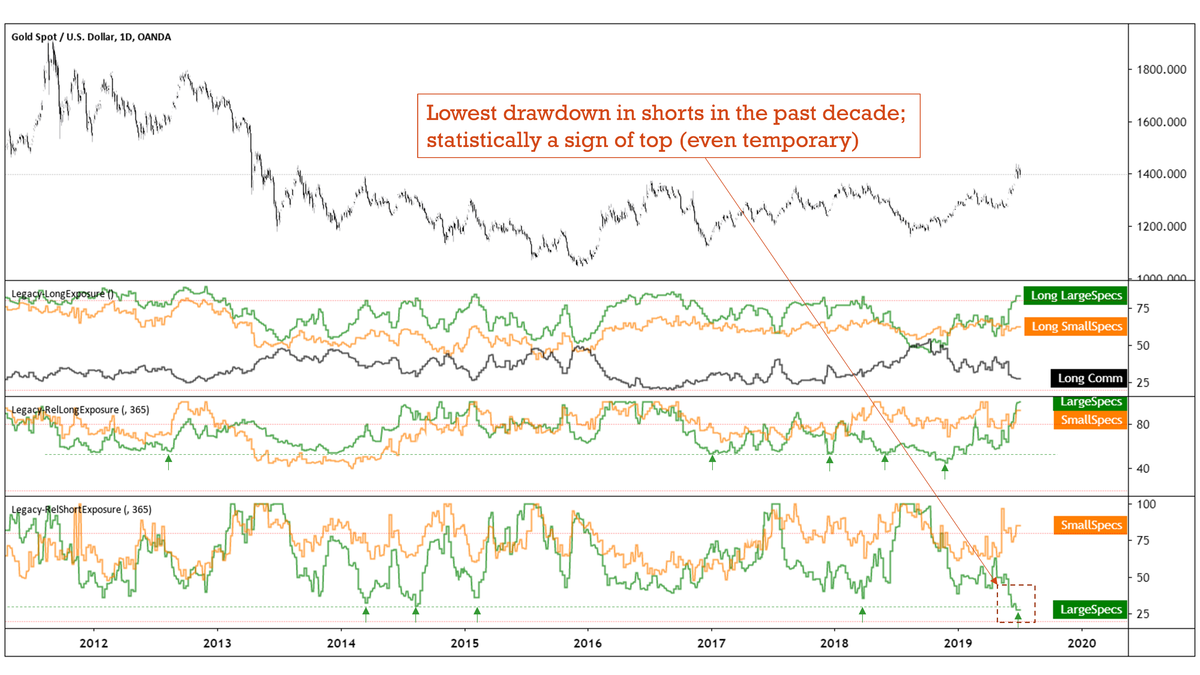
As you all know, I am a big fan of the COT data and the actions of the large speculators. Looking at the past history of these traders' action in a graphical representation is a good way of predicting their thought process. The chart below shows the long and short positioning of the large speculators (non-commercials) vs. commercial institutions. The two graphs at the bottom are simply the relative percentage of current long/short contracts over the preceding year (for more detailed information, please see this A Deep Dive into Commitment of Traders Data Analysis).
Over the past decade, the large specs reduced their shorts down to 30% of the maximum amount in the past year which always coincides with the price topping. Based on the COT data of June 25th (now recent data released due to holidays), their shorts has reduced down to 28% while their longs is the highest level in the past year. In other word, they are extremely long with not much short positions to hedge against any drop. That is a tough position to be and very fragile.
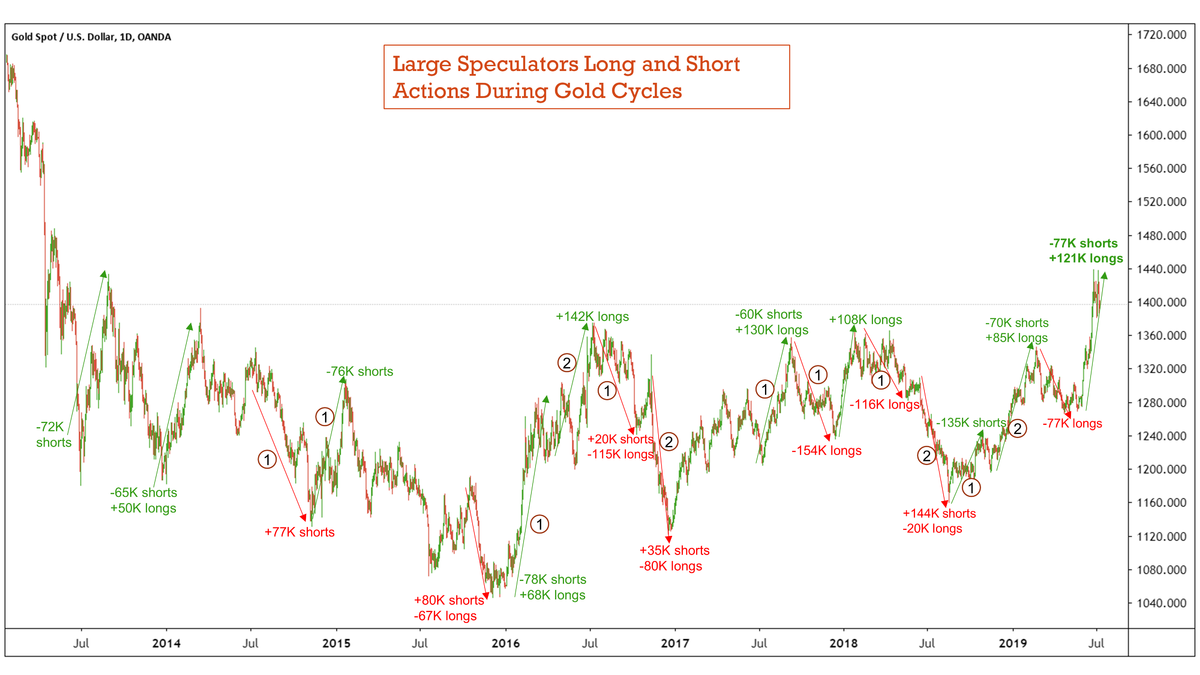
Looking at the change in the sum of longs and short positions during the price drops and rallies indicates a typical single stage or two-stage behavior.
In a two-stage behavior, the large specs usually reduce their initial positions before adding to the opposite trade. For ex. the rally in price in the beginning of 2016 shows the initial closure of 78K shorts and adding 68K longs while the second stage shows significant long adding of 142K contacts. In the next price drop following that rally, the initial stage consists of mostly profit taking on longs while the 2nd stage has more short adding.
In single-stage scenario, they usually add a large amount of either longs or shorts and they immediately close equivalent number of same trades in the following price drop/rally. The current positioning of the large specs seems to a of one-stage type. They have added a significant amount of longs while closing more shorts on the way up. There is not much shorts left for them to hedge against the next drop and that means they have to close many longs. So the price could linger in the current levels for a while for them to build some shorts and reduce their long exposure. That could easily take up to the next Fed announcement. Either way, adding such a large amount of longs over only a month seems a very risky to me. They will take advantage of any price rally to reduce those longs. Regardless of how careful they are, closing those large longs will create a drop in price.
Please comment below you questions and feedback.
Cheers,
Zack
-
Watched it when it came out. Good overall, but not as impressive as the others like Big Short, or Billions. I was expecting more technical terms but I guess I was over-expecting!
Good movie overall!
Cheers,
Zack
-
Please start a new post here on the forum with your thoughts and question on particular pair, and I will do my best to post my analysis shortly after the pair in question.
I hope that works for you and all other members.
Thanks,
Zack
-
This post is the response to questions originally asked by a member (EURUSD Trade Setup/Analysis)
Thank you for this question.
Here is my analysis from the long term and short term point of view on EURUSD:
Long Term
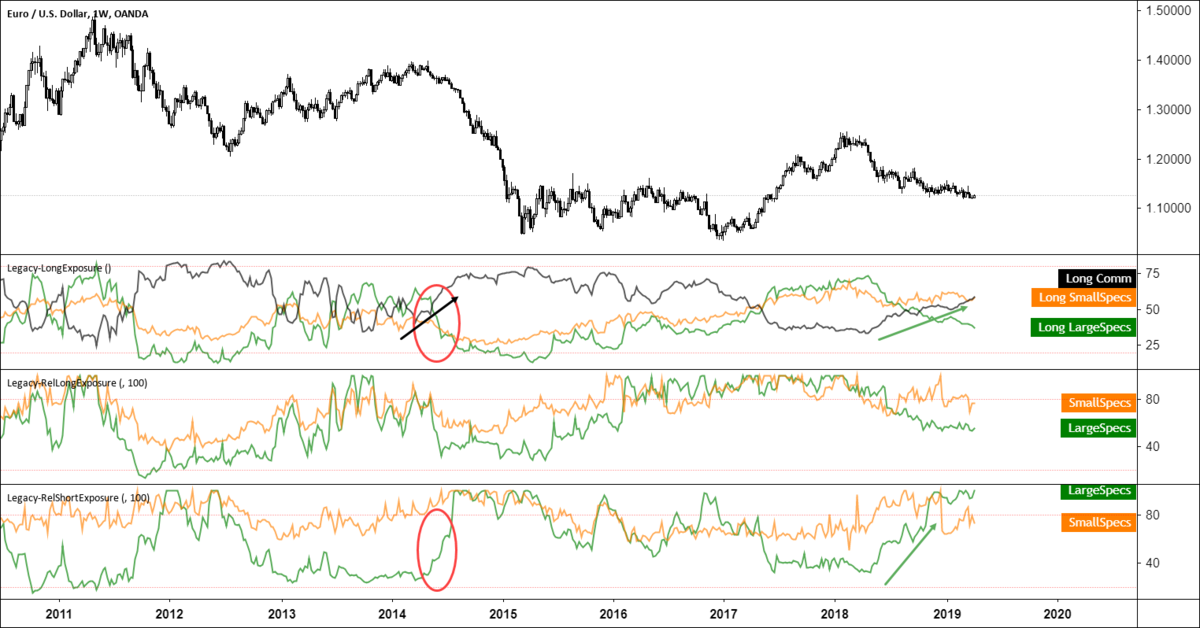
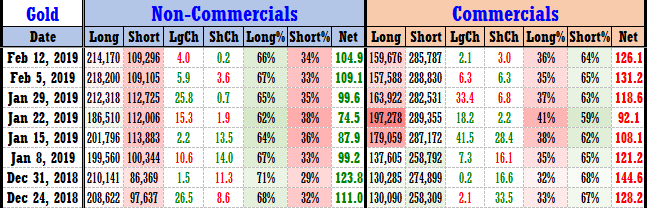
Looking at the weekly chart of EU and the positioning of the large speculators and their counterpart, the commercials, it seems that everyone is bearish on EUR. See chart below with some annotation.
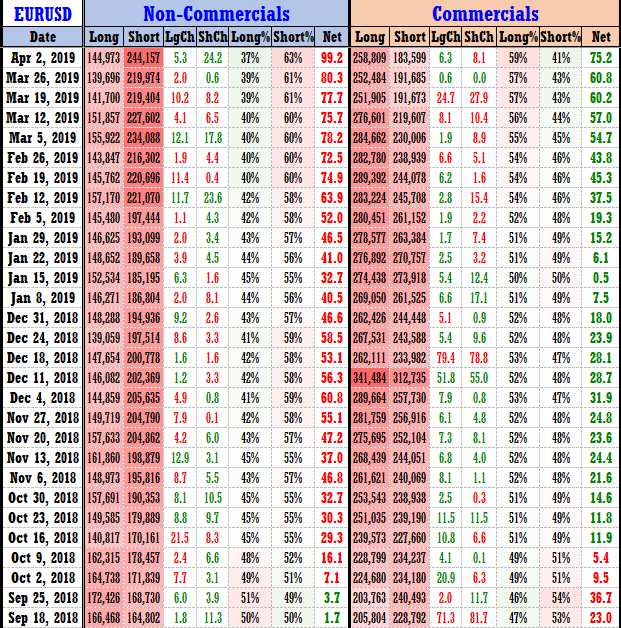
The short positioning of the large specs as well as the long positioning of the commercials looks very similar to the time prior the sharp drop in EUR back in early-mid 2014. One important factor to pay attention to is the number of shorts that large specs possess at the moment which is almost near the past 2 year high. The color coding of the tabulated data also suggest the same thing (see below)
It will take quite some time for these short to get closed and until that time, it is very unlikely that wee see any sharp jump in EURUSD.
Short Term
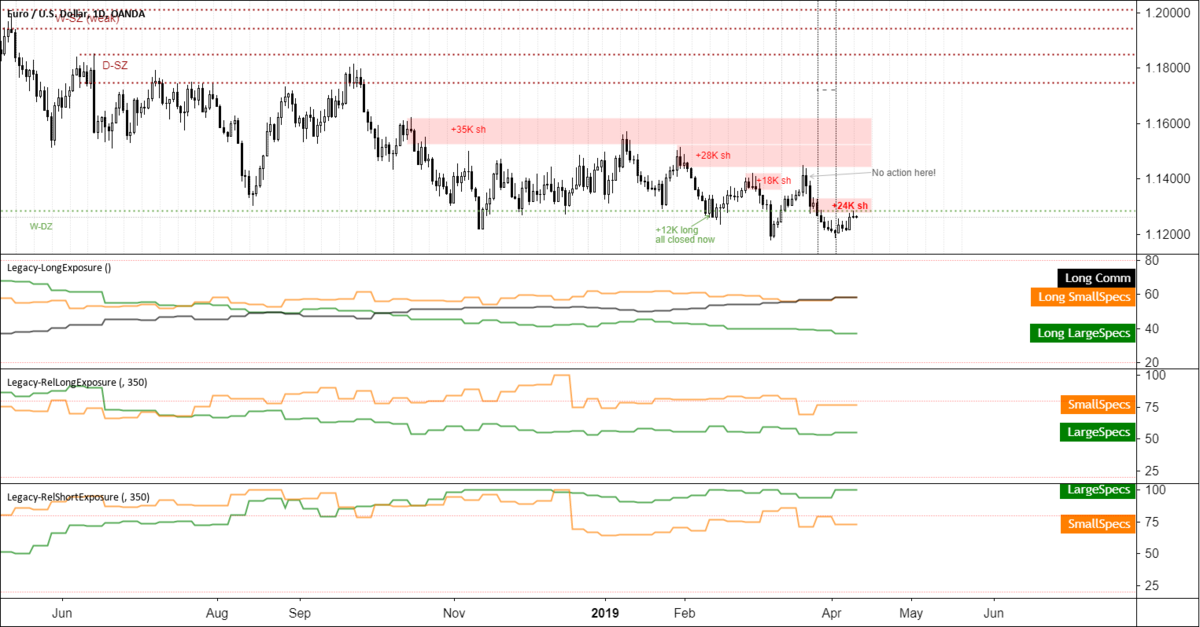
The daily chart of EU shows some interesting actions which can help she some light in the price action in recent weeks.
The main positioning activity has been to add shorts very slowly since fall 2018. Almost every bullish positioning has been short lived. The major point in recent weeks has been the fact that the high point and drop near 1.14 on March-end was not caused by any major change in positioning size. hence, that area does not have much significance in terms of supply (as shown on the chart).
The major short adding activity happened last week where large specs added 24K shorts. In my opinion, that zone has more significance than the upper area (which is where Vinod has his SZ).
Based on these recent positioning of large specs, below is some possible trade ideas for EU.
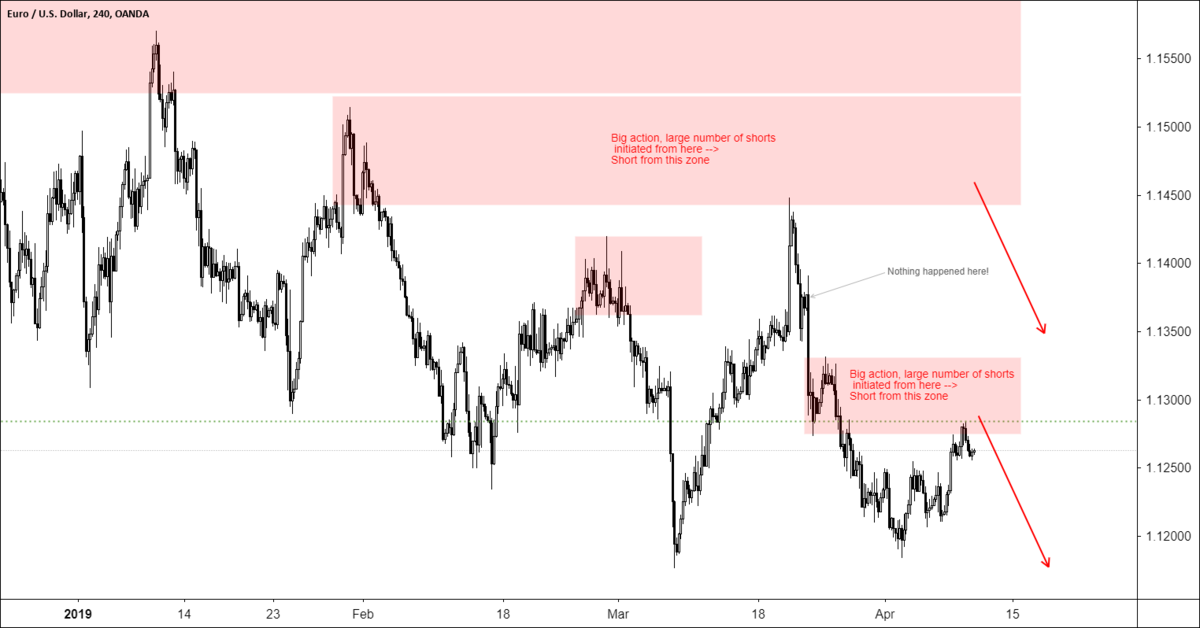
Trade Ideas
The 4H chart of EU is used to draw some SZs where some short trades can be taken. I hope the explanations above clarify the reasoning of taking these short trades.
The price is currently at the SZ which initiated 24K shorts. Other shorting opportunity comes when price reaches to the upper SZ where lots of shorts started there.
Thank you for the question and Good Luck,
Let me know if you need more clarification.
Zack
-
Thank you for this question Vinod.
Here is my analysis from the long term and short term point of view on EURUSD:
Long Term
Looking at the weekly chart of EU and the positioning of the large speculators and their counterpart, the commercials, it seems that everyone is bearish on EUR. See chart below with some annotation.
The short positioning of the large specs as well as the long positioning of the commercials looks very similar to the time prior the sharp drop in EUR back in early-mid 2014. One important factor to pay attention to is the number of shorts that large specs possess at the moment which is almost near the past 2 year high. The color coding of the tabulated data also suggest the same thing (see below)
It will take quite some time for these short to get closed and until that time, it is very unlikely that wee see any sharp jump in EURUSD.
Short Term
The daily chart of EU shows some interesting actions which can help she some light in the price action in recent weeks.
The main positioning activity has been to add shorts very slowly since fall 2018. Almost every bullish positioning has been short lived. The major point in recent weeks has been the fact that the high point and drop near 1.14 on March-end was not caused by any major change in positioning size. hence, that area does not have much significance in terms of supply (as shown on the chart).
The major short adding activity happened last week where large specs added 24K shorts. In my opinion, that zone has more significance than the upper area (which is where Vinod has his SZ).
Based on these recent positioning of large specs, below is some possible trade ideas for EU.
Trade Ideas
The 4H chart of EU is used to draw some SZs where some short trades can be taken. I hope the explanations above clarify the reasoning of taking these short trades.
The price is currently at the SZ which initiated 24K shorts. Other shorting opportunity comes when price reaches to the upper SZ where lots of shorts started there.
Thank you for the question and Good Luck,
Let me know if you need more clarification.
Zack
-
Hi Vinod,
I will send the analysis shortly.
Thanks,
Zack
-
UPDATE (Feb 26, 2019 | 10:30 PM EST)
The COT data form Feb 5th and 12th were released since last update, but not much change has happened in longs and shorts.
There has been a back and forth action in longs and shorts form non-commercials (large speculators) without any clear intention. Interesting is to see that those 26K shorts added near 1290 level were still open until Feb 12th (the latest COT release). I am still wondering if the last jump in price was caused by forced closure of those shorts, or it was only adding more longs. We'll find out by the end of next week.
Zack
-
UPDATE (Feb 26, 2019 | 10PM EST)
AUD has not shown much movement since last time I showed the COT data. Until Feb 12 (the latest COT report release), the large speculators have been moving long and short position back and forth without any consistent direction.
They started adding some longs before the year end, but the giant drop after the new year caused some of those longs to be closed while some shorts were added. But eventually those shorts were also closed.
The price reacted to the pullback in a manner which I expected but hasn't moved much since then.
This inactivity is mostly due to the continuous weakness in AUD data and China trade concerns. For the time being, I still have part of my longs open with SL (stop loss) close to BE (break even) near 0.7
Will update this as we see the Feb 19 and 26 COT data.
Zack
-
No worries, there is always plenty of time to enter a trade. Sorry for the abbreviation; moving SL to BE == moving stop loss to break even to protect your initial capital.
Let me know if you have any questions and feedback on the book.
Zack
-
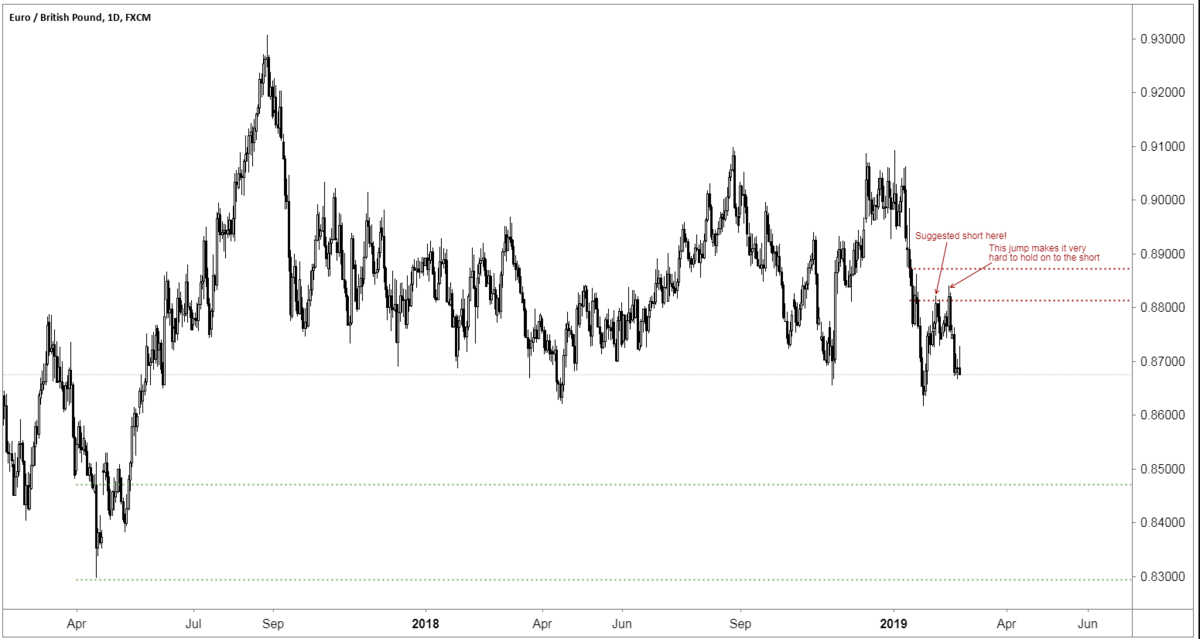
I hope you got some short off that 0.88 zone, I know it wasn't an easy short to hold on to because the price jumped one more time before going down:
Now waiting to see if the broken support at 0.863 finally breaks down. Moving SL to BE would be a great idea now, plus taking some partial profit.
Good luck,
Zack
-
UPDATE:
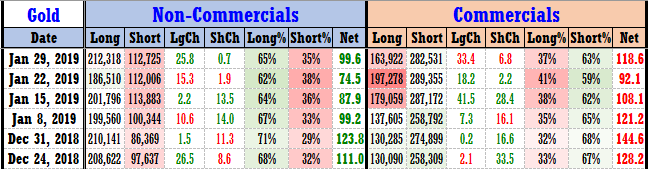
Gold traders showed some large activities on their long and shorts over the last weeks of January based on most recent COT data.
The chart shows it in a more clear way how the Large Speculators tried to take some profit from their longs while adding significant shorts
Over the first few weeks of 2019, these traders took profit on 23K of their longs while adding 26K shorts. But as you can see, their shorts ended up in loss when the price jumped even higher on the week of Jan 29th when they again added 26K more longs.
Interestingly enough, they didn't close those 26K shorts as of Jan 29th. It would be interesting to see if the recent jump was caused by closing all those shorts or they actually added more longs again!
For the time being, I still have my longs open since last Oct as I mentioned in this post (https://forums.bearbulltraders.com/topic/752-fx-weekly-technical-analysis-and-trade-setups-based-on-october-09-2018-cot-reports/).
I know that a downturn/ or some partial bearishness is coming. But I need to see some signs of serious bearishness on COT data (which is still delayed by three weeks due to government shutdown) before changing my mind on the Gold bullish action.
Zack
-
UPDATE:
Gold traders showed some large activities on their long and shorts over the last weeks of January based on most recent COT data.
The chart shows it in a more clear way how the Large Speculators tried to take some profit from their longs while adding significant shorts
Over the first few weeks of 2019, these traders took profit on 23K of their longs while adding 26K shorts. But as you can see, their shorts ended up in loss when the price jumped even higher on the week of Jan 29th when they again added 26K more longs.
Interestingly enough, they didn't close those 26K shorts as of Jan 29th. It would be interesting to see if the recent jump was caused by closing all those shorts or they actually added more longs again!
For the time being, I still have my longs open since last Oct as I mentioned in this post (https://forums.bearbulltraders.com/topic/752-fx-weekly-technical-analysis-and-trade-setups-based-on-october-09-2018-cot-reports/).
I know that a downturn/ or some partial bearishness is coming. But I need to see some signs of serious bearishness on COT data (which is still delayed by three weeks due to government shutdown) before changing my mind on the Gold bullish action.
Zack
-
On this post, I will elaborate on my thoughts on the price movement on Gold over the past bearish and current bullish trend. This is a layer-by-layer (or onion-type) approach from the simple price action to much deeper and more educated analysis based on the COT data. As always, your feedback is highly appreciated.
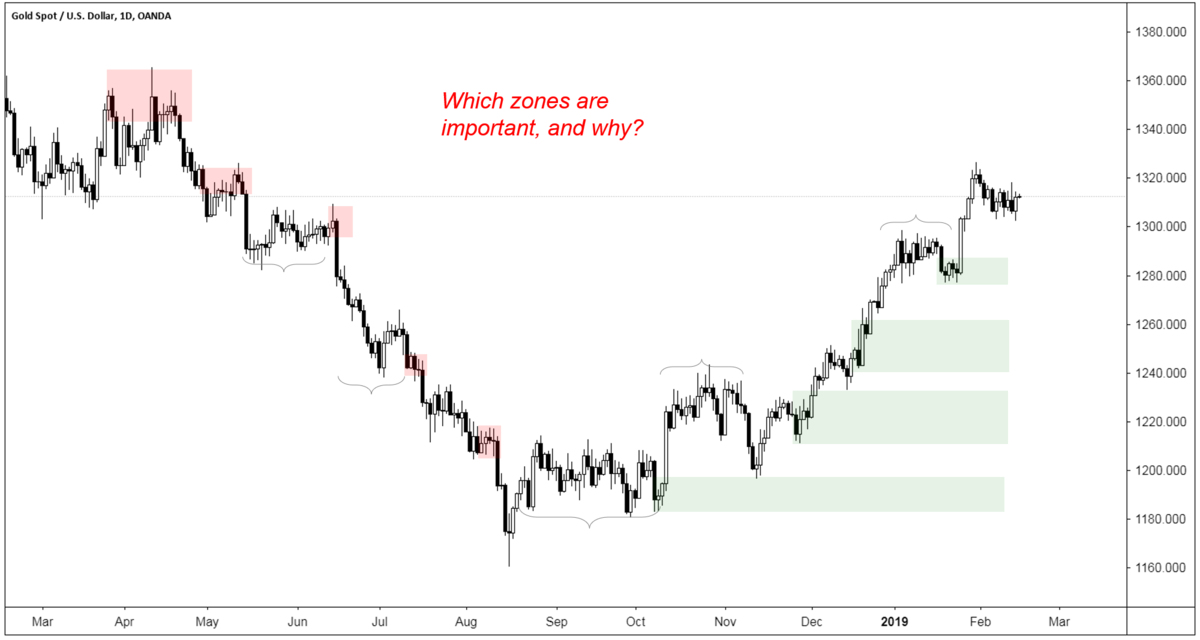
The Gold chart and possible zones
On this simple Gold chart, I highlighted some of the areas which the price has shown strong reaction, either bearish (red boxes), bullish (green boxes) or consolidation type (curly brackets).
As you know, I am a big fan of understanding the Big Players thought process and decisions. So this is a game of me guessing what these players have done in the past. And yes, you can only guess based on this simple chart, nothing more!
It is not too difficult to imagine some Short Adding and Long Closing activity inside the red boxes and Long Adding and Short Closing activity inside the green boxes. I'd suggest you play along this game and make your guesses before looking at the next chart.
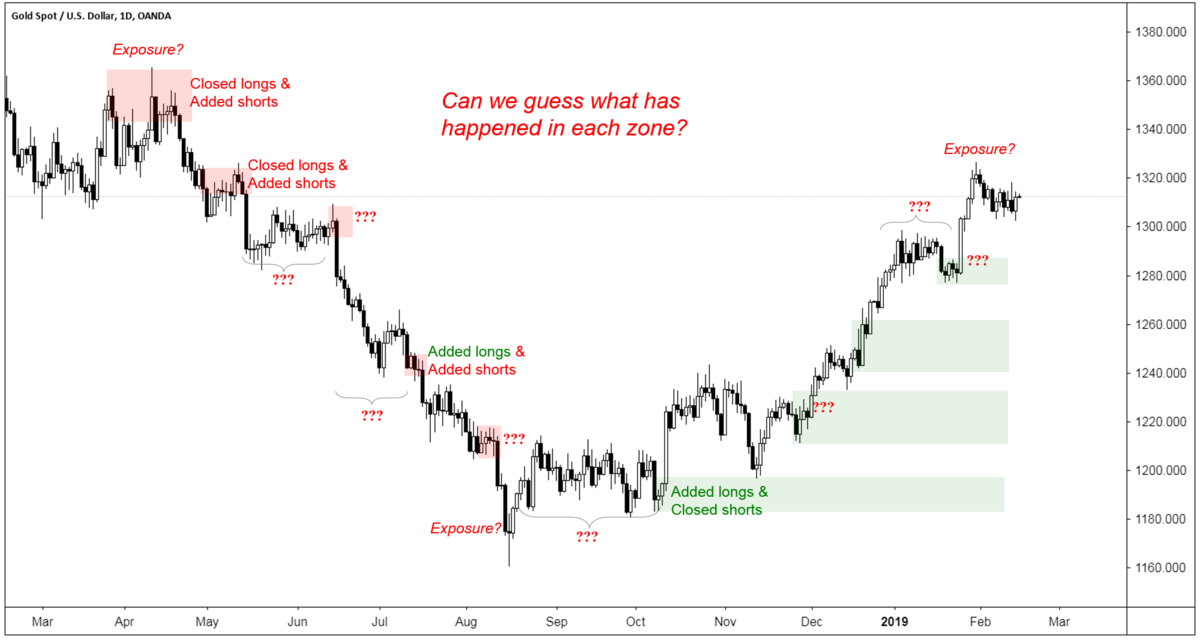
The next chart shows some of these activities.
The notes beside each box are the actual events that occurred based on the COT-legacy reports. If you want to learn more about these reports, I have published some posts on this forum (A Deep Dive into Commitment of Traders Data Analysis, Commitment of Traders Data Analysis- Data Meets the Chart, Commitment of Traders Data Analysis- Part 2)*
*Note: for some of these posts, you need our FREE membership accessible by singing up at the bottom of this page: https://bearbulltraders.com/forex-trading/
Some of these action by the Big Players are intuitive but some are not. In the following sections, the actual numbers based on these COT reports are shown on the chart. You will see how the action of these players affect the price.
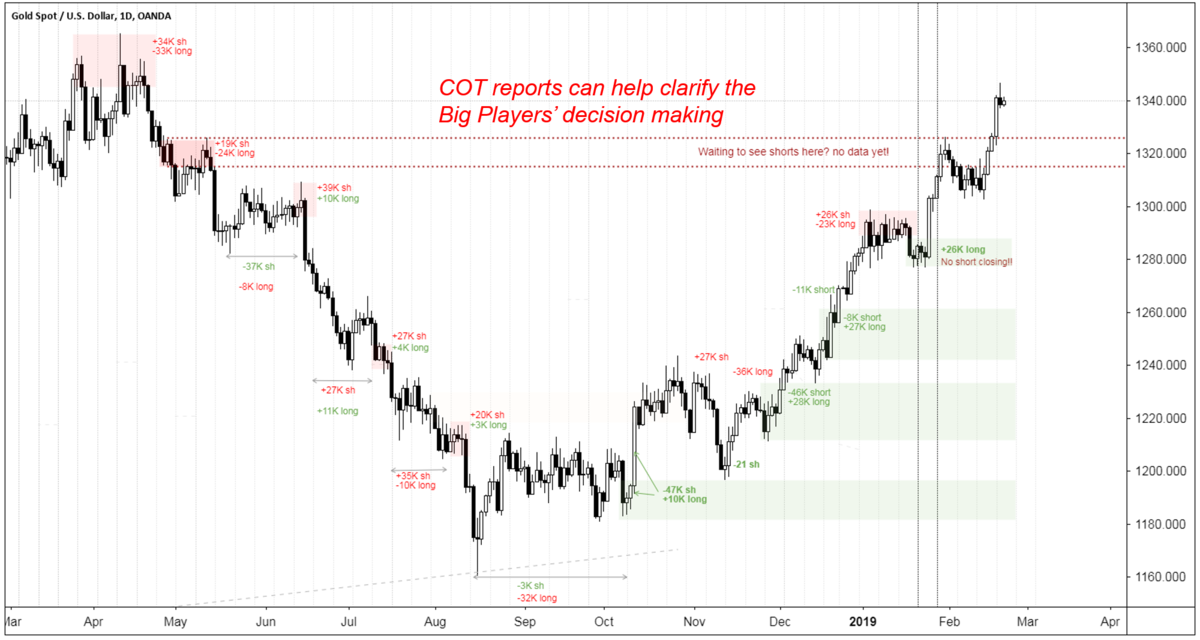
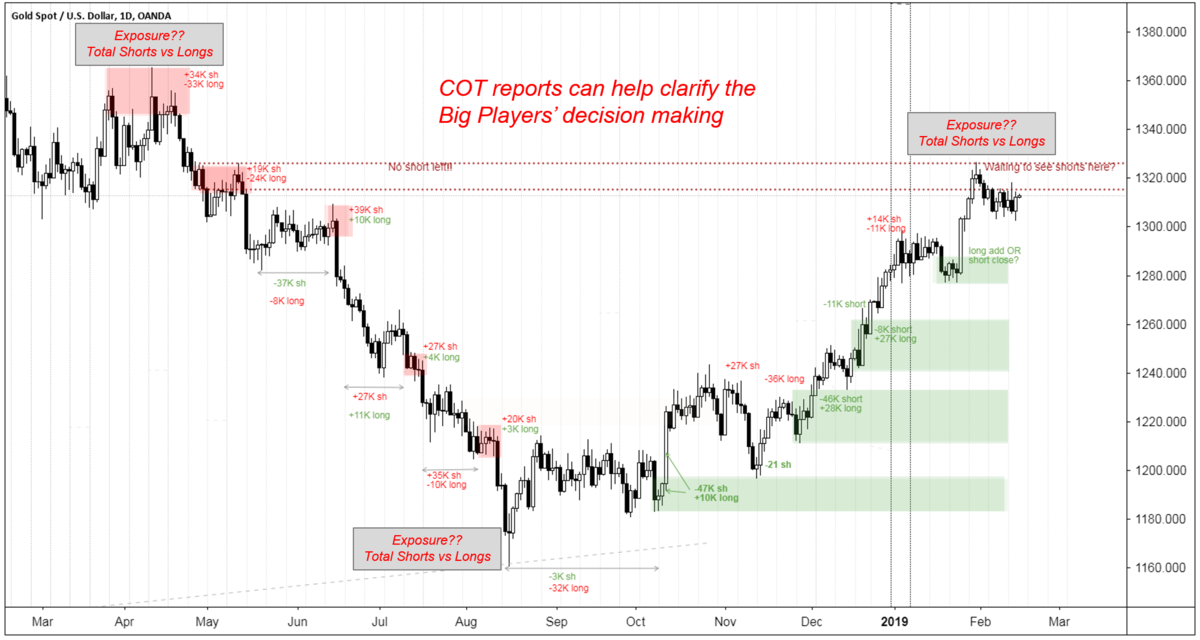
COT-Legacy data and Gold chart
Chart below shows the actual number of Longs and Shorts added and closed by the Large Speculators (Non-commercials on COT report).
I suggest looking at the numbers in each zone and thinking about the implication of Big Players' decisions during the period of each zone.
For instance, you can see what Closing of 24K Longs and Adding 19K Shorts can do to the price if happens in a relatively short period time (see the second red box from the left side of the chart).
Alternatively, these players can take their time in adding and closing their positions which results in a semi-flat (consolidation) type of zone shown by the arrows.
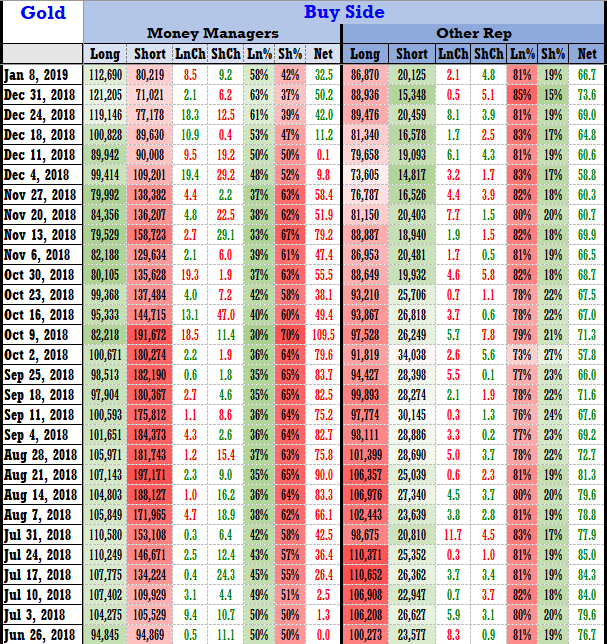
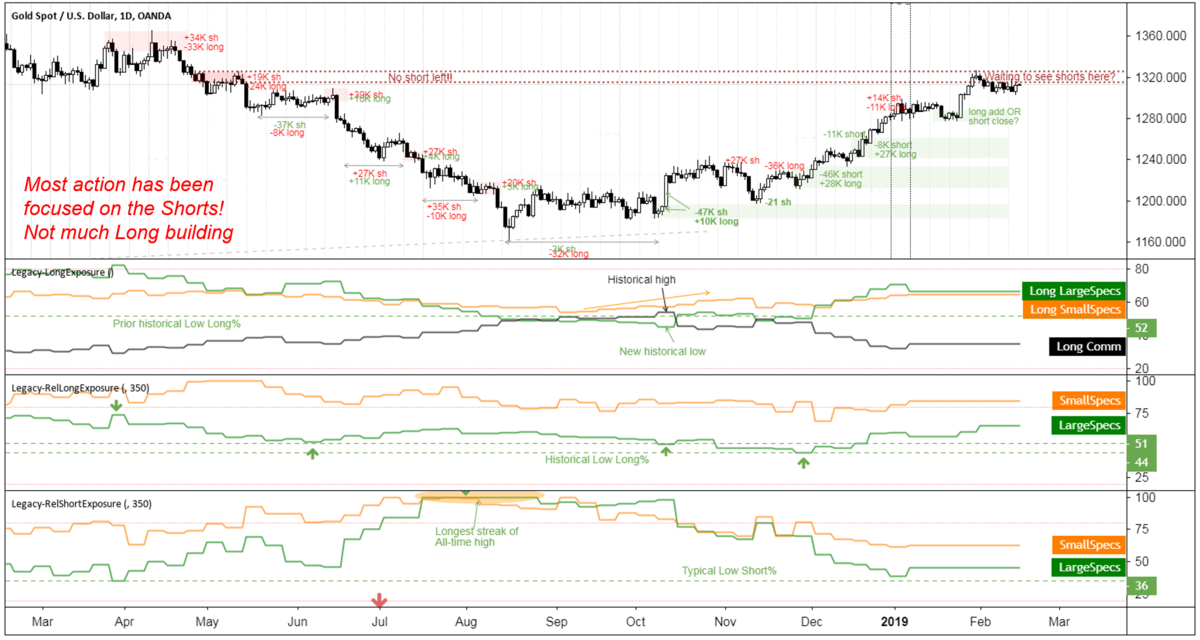
One obvious action during the past few bullish weeks is the fast closing of Shorts on any chance (drop in the price). Important to note is that it all started at the big bullish candle near mid Oct 2018. The tabulated data below also shows these numbers:
It would be easier to look at the data graphically as shown below.
COT-Legacy data and Gold chart and exposures
You can see how fast the Large Speculators closed their Shorts from extremely high relative short exposure to extremely low short exposure (bottom chart). However, they have not added Longs as fast and this is important. It seems most price action has been due to the short positioning changes and not due to longs. In fact, these traders started adding long almost 6 weeks after they decided on closing their large number of short positions.
And such a late stage decision to add longs makes them very vulnerable to close longs upon any barrier along the way. The first action happened in the latest COT data on Jan 8th 2019 which they closed 11K longs. We know that the price went higher from that area but you can imagine they had their doubts near that zone which is why a consolidation type of zone was created.
One last piece of information is to look at a longer term perspective and see if we can learn from Big Players' action in the past.
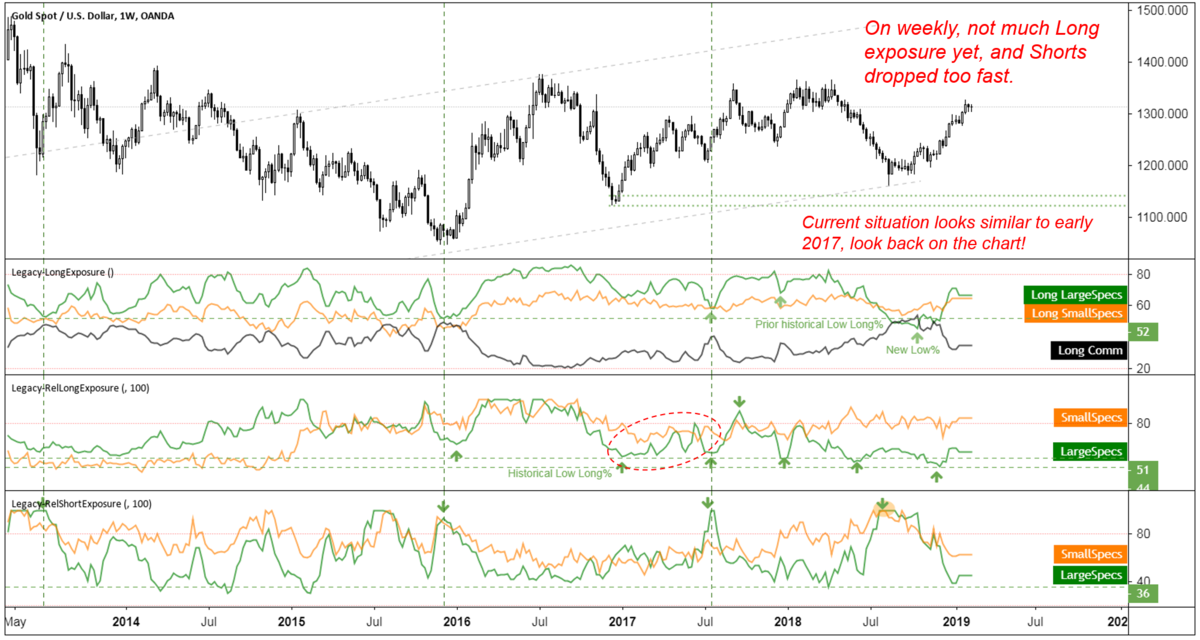
COT-Legacy data and Gold weekly chart and exposures
The weekly chart of Gold going back 5 years is shown below:
Looking at the short positioning of Large Speculators, you can see that whenever they can come back from their high short exposure fairly quickly. and that has always caused sharp upward movement. However, on the long positioning side, they can either do it in a quick manner or take their time. Just look at their long positioning action during the early-2016 vs. early-2017 period.
It seems that they decided to take their time in building long positions which is why we don't see a strong upward movement in the relative log exposure. But that means some upcoming drops in the price that allows them to benefit from some short term bearish action while building up longs. This is also what I will be doing in the next few months: taking advantage of short term bearish action while watching longs positions to find clues on where to add longs.
Note: some of these expected actions might have already happened but the delay in the COT data due to government shutdown does not allow us track them.
I will be posting some trade ideas based on this analysis on Gold. For now, I need to wait for more COT data and find clues on where to add shorts.
Good luck,
Zack
-
On this post, I will elaborate on my thoughts on the price movement on Gold over the past bearish and current bullish trend. This is a layer-by-layer (or onion-type) approach from the simple price action to much deeper and more educated analysis based on the COT data. As always, your feedback is highly appreciated.
The Gold chart and possible zones
On this simple Gold chart, I highlighted some of the areas which the price has shown strong reaction, either bearish (red boxes), bullish (green boxes) or consolidation type (curly brackets).
As you know, I am a big fan of understanding the Big Players thought process and decisions. So this is a game of me guessing what these players have done in the past. And yes, you can only guess based on this simple chart, nothing more!
It is not too difficult to imagine some Short Adding and Long Closing activity inside the red boxes and Long Adding and Short Closing activity inside the green boxes. I'd suggest you play along this game and make your guesses before looking at the next chart.
The next chart shows some of these activities.
The notes beside each box are the actual events that occurred based on the COT-legacy reports. If you want to learn more about these reports, I have published some posts on this forum (A Deep Dive into Commitment of Traders Data Analysis, Commitment of Traders Data Analysis- Data Meets the Chart, Commitment of Traders Data Analysis- Part 2)*
*Note: for some of these posts, you need our FREE membership accessible by singing up at the bottom of this page: https://bearbulltraders.com/forex-trading/
Some of these action by the Big Players are intuitive but some are not. In the following sections, the actual numbers based on these COT reports are shown on the chart. You will see how the action of these players affect the price.
Continue reading in our FREE membership section GOLD: an educational walk-through of the past and current cycle.
Zack
-
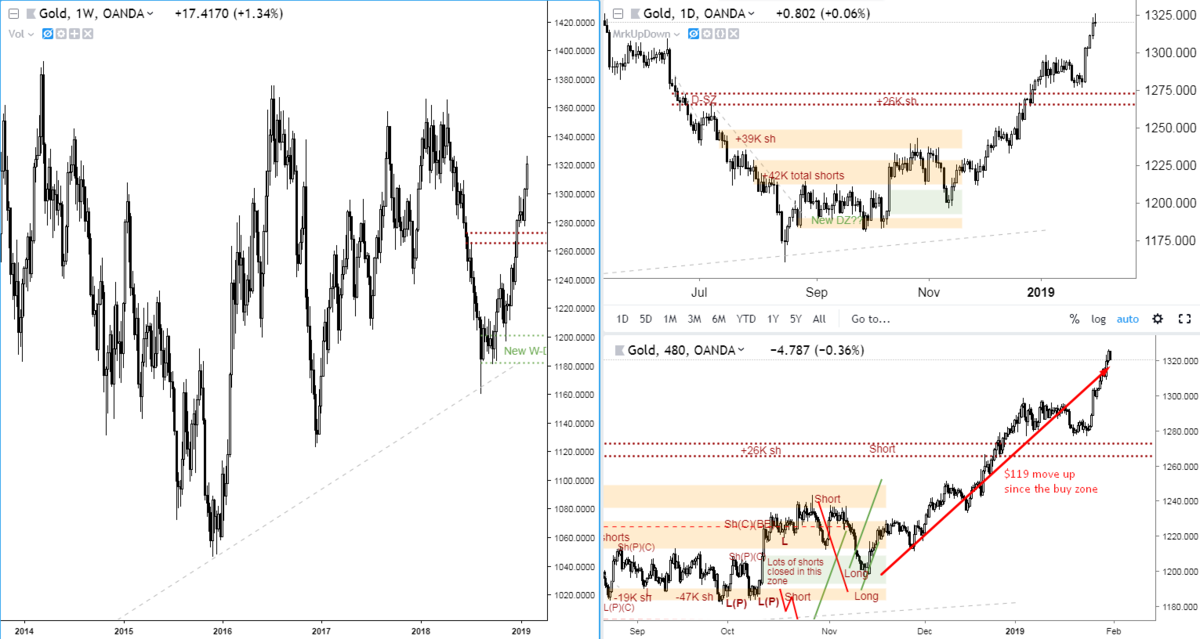
UPDATE:
This is from few months ago, but wanted to point out the move in Gold since then. Almost $119 move up since the buy zone signal. I am still holding some of the positions while took profit on some. There was a short order which I got stopped out.
See the before and now screen shots
I will post some more updates on these trade signals.
Good luck,
Zack
-
UPDATE:
The longs I started after the sharp drop are still open, we saw a strong move up after the FOMC data today. The price went a bit furhter down the buy zone I suggested in the previous zone (by 20 pips) but that is expected and should fall inside your SL range.
It is wise to move SL into profit, take some profit (TP 1 is already hit).
I will take some time to see all COT data starting this Friday, so until then, I would be still cautious on holding the longs below 0.70 which is somewhere around my average entry point.
Will update as we see more data in the coming days. and also will post new trades.
Good luck,
Zack
-
Thanks for your kind words.
A summary of COT analysis is published in the previous posts of our forum in the forex education section
https://forums.bearbulltraders.com/forum/20-forex-education/
You need to created a free forex account on the forex trading page to access those.
https://bearbulltraders.com/forex-trading/
Post your questions and ideas here and let me know if I can help.
Cheers,
Zack
-
 1
1
-
-
Finally the COT reports for the past few weeks are being released in the order they were missing starting this Friday.
https://www.cftc.gov/PressRoom/PressReleases/7864-19
Will be posting some updates on major pairs based on these reports, it is going to take a while until we get the latest data though.
Good luck,
Zack
-
 1
1
-
-
From the technical point of view, the support is broken, there is no demand zone in control at the moment. The nearest demand zone (buy zone) is at lower levels near 0.85. For the time being, the main thing I am looking for is a supply zone (sell zone) 0.88.
With the Brexit news, this pair is very tricky to trade, plus the fact that we don't have any idea what the big players are thinking (no COT data yet). I am staying away for the time being, I will post a chart with my analysis on this thread later today.
Good luck,
Zack
-
UPDATE:
With the government still shut down, and no real numbers based on big banks decision, we cannot see what really happened during the drop and pull back early this year.
CFTC reports are not being updated which is the main reason why I am holding off on making any new trade decision.
Price Action:
From pure price action point of view, the AUD has a change of a free fall to well below 0.68 and even filling a weekly gap down to 0.66 area. Why? because I can see all SL orders have been taken out by that giant drop early January. But what happened after that drop and how giant of a buy order was placed is a question which we don;t have the answer to. So please be aware the unknowns at the moment.
Zack
-
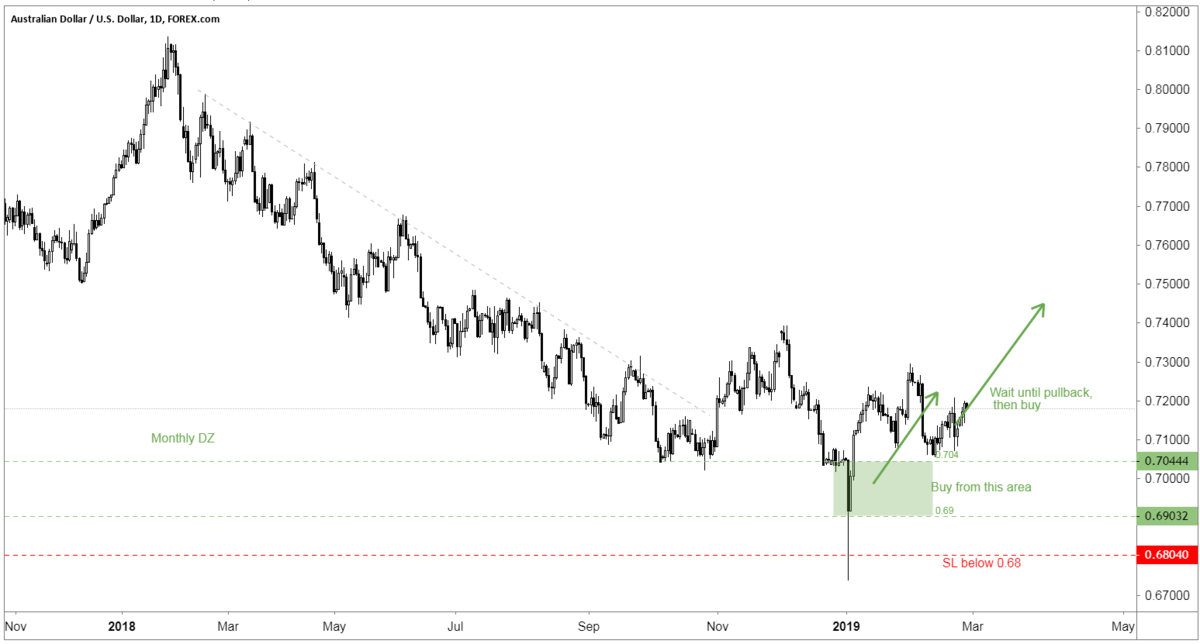
UPDATE:
Still looking good on re-buying from that zone.
I will wait form some pullback to buy more at around 0.71-0.715.
Note: buying from this area right now is purely based on price action (imagine the sellers who sold on that drop are all out for loss). Buy decision is NOT based on any COT data as I am patiently waiting for this government shut down to end. The big players are running around with their orders with no one watching their orders!
-
 1
1
-
-
For the next trade I am looking at Gold. I think there needs to be a drop so that the big players could add to their longs. Will post that later today or tomorrow.
Zack
-
UPDATE:
Had to buy back again, as yesterday's flash crash was just a "glitch". The price came right back in the buy zone so I bought again. Same SL.
Would be very helpful to have the past few weeks of CFTC COT data.
Zack
-
UPDATE:
Out of all longs I had opened on unexpected volatility during the least liquid time of the day. Apple earning modification is being cited as the catalyst.
Anyhow, will revisit after we get more CFTC data which has been missing for the past 2 weeks.
Zack


Trade Idea - Large Speculators on AUD: let's try one more round!
in Free Forex Topics
Posted
Let's talk AUD. From multiple points of view, AUD shows mixed signals which I discuss below.
Interest rates
Since the beginning of 2016, or better say late 2015 when the Federal Reserve started raising rates, there has been a major change in the directional movement of rates on USD and AUD. Chart below clearly shows how RBA slowly cut rates since then while the Fed held on to the 0.5% for a while and then pushed the rate higher for the past 2 years.
Such a change in the direction of rate from the two sides clearly has had its impact over the past year and half judging by the continuous drop in AUDUSD price. RBA cut their rate by another 25 basis point last month which could be major bearish signal. But more often than usual, the actions of RBA are well predicted in advanced so we could say the rate cut was already priced in the AUDUSD price. But the rate differential is definitely in favor of USD for the time being. From this viewpoint, the pair should still feel pressure to the downside.
COT data
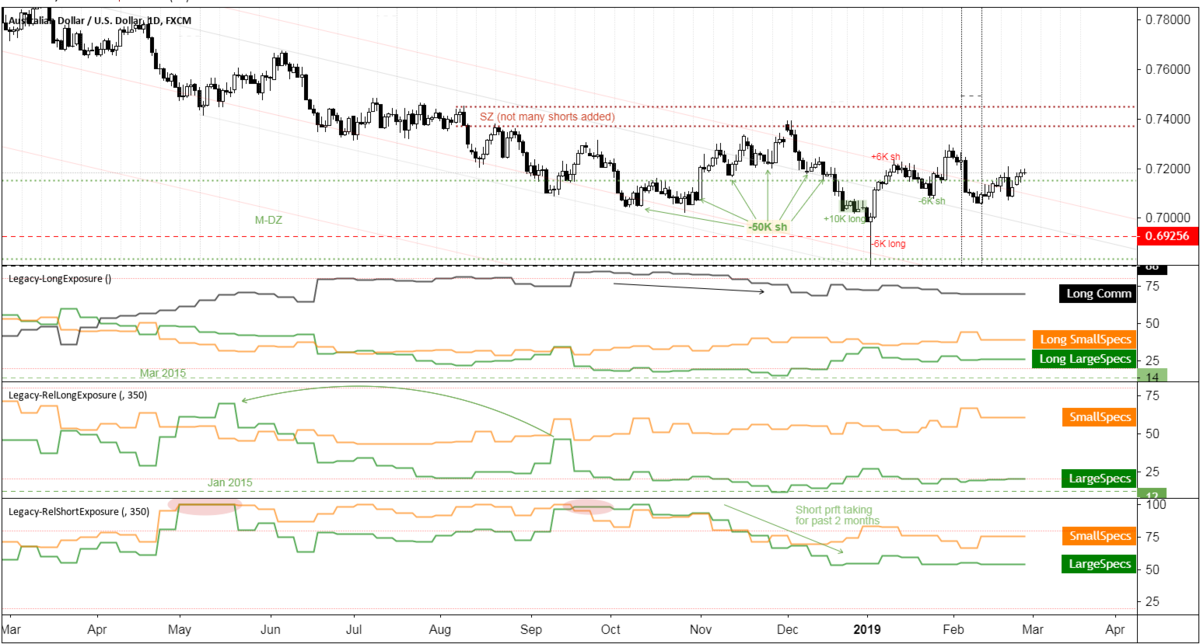
Looking at the reaction of the pair to the initial move in early 2016 shows insignificant bearish impact (see chart below).
In fact, for another 2 years, the AUD continued to gain strength. Looking at the positions of the large speculators, it was clear at the time (early 2016), they are accumulating any shorts and were net long on AUD. Since the dynamic change around May 2018, they turned into net short and have been short since then.
The major development starting around April this year has been some sign of long accumulation for the large specs. However, it was until very recently that they started reducing their short exposure as shown on the chart. It is worth noting that such scenario happened awhile ago in September 2018, but they failed in that attempt and got back into their shorts. It just seems to me that they are giving it another shot and so do I !
Position sizing at the moment
Let's look into the data in more details:
The only factor worth discussing are the recent dynamics in the long and short positions. The three major supply zones (red shading) indicated on the chart are where the large speculators added major shorts except the very top one which could have some shorts mixed up with the zone right below it. The recent demand zone (green shading) was the point of initiating some longs. It was also the area where almost all shorts started around the above supply zone were closed over the past few weeks. Essentially the supply zone which the price is currently at has almost no shorts. Also, those longs initiated in the demand zone were also all closed in the above supply zone. So what's left?
Except for about 11K longs started earlier in May (which are not closed yet), I expect an addition of some longs over the past few days rally in price. The price rally can also be caused by closure of more shorts initiated from the zone near 0.72 which makes the long case stronger.
Trade Plan
Based on the price dynamics over the past several weeks, the chart below summarizes my trade plan for scaling into a long position.
Depending on the COT data this coming Friday, I will start a long trade from near 0.70. Obviously, I will stay in that trade if I see more sign of short closure.
Note: the price might end up coming further down to 0.69 area but unless I see more long closure (unlikely) and more short adding, I will stay in the trade.
We need to realize that the large specs need to take care of a huge amount of shorts at the current price levels before pulling the price even higher. So, any drop in the price is another opportunity for closing more shorts. And one thing always stay true: they will dump all those shorts and take their relative longs exposure to 100% before price takes off. and that means patience. Once the price shows clear sign of aiming at the top supply zone around 0.72, I expect more short closures and I will add more to my long.
This is a game of probability and following the footsteps of these large speculators. These are speculators after all, so I don't expect anything more from them. Just that they are much more informed than us, but they can be wrong and will be wrong from time to time.
I will keep you posted here on this thread.
Cheers,
Zack