

vchandra11
-
Content Count
68 -
Joined
-
Last visited
-
Days Won
2
Posts posted by vchandra11
-
-
Hi There
Happy New Year to all. I am sharing my preliminary swing trading watchlist for 2022-Q1. The list has been prepared per notes in my swing trading plans posted earlier. Please send your comments and discussions for benefit of our BBT Swing Trading Forum team.
Food for thought: Design your trade. Trade your design. Keep the trade simple. Take responsibility for your design and trade.
Please note this is not an investment advise. Please seek investment advice from you own investment advisor. Any attachments and notes herein are for illustration and discussion purposes only on our BBT Forum.
-
Hi MikeJay
Here are some reference books I have used over last 20+ years, except Logical Trader and Top 10 which I bought last year.....good to keep learning. Great reference material for investing/trading principles and analysis. Of course I would think that to be a Fund Manager a more formal education would be required: post university degree + professional Fund manager/trading training.
Attached also is a copy of one of my sample swing trading plans. In the early going a good mentor is required who can provide guidance to prepare a trading plan similar to mine. End of the day it will be the trading plan that will help with high probability/consistent investing/trading.
Hope this comes in handy. Great to know your teenager is showing interest in investing/trading.
Also, you might want to check-out TD Ameritade Live Webcasts, featuring master investors/trainers with real time market analysis and trading, on YouTube: https://events.thinkorswim.com/#/webcast.
TD Ameritrade also has a online training course via ThinkOrSwim Platform/Education Centre...all for free, great investing and technical analysis program.
1-Sample Swing Trading Plan - Presentation.pdf

-
Hi there
I am sharing a sample swing trading plan to trade stocks in short-term rallies in a long -term uptrend. This is for discussion purposes only. Please feel free to send comments/discussions so our BBT Forum can benefit from same. The sample plan is based on information from instructor training, textbooks, Webinars, other swing trading plans, and information available on the internet over last few years. One good point up front is to keep things simple and this seems to be working for me. This is a sample base Stock Trading Plan that can be detailed to suit individual requirements.
In summary, the plan generally consists of:
1. Prepare a Watchlist of stocks with good fundamentals: growth and revenue
2. Fundamental analysis of each stock in the Watchlist
3. Technical Analysis of each stock in the Watchlist: Trend, trend strength, momentum, and comparison to market, sector, industry and sub-industries
4. Graphical analysis/markup: confirmation of: long-term trend, short-term retracement, and start of short-term rally; buy point, projected target price, projected target time frame, stop loss exit point, partial and final profit exit points
5. Risk Management
6. Miscellaneous routines and discussions
Initially the routines seems time consuming but after time it gets better.
Please note this is not an investment advice. Please seek investment advise from your own investment advisor. The attachments and notes are for illustration and discussion purposes only on our BBT Forum.
1-Swing Trading Plan - Short-term Swing Trading - Presentation.pdf
-
Hi there
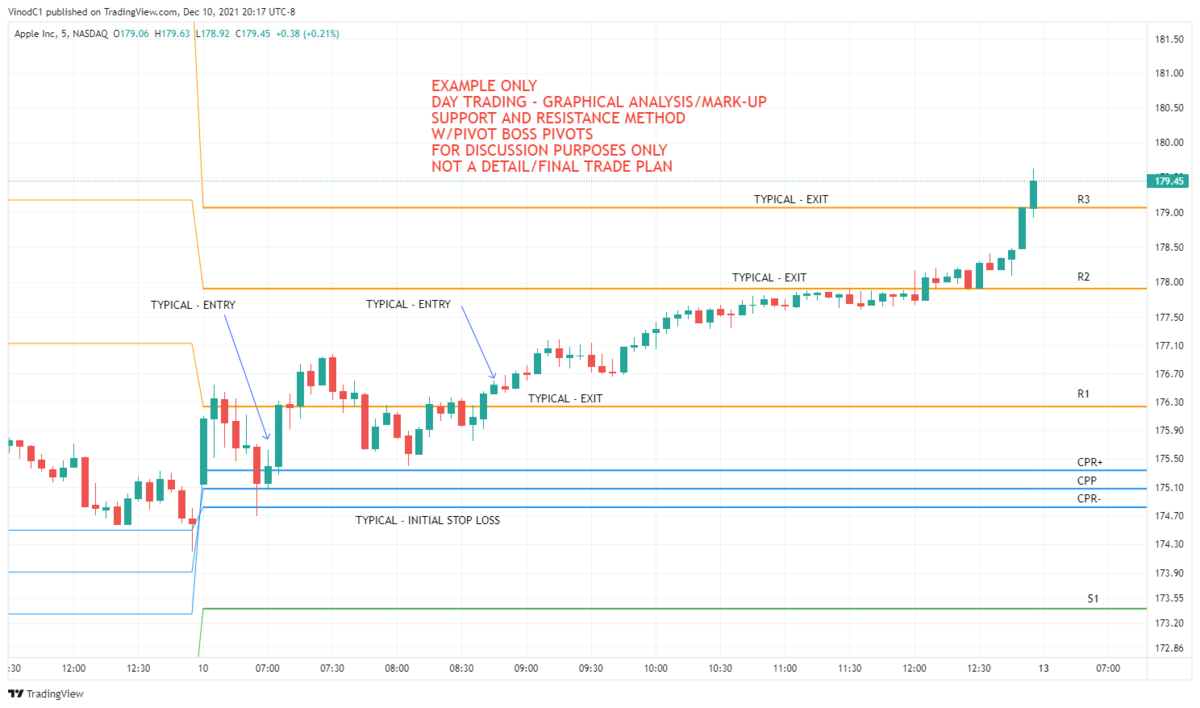
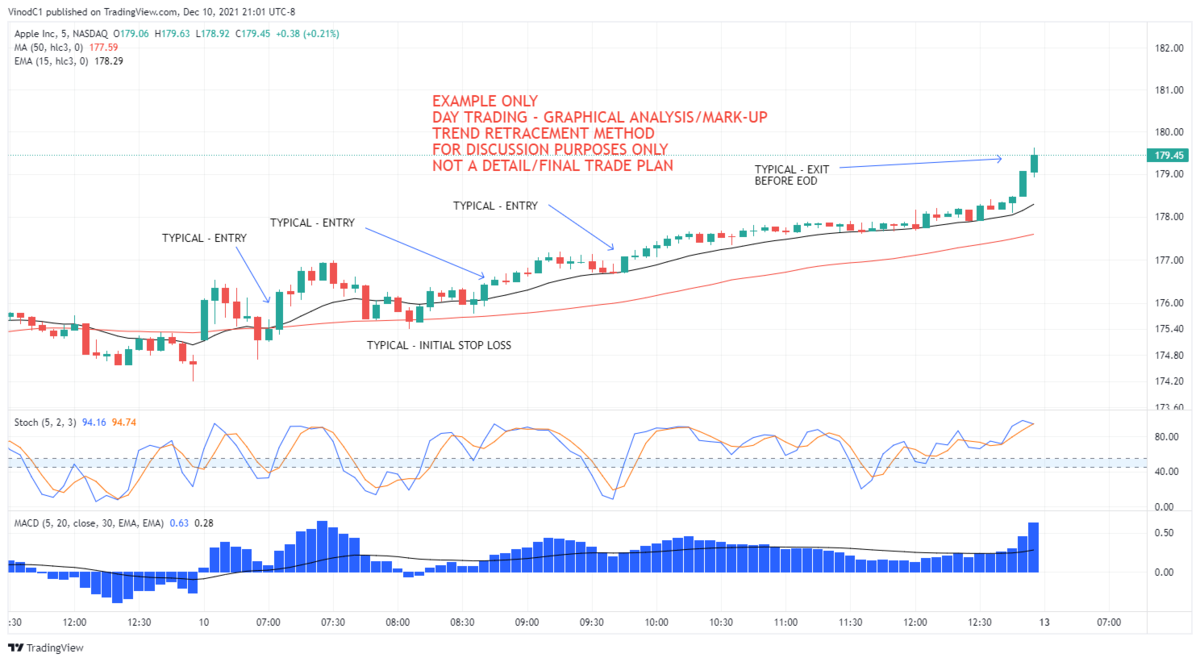
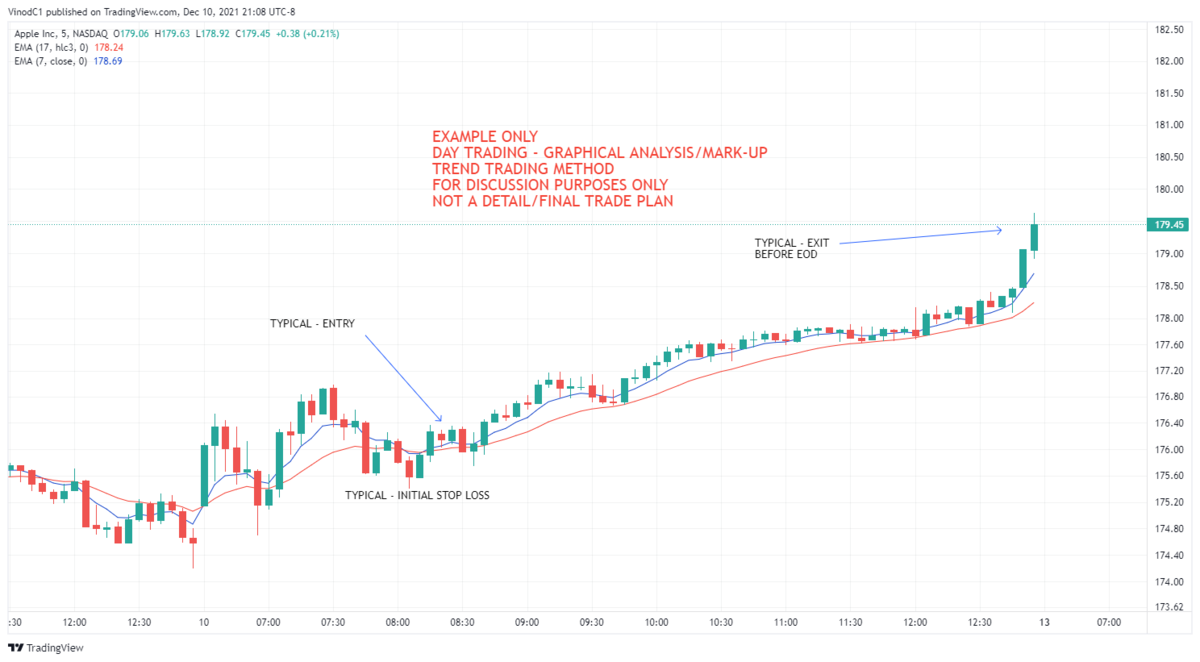
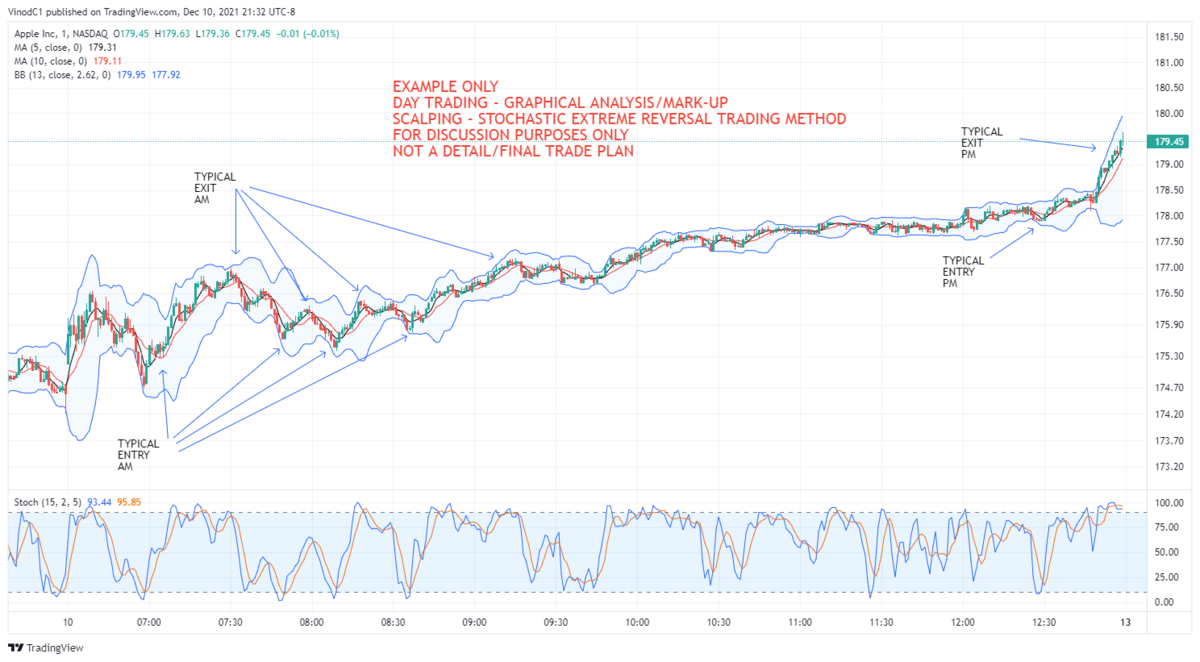
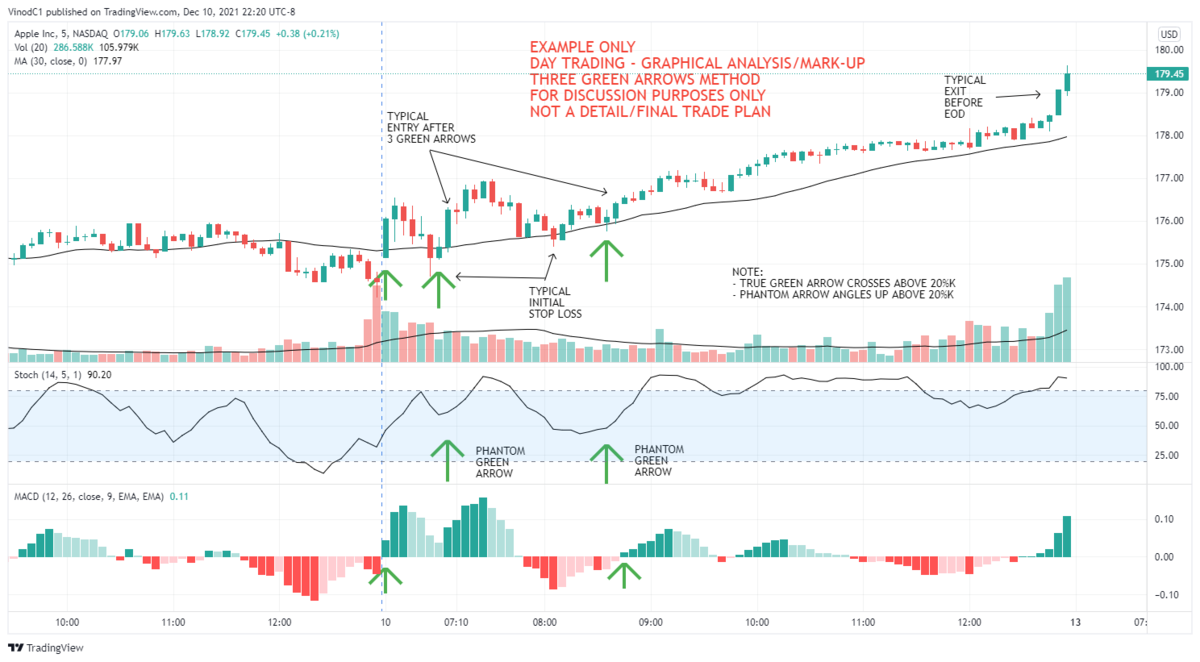
I am sharing examples of different strategies that could have been used for day trading AAPL today. Please feel free to send comments and discussions for benefit of out BBT Forum team.
This is record for end of day data showing entry and exit points and other notes. These are a live document during trading hours and mark-ups and notes updated thereon to suit.
The graphical analysis/design is for trading using bounces and/or breaks of support and resistance levels. Price action is supplemented with indicators and oscillators to identify price trend, momentum. cycle, overbought and oversold levels.
Please note this is not an investment advice. Please seek investment advise from your own investment advisor. The attachments and notes are for illustration and discussion purposes only on our BBT Forum
-
-
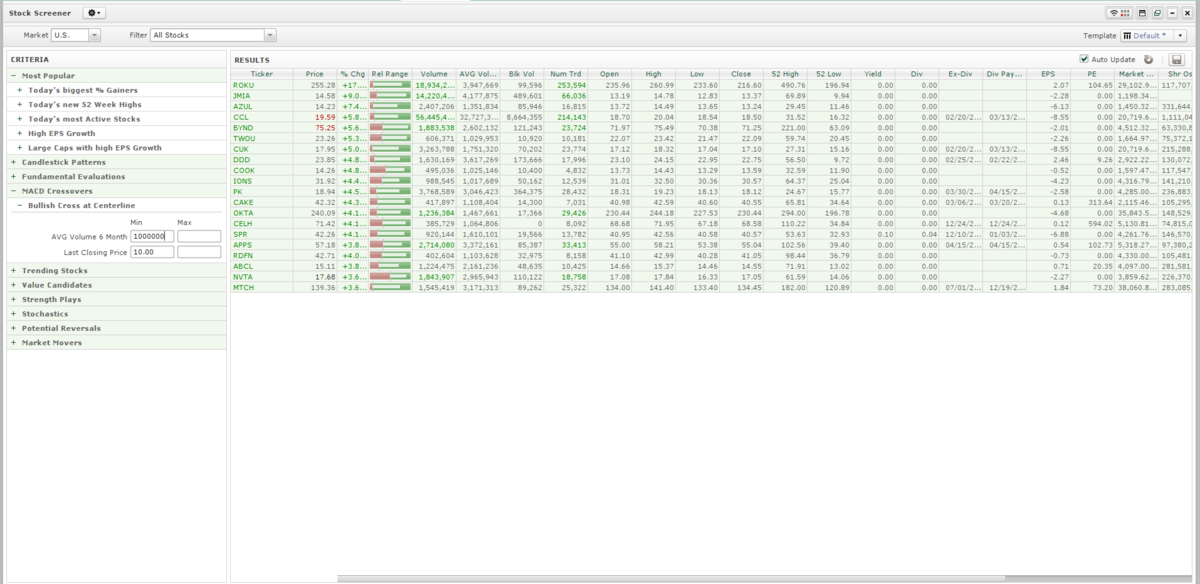
Hi there
I am sharing a sample watchlist and chart setup for short-term swing trading. The watchlist is prepared with criterion of MACD crossover and good volume. This is for discussion purposes only. Please feel free to send comments/discussions so our BBT Forum can benefit from same. The sample watchlist is based on information from instructor training, textbooks, Webinars, swing trading plans, and information available on the internet over last few years. One good point up front is to keep things simple and this seems to be working for me. This is a sample base short-term swing trading plan that can be detailed to suit individual requirements.
To come: Sample Swing Trading Plan for Short-term Investment
Please note this is not an investment advice. Please seek investment advise from your own investment advisor. The attachments and notes are for illustration and discussion purposes only on our BBT Forum.
-
Hi there
Here are some examples of breakouts/no breakouts with current price action and earlier chart pattern/base formation we discussed around 21 November 2021. Please send comments and discussions for benefit of our BBT Forum team.
As you can see that working with weekly charts has its own pros and cons. Requires more patience and helps avoid intraday and daily market noise. At the end of the day we all have to work at our own comfort level.
Please note this is not an investment advice. Please seek investment advise from your own investment advisor. The attachments are for illustration and discussion purpose only on our BBT Forum.
-
Hi there
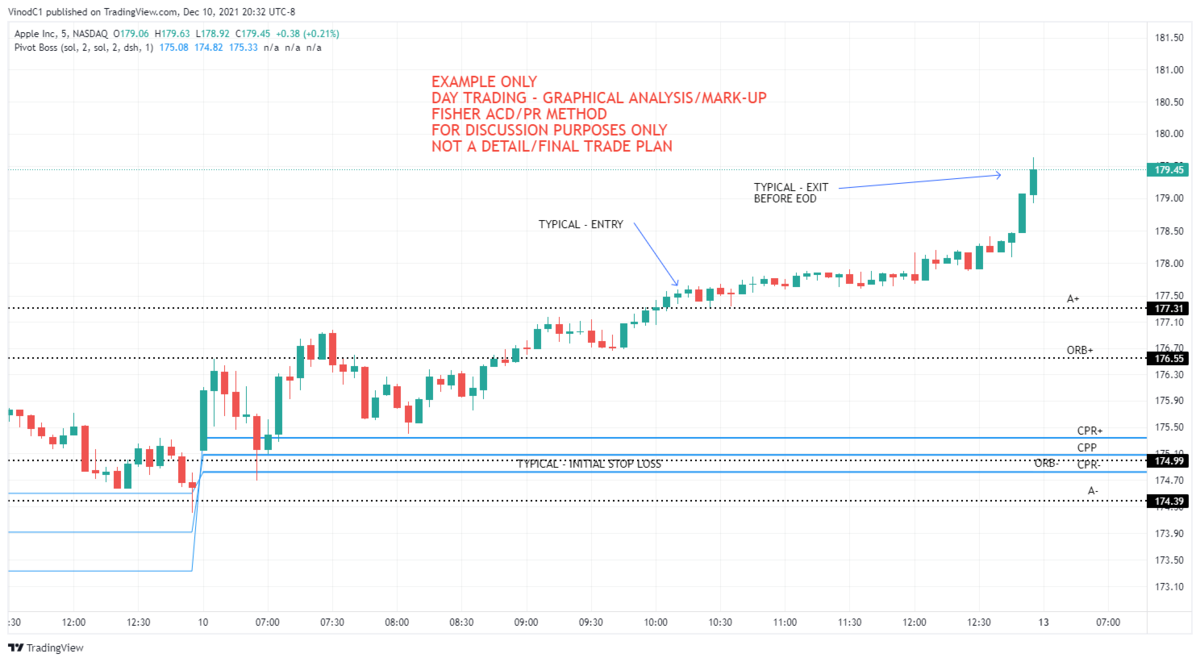
Continuing my example of preliminary analysis for day trading per attachments. Please feel free to send comments and discussions for benefit of out BBT Forum team.
This is record for end of day data showing entry and exit points and other notes. This is a live document during trading hours and mark-ups and notes updated thereon to suit.
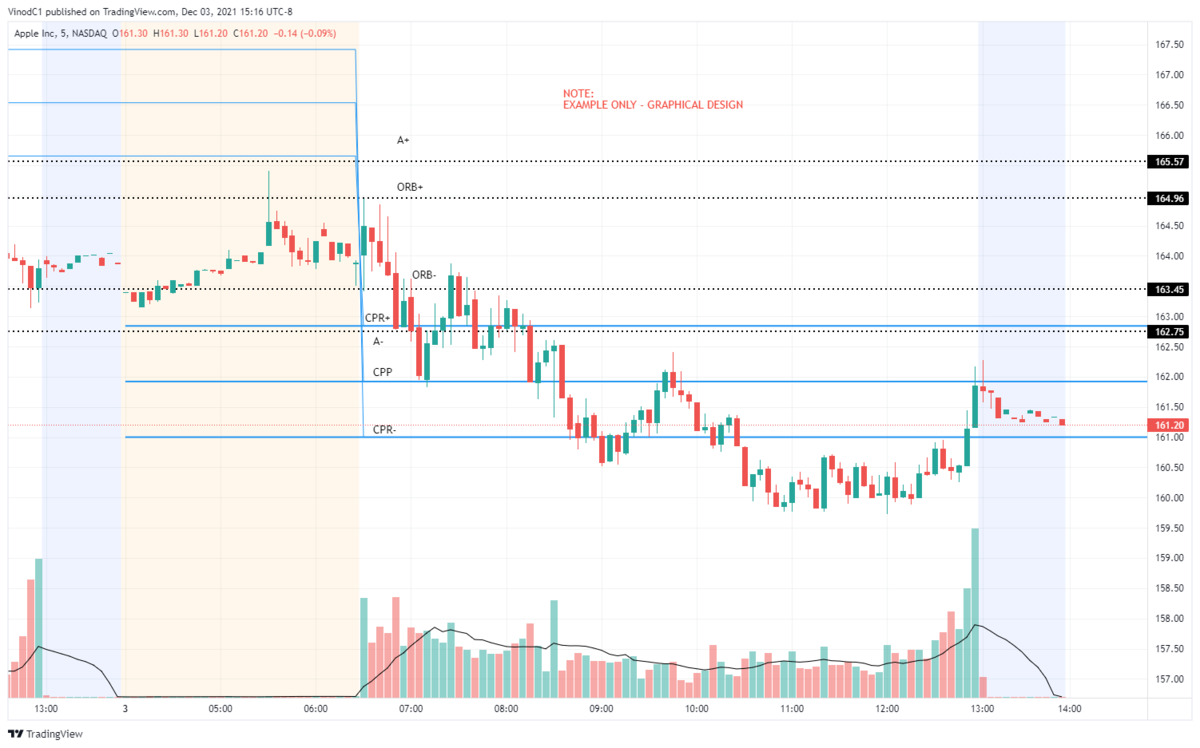
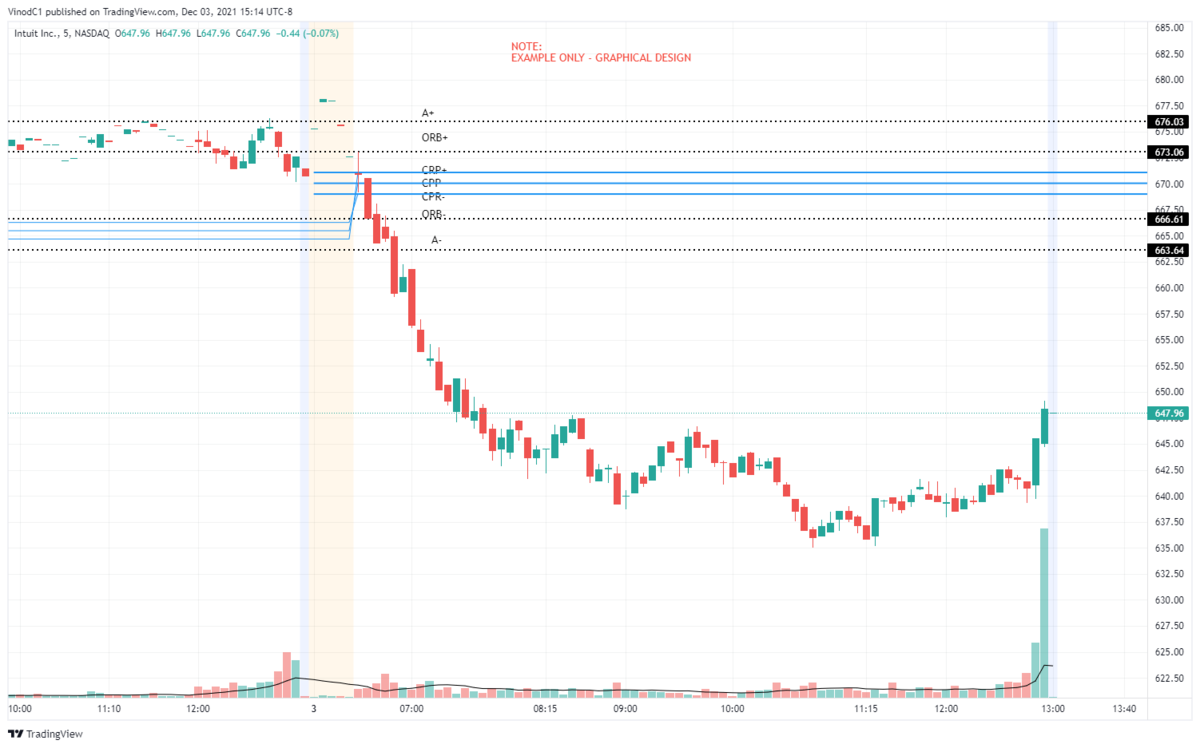
The graphical analysis/design is based on Fisher ACD method for ORB trades.
For this analysis I have included the Central Pivot Range, hence Fisher ACD/PR method for ORB trades. The CPR helps in identifying potential trading bias (bullish or bearish) as well as major support/resistance point.
I am posting mark-ups for AAPL and INTU.
I have also included examples from analysis on Trading View....more flexible than my regular trading platform.
Please note this is not an investment advice. Please seek investment advise from your own investment advisor. The attachments and notes are for illustration and discussion purposes only on our BBT Forum
EXAMPLE - DAYTRADE GRAPHICAL DESIGN - PIVOT CALCULATIONS - 02DEC2021.pdf EXAMPLE - DAYTRADE GRAPHICAL DESIGN - AAPL - MARKUP EXIT END OF DAY - 03Dec2021.pdf EXAMPLE - DAYTRADE GRAPHICAL DESIGN - INTU - MARKUP EXIT END OF DAY - 03Dec2021.pdf
-
Hi there
Continuing my example of preliminary analysis for day trading per attachments. Please feel free to send comments and discussions for benefit of out BBT Forum team.
This is record for end of day data showing entry and exit points and other notes. This is a live document during trading hours and mark-ups and notes updated thereon to suit.
The graphical analysis/design is based on Fisher ACD method for ORB trades.
For this analysis I have included the Central Pivot Range, hence Fisher ACD/CPR method for ORB trades. The CPR helps in identifying potential trading bias (bullish or bearish) as well as major support/resistance point.
I am posting mark-ups for AAPL and LRCX. AAPL did not meet my trading criteria therefore no AAPL trade today. However per mark-up LRCX provided two potential short opportunities.
Please note this is not an investment advice. Please seek investment advise from your own investment advisor. The attachments and notes are for illustration and discussion purposes only on our BBT Forum.
EXAMPLE - DAYTRADE GRAPHICAL DESIGN - PIVOT CALCULATIONS.pdf EXAMPLE - DAYTRADE GRAPHICAL DESIGN - AAPL - MARKUP EXIT END OF DAY - 02Dec2021.pdf EXAMPLE - DAYTRADE GRAPHICAL DESIGN - LRCX - MARKUP EXIT END OF DAY - 02Dec2021.pdf
-
Hi there
I am sharing examples of preliminary analysis for day trading per attachments. Please feel free to send comments and discussions for benefit of out BBT Forum team.
This is record of end of day data showing entry and exit points and other notes. This is a live document during trading hours and mark-ups and notes updated thereon to suit.
The graphical analysis/design is based on Fisher ACD method for ORB trades.
Yesterday I had posted AAPL mark-up on another post (attached here again) and AAPL mark-up for today. I am also including mark-up for LRCX. I did an early scalp trade on LRCX. I generally have 3 to 4 stocks on the screen. Today had PKI, UNH, AAPL and LRCX. Just posting mark-ups for AAPL and LRCX.
Please note this is not an investment advice. Please seek investment advise from your own investment advisor. The attachments and notes are for illustration and discussion purposes only on our BBT Forum.
EXAMPLE - DAYTRADE GRAPHICAL DESIGN - AAPL - MARKUP EXIT END OF DAY - 30Nov2021.pdf EXAMPLE - DAYTRADE GRAPHICAL DESIGN - AAPL - MARKUP EXIT END OF DAY - 01Dec2021.pdf EXAMPLE - DAYTRADE GRAPHICAL DESIGN - LRCX - MARKUP EXIT END OF DAY - 01Dec2021.pdf
-
Hi there
Please see my reply/post to Silviu earlier today, ref ORB. , for some helpful comments. Thank you.
-
Hello Silviu
Some more food for thought:
Attached is my understanding/summary of graphical design for ORB trading per Fisher ACD Method for potential AAPL trade today.
Good reference book for ORB trades: The Logical Trader - Mark B. Fisher.
Please note this is not an investment advise. Please obtain investment advise from your own investment advisor, The notes and illustrations herein are for discussion and illustration purposes only on BBT Forum
EXAMPLE - DAYTRADE GRAPHICAL DESIGN - AAPL - MARKUP FOR ENTRY POINTS.pdf EXAMPLE - DAYTRADE GRAPHICAL DESIGN - AAPL - MARKUP ENTRY POINT.pdf EXAMPLE - DAYTRADE GRAPHICAL DESIGN - AAPL - MARKUP POTENTIAL EXIT.pdf EXAMPLE - DAYTRADE GRAPHICAL DESIGN - AAPL - MARKUP SECOND ENTRY.pdf EXAMPLE - DAYTRADE GRAPHICAL DESIGN - AAPL - MARKUP EXIT END OF DAY.pdf
-
Hello Silviu
Some food for thought:
If I knew in the weekend that I will be trading AAPL and MRNA on Monday morning using ORB trades, before the trade I would do the following based on my Day Trading Plan for ORB trades:
1. Determine trade bias for the market
2. Determine trade bias for the sector
3. Determine trade bias for AAPL and MRNA
4. Determine overall trade bias for each of AAPL and MRNA
5. Mark-up support and resistance levels
Per my analysis, trade bias was:
AAPL - Bearish
MRNA - Bearish
This means I will only take short trades for ORB on Monday morning for AAPL and MRNA.
Attached are graphical analysis for AAPL and MRNA.
However, for AAPL, after market open, I see the trend and momentum are up/bullish, but my bias is for bearish trade, therefore I would not take an ORB trade for AAPL.
Also, for MRNA, after market open, I also see that the trend and momentum are up/bullish, and again my trade bias is for bearish trade, therefore I would not take an ORB trade for MRNA.
So in short, I would not have taken any ORB trade for AAPL and MRNA last Monday.
For me it is a good practice that if the bias analysis for the day based on market alone is bullish, then it would be prudent to look for and take bullish trades, This can be done done ahead of time in a more relaxed manner, ie end of day data analysis for trade next day. Also if I want to trade one or two selected stocks, then I can also do trade bias analysis for the stocks as well. This process favors high probability of success, ie trade with the market.
Also, if I do ORB for stock in play in the morning, I would make it 10-min ORB (x2 5-min candles). This gives me time to prepare graphical analysis, calculations and selection from two or more stocks before placing the trade.
My suggestion is to get yourself a mentor who can help you to prepare your Day Trading Plan with ORB. Good reference book for ORB trades: The Logical Trader - Mark B. Fisher.
Please note this is not an investment advise. Please obtain investment advise from your own investment advisor, The notes and illustrations hereon are for discussion and illustration purposes only on BBT Forum.
Typical Graphical Analysis - AAPL-5-min for 28Nov2021.pdf Typical Graphical Analysis - MRNA-5-min for 28Nov2021.pdf
-
Hello there
Attached please find the sample swing trading plan with exhibits and notes per some of my earlier posts. I hope easier to navigate now. Thank you.
-
Hi there
I am sharing a sample swing trading plan for intermediate-term swing trading with a strategy to enter a trade upon breakout from a chart pattern. This is for discussion purposes only. Please feel free to send comments/discussions so our BBT Forum can benefit from same. The sample plan is based on information from instructor training, textbooks, Webinars, other swing trading plans, and information available on the internet over last few years. One good point up front is to keep things simple and this seems to be working for me. This is a sample base Stock Trading Plan that can be detailed to suit individual requirements.
In summary, the plan generally consists of:
1. Prepare a Watchlist of stocks with good fundamentals: growth and revenue
2. Fundamental analysis of each stock in the Watchlist
3. Technical Analysis of each stock in the Watchlist: Trend, Trend strength, momentum, and comparison to market, sector, industry and sub-industries
4. Graphical analysis/markup: chart pattern formation, buy point, base top, base bottom, projected target price, projected target time frame, stop loss exit point, partial and final profit exit points
5. Risk Management
6. Miscellaneous routines and discussions
Initially the routines seems time consuming but after time it gets better.
Please note this is not an investment advice. Please seek investment advise from your own investment advisor. The attachments and notes are for illustration and discussion purposes only on our BBT Forum.
-
Please note one key component I did not mention earlier is that stocks on my watchlist have to have strong institutional trading. This is also a very important criterion for screening/scanning.
Therefore, the shortlist that I have has good growth and has institutional trading. This suggests to me that when when market, sector, industry, sub-industry moves, the stocks on my list will be prime candidate to be leaders, and this will be captured on graphical analysis as price action approaches base top with good volume.
-
Hi there
I will cover the scan/screening and review of watchlists in Sample Trading Plan (to come).
However, in one of my submittals I had identified that I use three watchlists.
The main/master watchlist is screened for quarterly. Try to keep the list to around 50 or less.
I then shortlist this list after reviewing the fundamentals of each stock. This is my working list for the quarter. I try to keep this list to 25 or less, this is more manageable. I review the working list end of each week to select stocks that are in the process of forming a base and the price is moving towards the base top/prospective buy point. I can start preliminary graphical analysis at this time, followed by calculations for reward/risk potentials and selection if have several candidates.
Once I have bought the stock I will move it to my current position list for daily review, i.e. trade/position risk management.
Yes, before I enter the trade I will look for favorable market and sector conditions via price movement in S&P 500 E-Mini Futures and S&P 500 Index and SPY/QQQ/XLs. This is just a cursory graphical review to see that the stock, sector and market are moving in the same direction.
However, because I am swing trading, I am anticipating price move for a short period of time i.e. Rally-Base-Rally, get in and get out fast ....... after the move has started and before retracement. That is why I review the positions daily and even intraday to take advantage of short uptrend moves. In a good move, you can scalp as well intraday or overnight with more that 2% move.....no harm in scaling-out and taking some profit. This also reduces some risk from a pullback and potential no bounce, and a hence stop loss exit.
Please remember the current discussion is for intermediate-term swing trading. I use the same watchlist for short-term swing trading as well but the technical/graphical analysis and chart set-up is different.
Great to know you are also having fun with swing trading.
Food for thought: Design you trade. Trade you design, Keep the trade simple. Take responsibility for your design.
Please note this is not an investment advise. Please seek investment advice from you own investment advisor. Any attachments and notes are for illustration and discussion purpose only on our BBT Forum.
-
Added potential target price and calculations per attached.
Example Graphical Analysis - LLY - Technical - Added TP.pdf Example Graphical Analysis - LLY - Calculations.pdf
-
I am sharing an example of a preliminary analysis for swing trading per attachments. Please feel free to send comments and discussions for benefit of out BBT Forum team.
The graphical analysis was prepared with drawing tools commonly provided with trading platforms.
I have seen questions from our Forum members on what platform to use. The idea is once you have a Trading Plan and know what you need for your trading analysis then you can look for these tools in your platform. So in the end your trading platform is compatible with your Trading Plan,
Please note this is not an investment advice. Please seek investment advise from your own investment advisor. The attachments and notes are for illustration and discussion purposes only on our BBT Forum.
Example Graphical Analysis - LLY - Fundamentals.pdf Example Graphical Analysis - LLY - S&P500 Comparison.pdf Example Graphical Analysis - LLY - Technical.pdf
-
Update: Adding Preliminary graphical analysis for XLU for short-term swing trading.
This is an example of a graphical analysis for a short-term swing trading or early entry for intermediate-term swing trading. The idea is that the institutional buyers will be active at the intermediate buy point. We only make profits when we sell, so why not sell when others are buying.
Example - Preliminary Graphical Analysis - XLU Short Term.pdf
-
 1
1
-
-
Update: Adding preliminary graphical analysis for XLU.
-
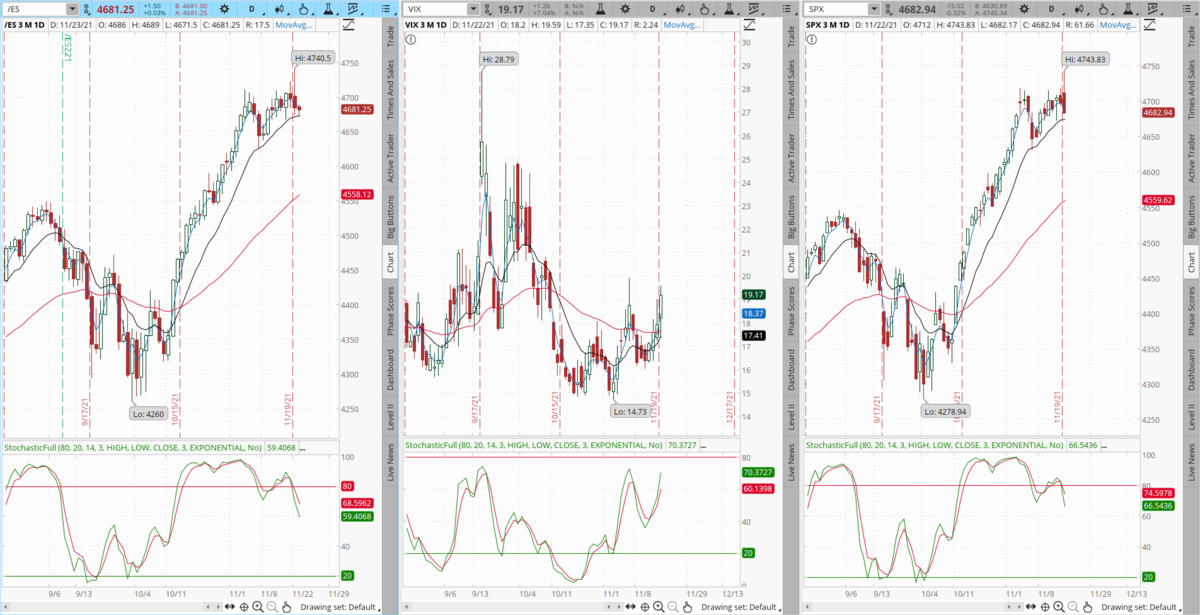
Attached is example of Market Action charts I sometimes use on TOS. See direction of VIX as compared to S&P 500 Futures and Index.
-
I am sharing an example of a preliminary graphical analysis for swing trading per attachment to have an idea on the markets with Index CFDs. Please feel free to send comments and discussions for benefit of out BBT Forum team.
From the graphs we see general divergence between price action and oscillators. This suggests to me to be cautious with long positions at this stage for swing trading.
The graphical analysis was prepared with drawing tools commonly provided with trading platforms. The pin bar is a custom indicator by the broker at extra cost.
As per earlier note, I have seen questions from our Forum members on what platform to use. The idea is once you have a Trading Plan and know what you need for your trading analysis then you can look for these tools in your platform. So in the end your trading platform is compatible with your Trading Plan,
Please note this is not an investment advice. Please seek investment advise from your own investment advisor. The attachments and notes are for illustration and discussion purposes only on our BBT Forum.
-
I am sharing an example of a preliminary graphical analysis for swing trading per attachment. Please feel free to send comments and discussions for benefit of out BBT Forum team.
The graphical analysis was prepared with drawing tools commonly provided with trading platforms.
I have seen questions from our Forum members on what platform to use. The idea is once you have a Trading Plan and know what you need for your trading analysis then you can look for these tools in your platform. So in the end your trading platform is compatible with your Trading Plan,
Please note this is not an investment advice. Please seek investment advise from your own investment advisor. The attachments and notes are for illustration and discussion purposes only on our BBT Forum.
.JPG.d28de8a492e2f4992c7c2457d96ca90e.JPG)
.JPG.506411887e2b82577b7cd8bbb7698ab4.JPG)

.JPG.68f533085409f9136209df4ebfc645ef.JPG)
.jpg.8a2eb9666b29bce69f915f75543a1869.jpg)
.jpg.e80183516aefcb7952c8f193fa4eb82a.jpg)
.jpg.894bb74f98d50e738ee217680dab7543.jpg)
Example - Swing Trading - Volatile Stock Microtrend Trading, Introductory Notes
in Swing Trading
Posted
Hi there
I am sharing a sample watchlist and sample chart setup for swing trading volatile stocks for microtrend-term. The methodology contains/combines information generally discussed in the intermediate-term and short-term swing trading plans posted earlier. The watchlist is prepared with scan criterion of stock HLVolatility ( > 5%), Beta ( > 1), ATR ( > 2.00) and 50-day average volume ( > 4M) on Thinkorswim. The chart set-up incorporates exponential moving averages on 1-hour time frame. The chart includes at least 4 weeks of 1-hour data to identify potential support and resistance levels for potential exit points. This is for discussion purposes only. Please feel free to send comments/discussions so our BBT Forum can benefit from same. The sample watchlist, charts and notes herein are based on information from instructor training, textbooks, Webinars, swing trading plans, and information available on the internet over last few years. One good point up front is to keep things simple and this seems to be working for me.
For further reading:
1. " 20 Most Volatile Stocks - This strategy is for experienced trader. .....This strategy requires you to be able to react to price momentum very quickly and is primarily for day traders, options traders, and some microtrend traders.......If you are using this strategy as a microtrend trader, you must use stops, for a microtrend trader will not hold one of these stocks over five days......The key to trading this strategy is to identify the trend strength and trade in that direction. " *
" Microtrend Trader: A microtrend trader by our (Deel's) definition is a trader who takes position with the intention of holding it for three to five days. The microtrend trader is attempting to trade a small part of a larger trend.... For microtrend trading to be successful the entry must be made when the trend is strong. This usually occurs when the trend is underway or begins explosively. The momentum should carry the price for three to five days....After three to five days, the microtrend trader liquidates his or her position and looks for another microtrend. " *
* the strategic electronic day trader, Robert Deel, 2000, Published by John Wiley and Sons Inc.
2. Investopedia
In summary, and per Deel, the idea is to prepare a watchlist of volatile stocks for analysis at end of each week. After graphical analysis of the individuals stocks, three of the most volatile stocks that are moving in a definable trend on daily chart are selected for trading during the following week. My trades will be for bullish trend for long trade. The attached example watchlist and charts are for last weeks trading (Jan 10-14). Examples thereon can lead you to further research, and as mentioned in earlier posts, it would prudent to have a mentor who can help you to prepare a swing trading plan for trading volatile stocks for microtrend-term.
Please note this is not an investment advice. Please seek investment advise from your own investment advisor. The attachments and notes are for illustration and discussion purposes only on our BBT Forum.
Examples - Swing Trading - Microtrend Trading - High Volatility Watchlist and Setup Examples.pdf