

vchandra11
-
Content Count
68 -
Joined
-
Last visited
-
Days Won
3
Posts posted by vchandra11
-
-
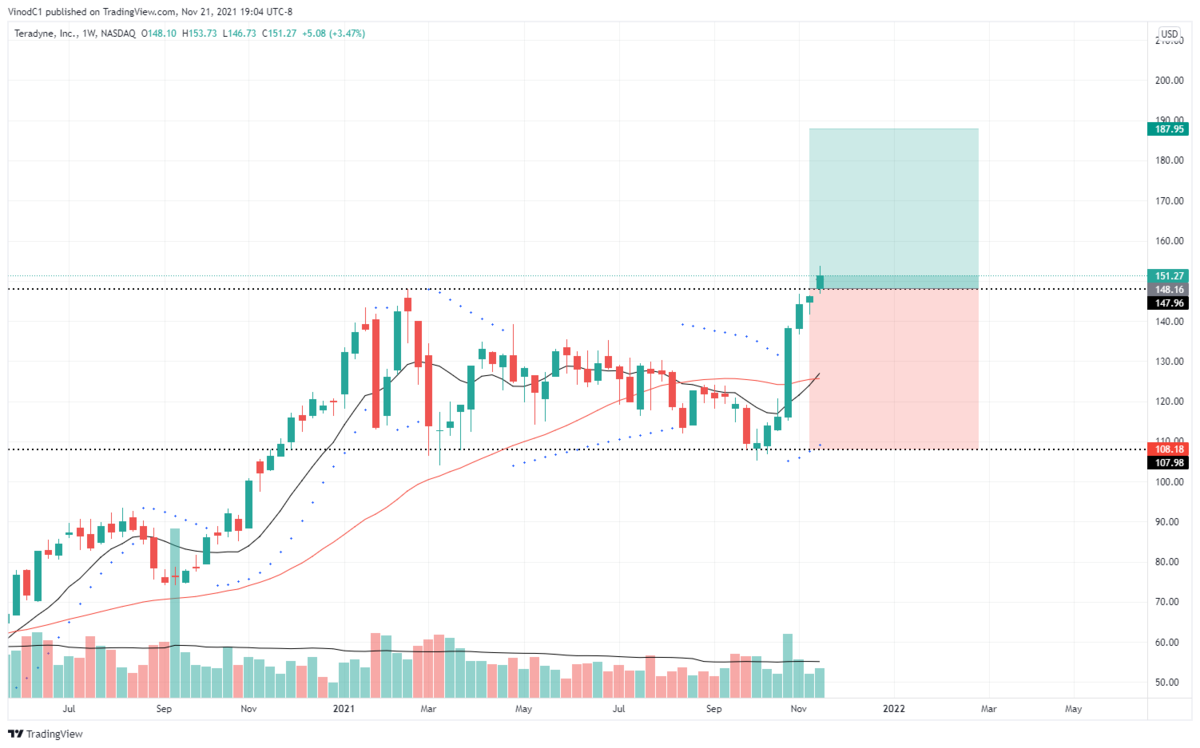
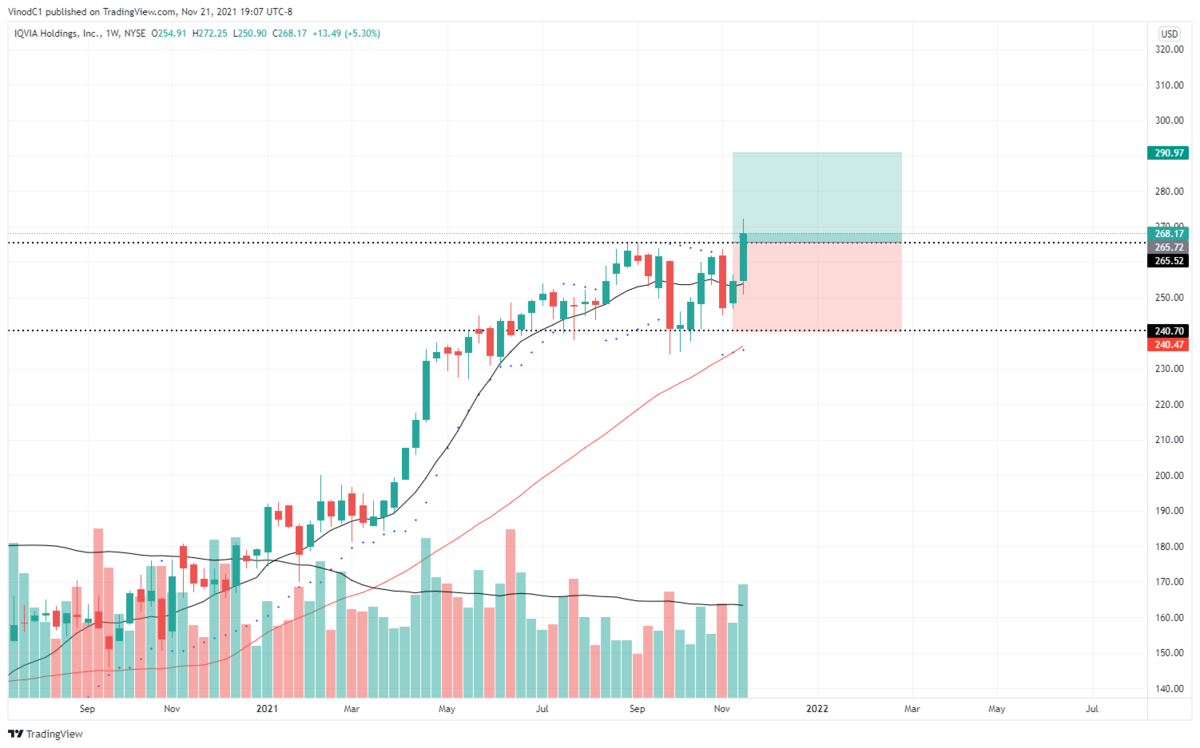
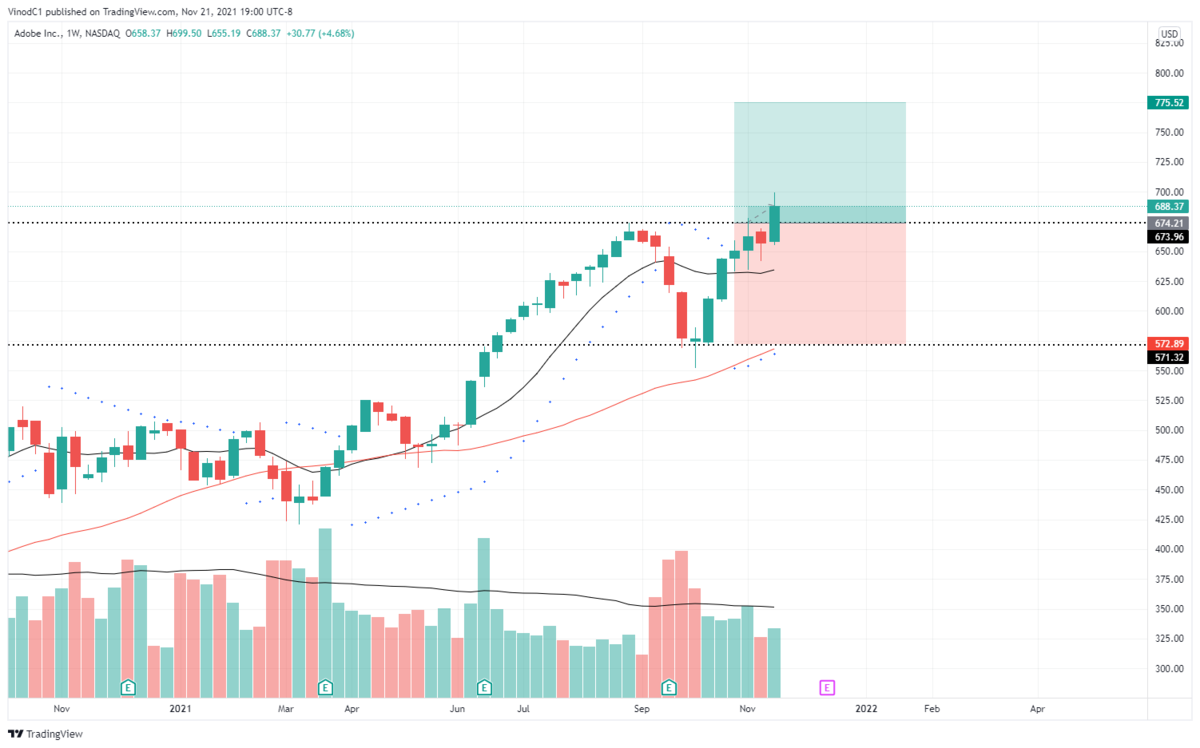
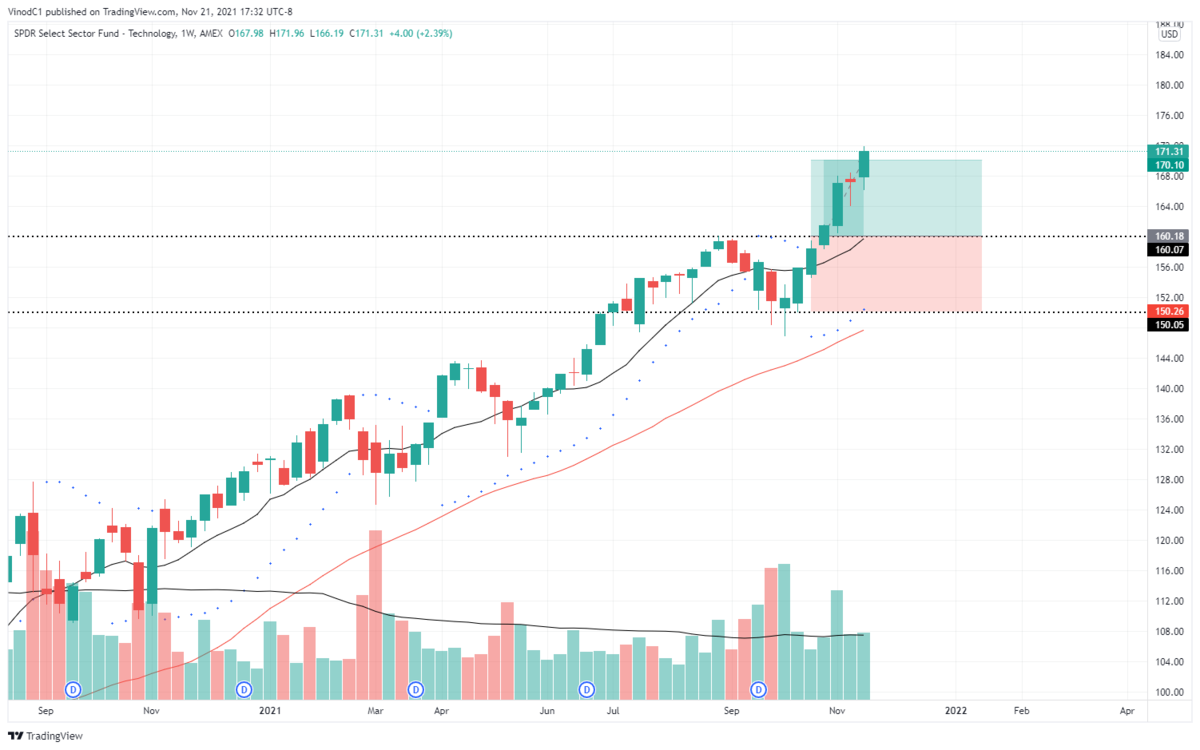
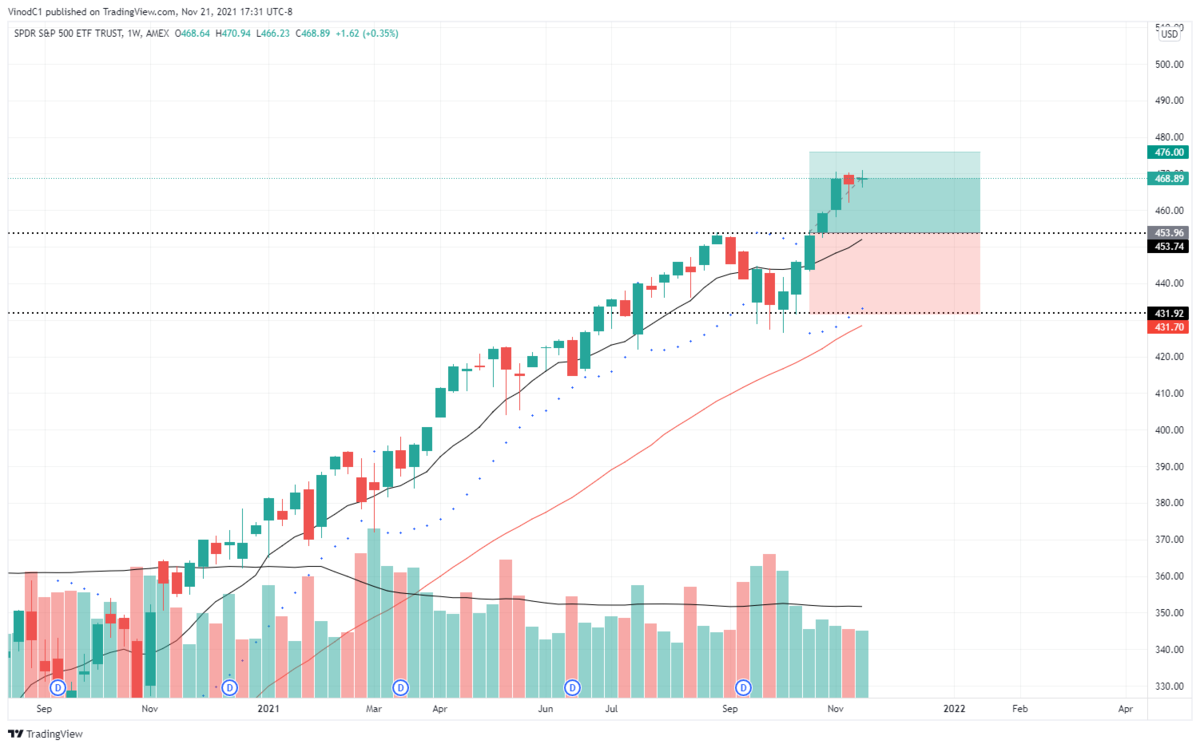
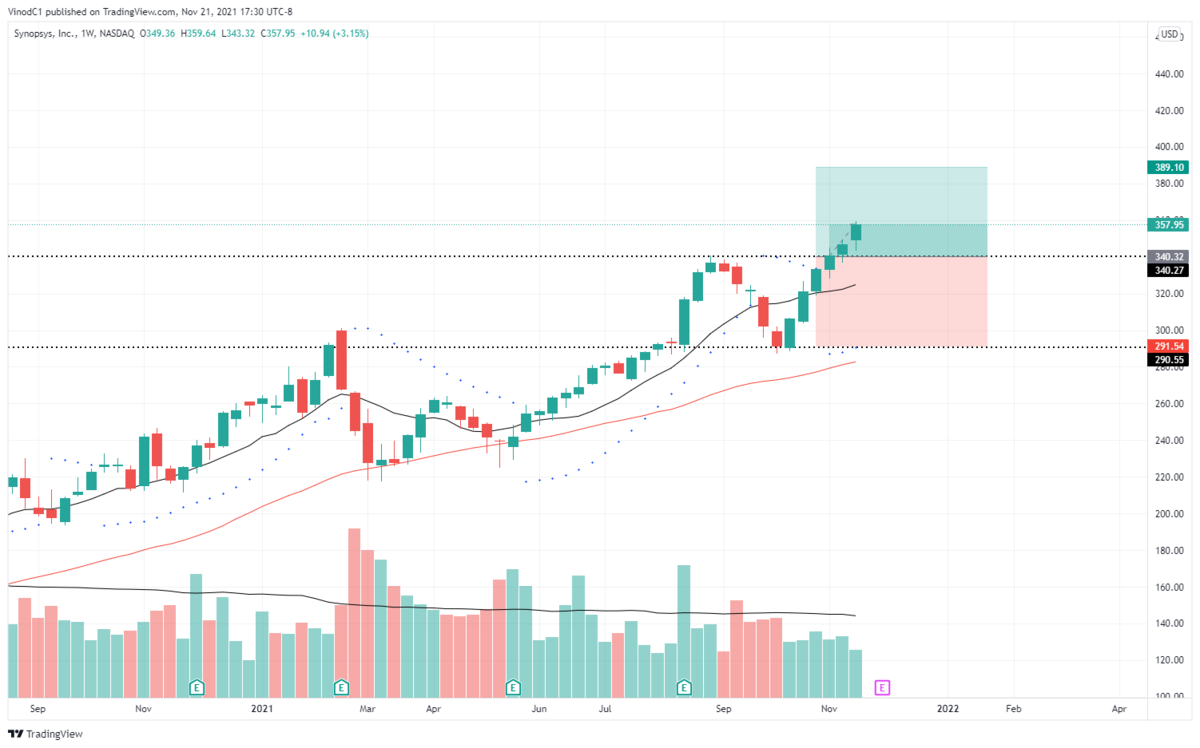
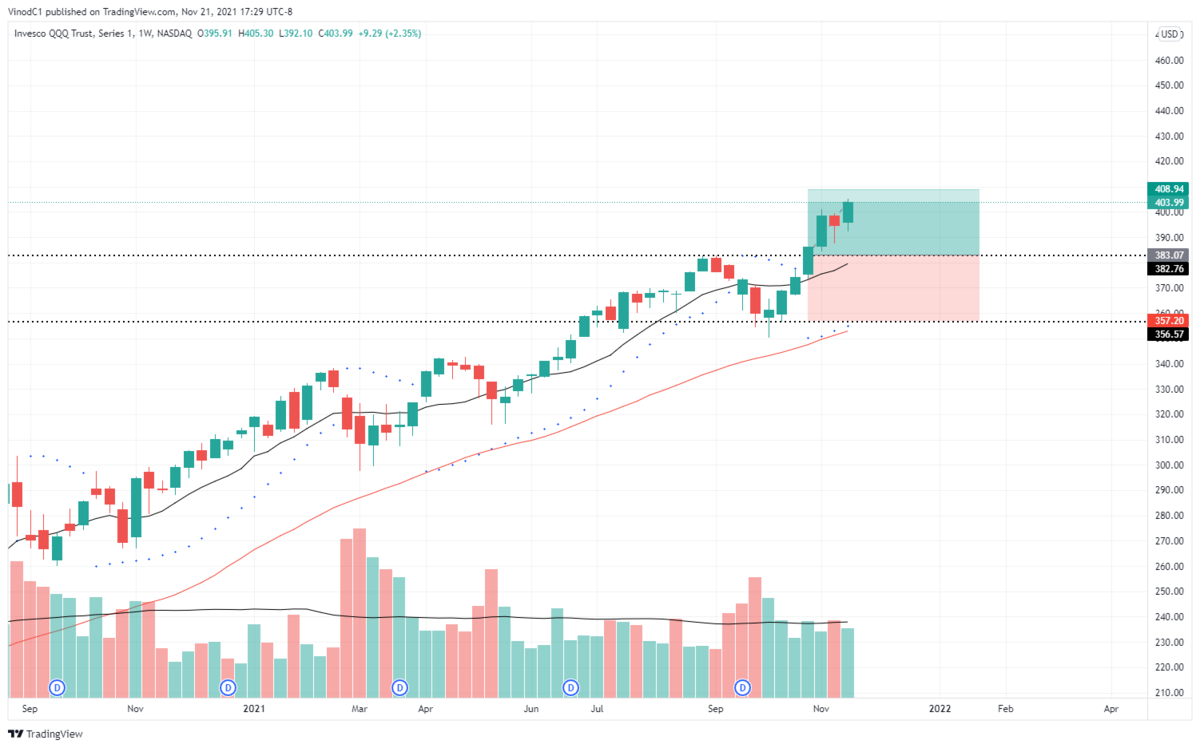
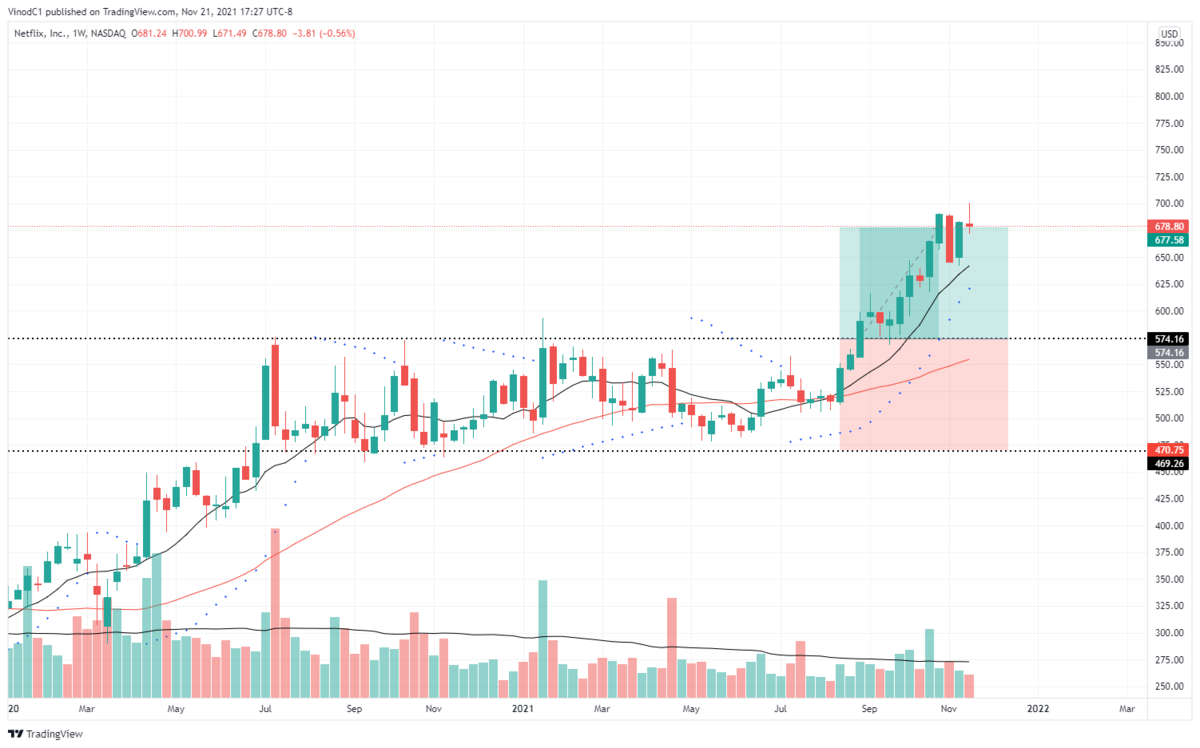
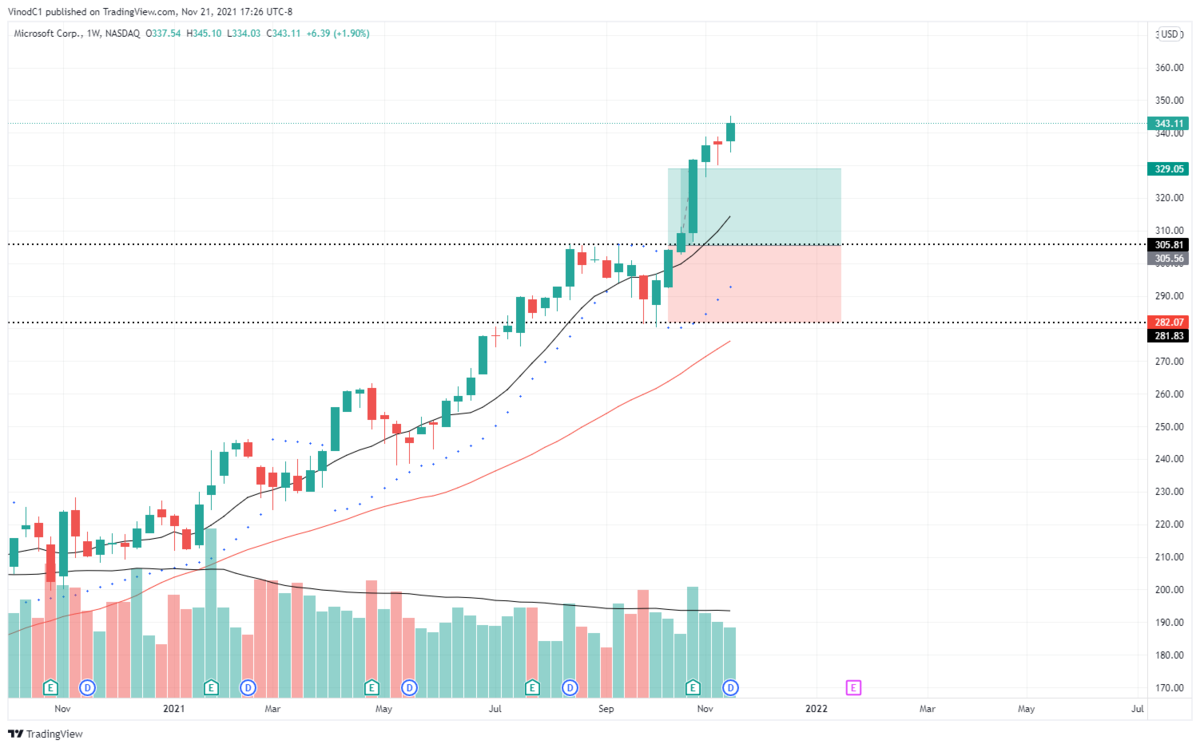
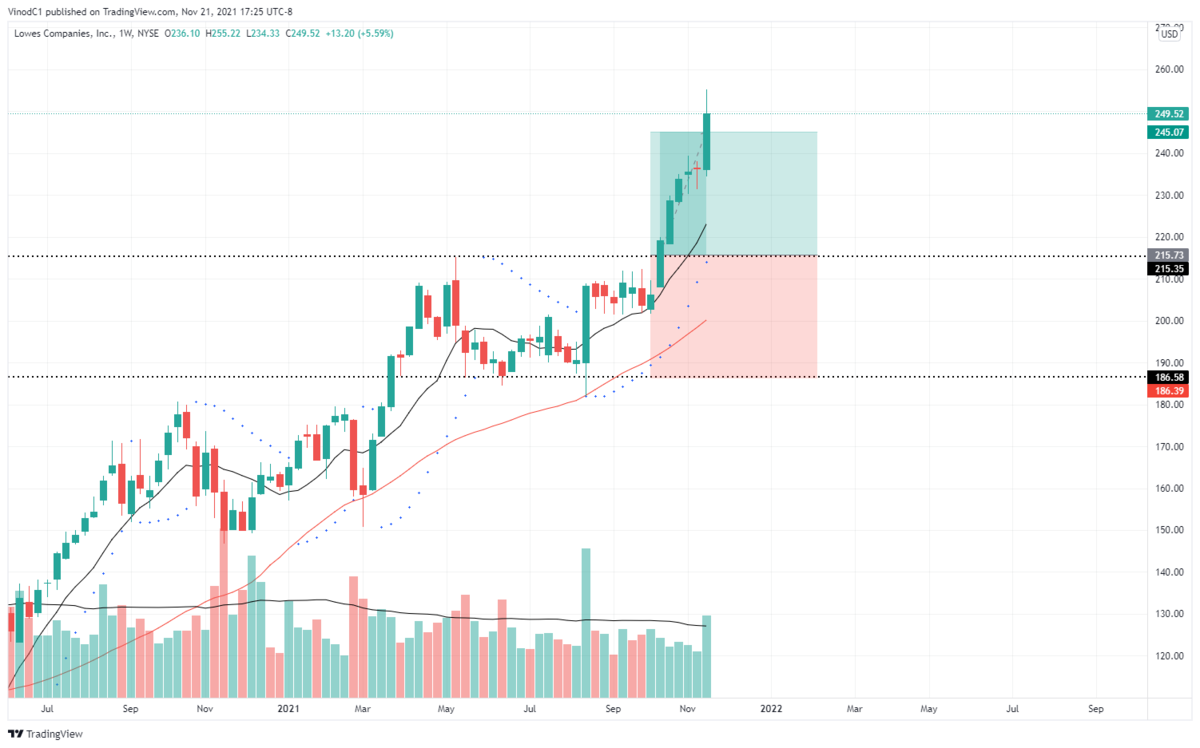
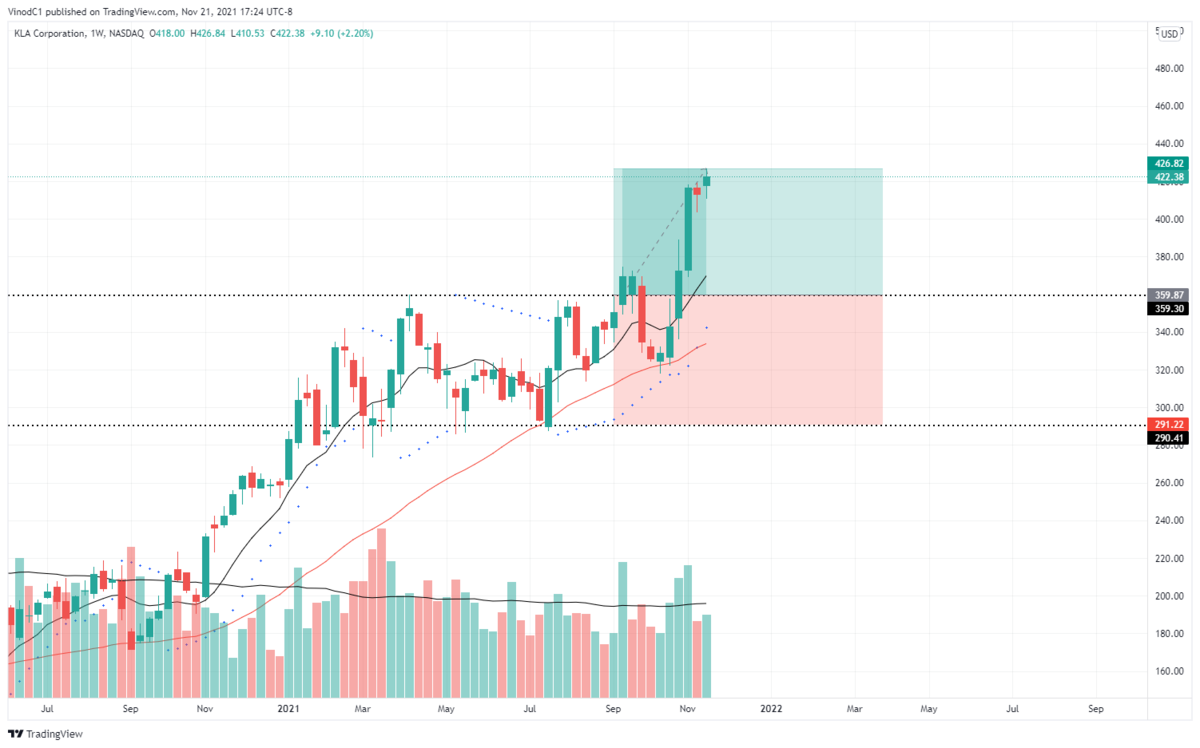
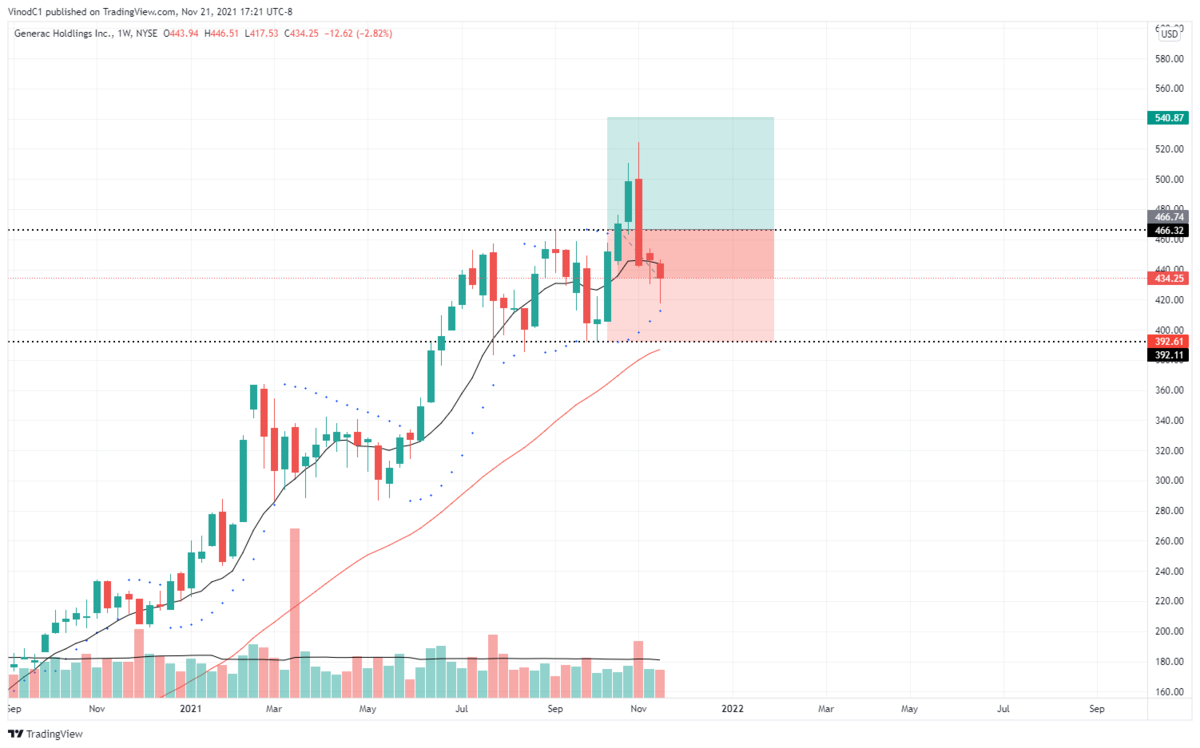
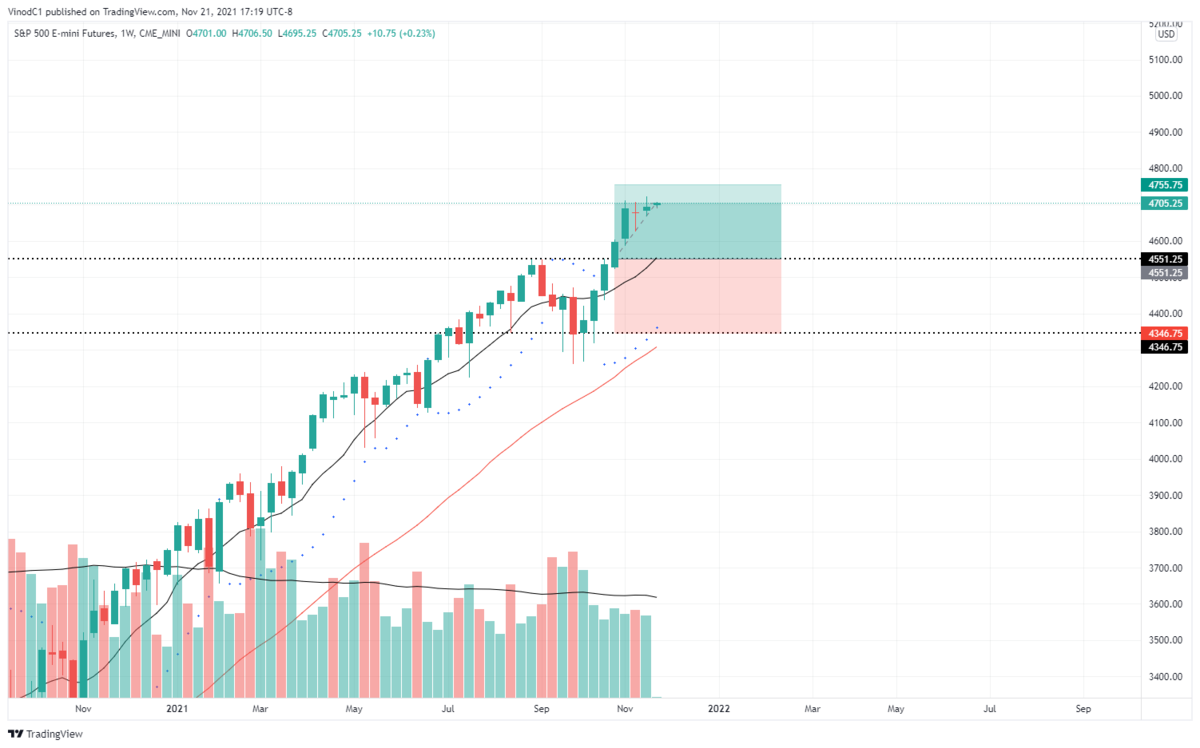
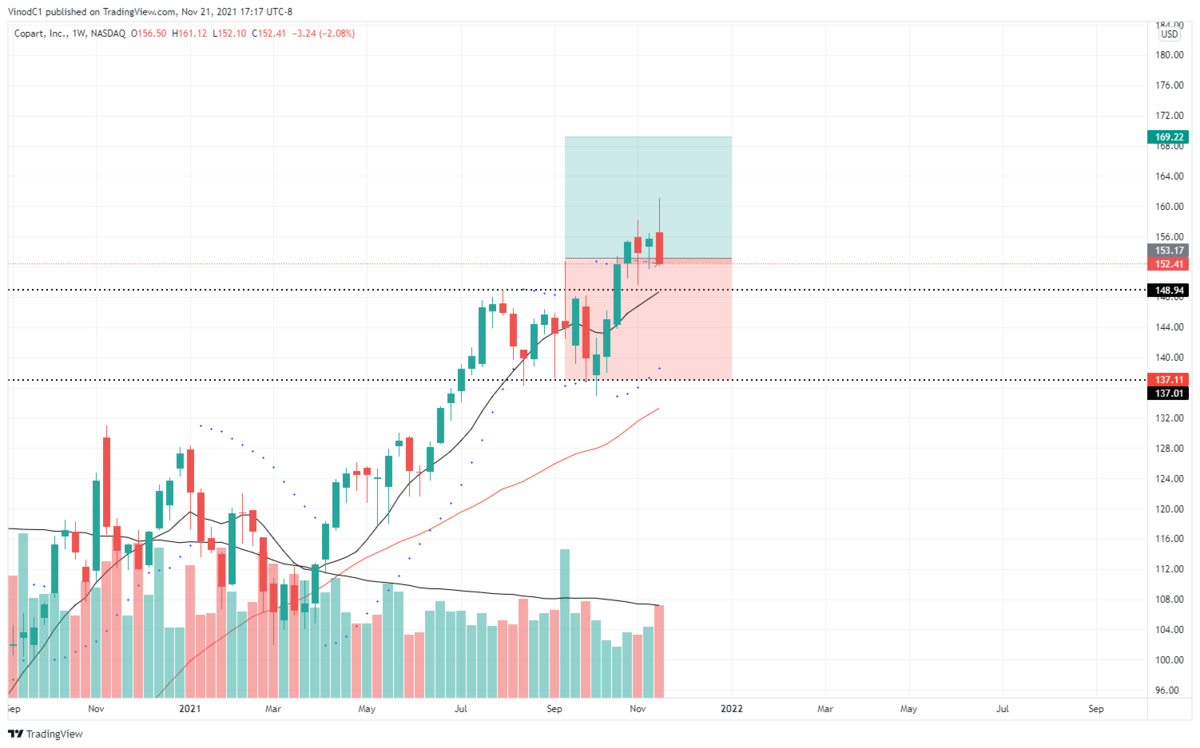
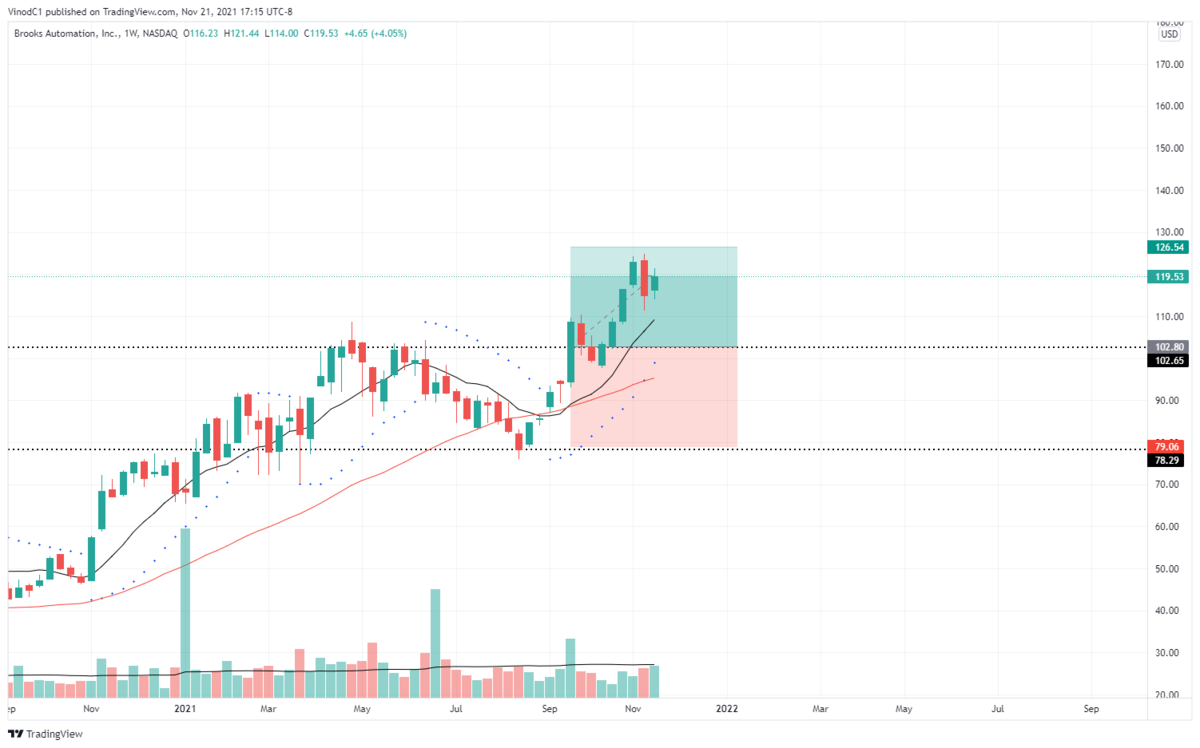
Here are some examples of recent breakouts from chart/base formations from the Watchlist I attached earlier. ADBE had second BO via the cup handle.
Please note this is not an investment advice. Please seek investment advise from your own investment advisor. The attachments are for illustration and discussion purpose only on our Forum.

-
Here are some examples of recent breakouts from chart/base formations from the Watchlist I attached earlier.
Please note this is not an investment advice. Please seek investment advise from your own investment advisor. The attachments are for illustration and discussion purpose only on our Forum.
-
 1
1
-
-
This attachment shows how I convert my spreadsheet for Trade Calculation Analysis to a Trade Investment Record.
Please note that the attachment is for illustration and discussion purposes only.
-
Attached is sample of my simple spreadsheet set-up for trade calculation/analysis after completion of a graphical analysis on the chart.
This gives me an opportunity to review my risk and reward for the trade and evaluation/selection from potential trades.
By now you can see that the routines/processes for swing trading is quite involved. That is why it is important for all swing traders to have a Swing Trading Plan for consistency. Also, a mentor is recommended for new swing traders.
Please note that the attachment are for illustration and discussion purposes only.
Coming up: Historical/Recent Graphical Analysis Examples
Coming up: Current Breakout Analysis Examples
Coming up: Outline of a typical Swing Trading Plan for trading with chart pattern formation and graphical analysis
Typical Trade Calculator Form.pdf Typical Trade Calculator Analysis.pdf
-
This is last example of Graphical Analysis.
This is a great example as it involved identification of a complex double bottom base formation of ALGN over a lengthy period. As you can see, this type of analysis can identify great trades and give us the edge.
For this analysis I also used the ZIGZAG indicator to help identify the impulses and retraces of the price action. Besides Moving Averages and SAR indicators, other indicators and oscillators come in handy as well.
Coming up: Trade Calculations
Typical Graphical Analysis - Double Bottom Base - Before Trade.pdf Typical Graphical Analysis - Double Bottom Base - After Trade.pdf
-
Here is sample graphical analysis of ADBE with Rectangular Base Formation.
A point to note is that bases take time to form. Bases may take several weeks to several months or longer to form, but with a Watchlist made of stocks from several Sectors/Industries, we increase our chances for some good base formations during the year.
If someone has preference to particular Sectors/Industries then they can trade in same. Hence , there is lots of flexibility for individual traders to suit their requirements/commitments. This leads us to ensure that we have flexibility in our stock screener. Also you will need to identify typical earnings, sales and equity growth figures for that particular sector/industry.
Coming up next: Double Bottom Base Formation
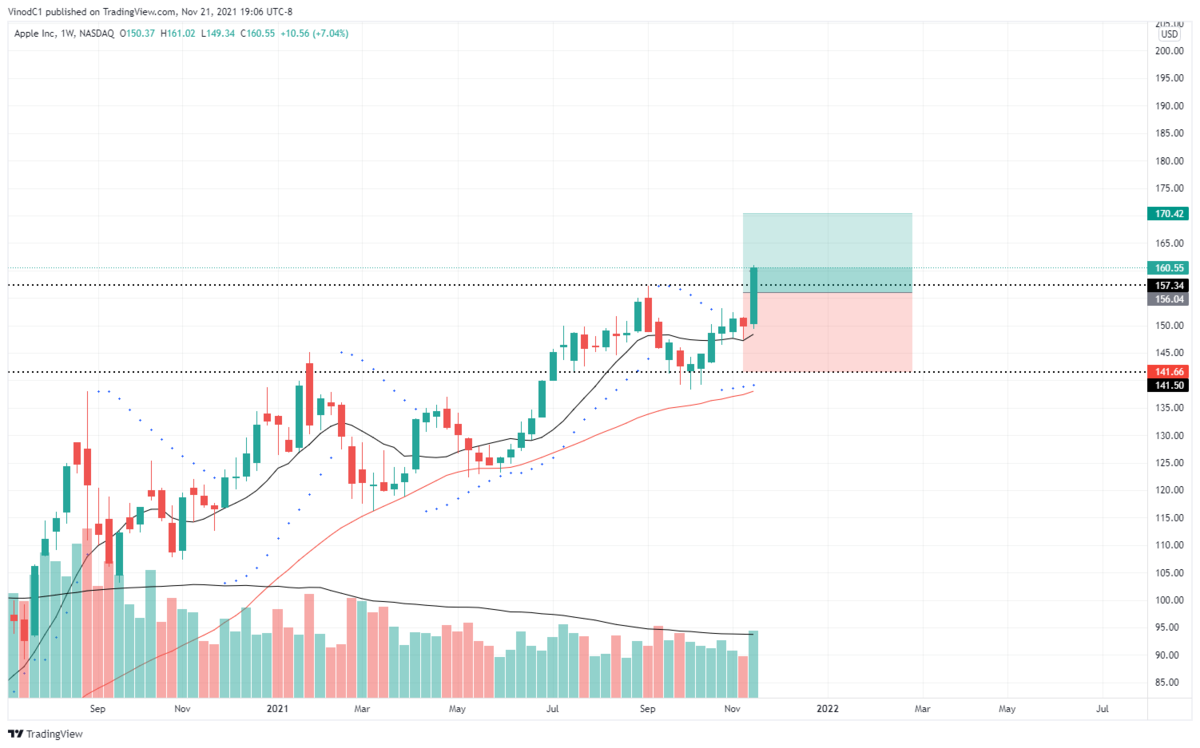
Food for thought: checkout AAPL, IQV, ASML, DKS, HSY, PKI, WELL, LOW, XLK, SPY, QQQ for current chart pattern formations.
Typical Graphical Analysis - Rectangular Base - Before Trade.pdf Typical Graphical Analysis - Rectangular Base - After Trade.pdf
-
Hi Wigetjoel
Welcome to Swing Trading.....little late with my comments but hope this is helpful as well.
If you are interested in swing trading, note that the trading platform is just an interface/application software. Before you use the application, you should have a Trading Plan. In your Trading Plan you would identify what you want to trade, where to get the information, what analysis you need to perform, how and when to place trade orders, and how to manage trades, etc. The application tool should be compatible with your Trade Plan, not the other way around.
There are generally three types of swing trading:
1. Short term - days to weeks
2. Intermediate term - weeks to months
3. Scalp - same day, overnight
Your Trade Plan will identify what type of swing trade you want to do, and this will generally dictate the trading platform to use. Some other things to watch for are:
1. Type of trades will indicate number of trades you will perform and the associated cost/commission
2. Platform maintenance fee
3. Taxation info available from your Platform/Broker
Food for thought: Design your trade. Trade your design. Keep your trade simple. Take responsibility for your trade.
-
Hi Trader Scott
Welcome to Swing Trading.....little late with my comments but hope this is helpful as well.
It seems you have a TD Investment Account. This gives access to three trading platforms: 1. Webbroker 2. TD Advanced Dashboard 3. Thinkorswim.
If you are interested in swing trading, they will all do the job. However, I would not limit my trading to the functions of the platform. The platform is just an interface/application software. Before you use the application, you should have a Trade Plan. In your Trade Plan you would identify what you want to trade, where to get the information, what analysis you need to perform and how and when to place trade orders. The application tool should be compatible with your Trade Plan, not the other way around.
Food for thought: Design your trade. Trade your design. Keep your trade simple. Take responsibility for your trade.
-
There are a number of typical chart patterns. Some common/popular ones:
1. Cup Base Formation
2. Cup Base + Handle Formation
3. Rectangle Base Formation
4. Reversal Base Formation
5. Flat Cup or Saucer Base Formation
Attached is sample graphical analysis of ADBE as of end of day today. +1.9% profit on first breakout, +2% profit today on second breakout. My position sizes were small and with the market being currently choppy, and being end of week both times, decision was to cash out at end of the week. So we see that a lot of times the exit decision is generally at the trader's personal comfort level. The rational behind this type/level of analysis is to enter a trade at your personal comfort level...remember our fear + greed + anger characteristics. So for new traders, it is good to have a mentor per my previous responses in the Forum.
I have three Watchlists:
1. Growth Stock Watchlist: Master updated quarterly. Review each stock daily for prospective Buy Points.
2. Prospective Buy Point Watchlist: Update daily. Review end of each day for potential entry with Buy Stop Order.
3. Position Watchlist: Update daily. Review P&L every day for stocks that I have position in for partial profit exits and final exit.
Coming up: Typical Rectangle Base Formation
Food for thought: checkout AAPL, IQV, ASML, DKS, HSY, PKI, WELL, LOW, XLK, SPY, QQQ for current chart pattern formations.
Typical Graphical Analysis - Cup Base +Handle - Before Trade.pdf
-
1
-
-
Hi there
I am sharing my swing trade routines per attached notes for discussion purposes only. Please feel free to send comments/discussions so our BBT Forum can benefit from same. The attached sample Graphical Analysis is for a cup base chart pattern. The routine is based on information from instructor training, textbooks, Webinars and information available on the internet over last few years. One good point up front is to keep things simple and this seems to be working for me. This is not a detailed Stock Trading Plan but some routines within the plan.
Routine generally consists of:
1. Prepare a Watchlist of stocks with good fundamentals: growth and revenue
2. Fundamental analysis of each stock in the Watchlist
3. Technical Analysis of each stock in the Watchlist: Trend, Trend strength, momentum, comparison to S&P 500 Index
4. Graphical analysis/markup: chart pattern formation, buy point, base top, base bottom, projected target price, projected target time frame, stop loss exit point, partial and final profit exit points
Initially the routine seems time consuming but after time it gets better. Also by having a dedicated watchlist you get the rhythm of each stock, ie you can see your buy point approaching and can start you graphical analysis. and prepare appropriate buy order.
Typical Growth Stock Watchlist.pdf Typical Fundamental Analysis.pdf Typical Chart Setup - Weekly.pdf Typical Stock Comparison to S&P500.pdf Typical Graphical Analysis - Cup Base - Before Trade.pdf Typical Graphical Analysis - Cup Base - After Trade.pdf
-
1
-
-
Hi Alex
How is the world of swing trading going for you. I understand from your first note you are new to swing trading. Welcome to swing trading.
I have attached the weekly and daily charts for HAE for your relevant trade period. I believe you took the trade just around earnings and gap down day earlier this year.
Based on my analysis: fundamentals looked ok for early 2021 but the technicals were not suitable. I believe HAE was not a good candidate for swing trading long around the earnings announcement and pre gap down earlier this year. Analysis was favoring more towards a short trade pre-gap. Charts attached for reference.
Food for thought: require suitable financial/technical/mental/physical/availability capacity, right trading vehicle (Stock, Forex, CFD, Indices, ETFs...), fundamental and technical analysis, entry and exits. For this you need a Trading Plan to be consistent. Above all, as a new swing trader, most important is to have a Mentor. Also keeping in mind, you are a part-timer. This may take a few months to a few years to obtain high probability successful trades.
You may want to check for some good swing trading info on TD Ameritrade Webcasts. I believe as TDA member, you have access to the instructors.
Checkout: TD Ameritrade Webcasts (thinkorswim.com).
I guess getting into a trade is not so hard, but getting out of a good or a bad trade is challenging and that will come only with experience .... it is also an individual thing ..... fear and greed.
Per your enquiry: a good mentor will know what worked for him for stop loss techniques, and may pass this on to you. This will be incorporated in your Trading Plan. I also understand that a stop loss entry is a trade order and it only works during regular market hours per Brian's note earlier. Also, it is good idea to get a good handle on simple swing trading techniques (entry and exits) first before trying out advanced trading with Options.
-
Hi there
Hope your swing trading is working for you.
Some food for thought: To a large extent the principles of day trading, swing trading and investment trading are the same, ie identification of trend, trend strength, momentum, cycle. time frame - fractals; correlation of market, sector and industry activity with the trading vehicle (stocks, ETFs, indices, forex), etc.
End of the day you must have a swing trading plan which will identify your objective, trading vehicles based on fundamental and or technical analysis, strategy, entry and exits, risk management, etc.
Getting handle on specifics takes time and is best done under a mentor.
You might want to check this webcasts by TD Ameritrade to head in a good direction:
TD Ameritrade Webcasts (thinkorswim.com
The webcasts helped me a lot when I started out few years ago.
-
1
-
-
Hi there, were you able to get good lead to start swing trading. When i started out on swing trading, I had good experience in getting lots of good info from TD Ameritrade Webcast...it is for free....no cost. They have regular daily lessons from very experienced instructors...I have attached link below:
TD Ameritrade Webcasts (thinkorswim.com)
Hope this work for you...... its not something you will learn in a day or few months....takes lots of patience, and a good mentor who can help you to prepare a swing trading plan for you.
Your plan will help you to identify suitable type of swing trade: short term - few days or intermediate term - few weeks. Strategy with entry and exit points. Risk management. Trading vehicles and suitable trading platform.
...some food for thought...all the best
-
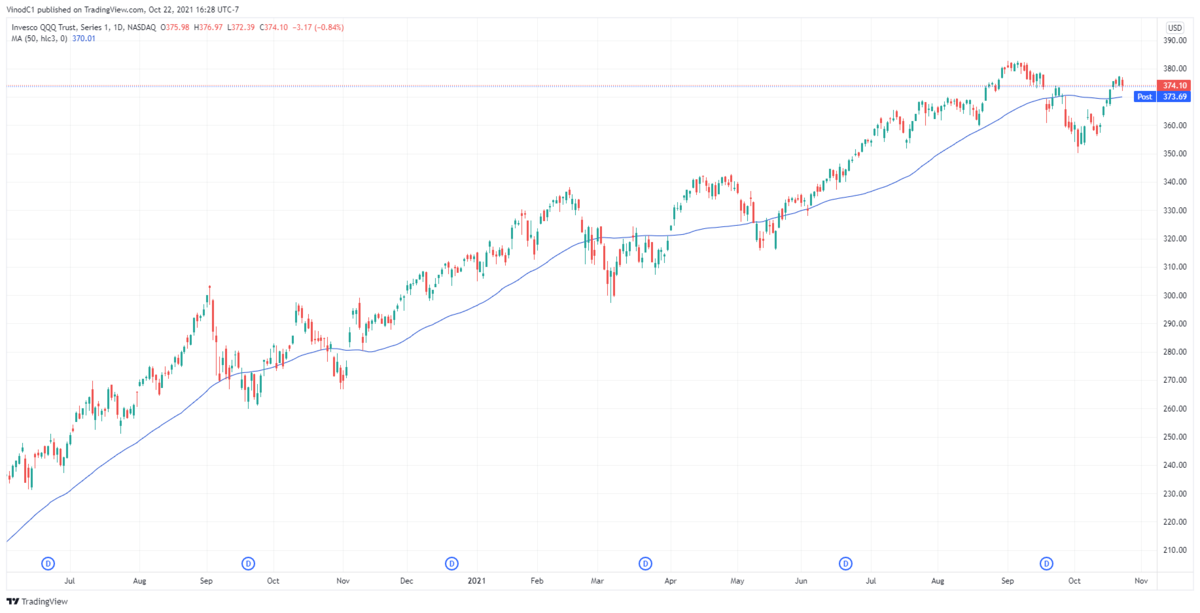
Hi there
I am not sure what you mean by "recalibrated". Daily data is stored for all stocks and ETFs by basically all data service providers. Attached is one year of data for QQQ from Trading View which can be replayed. Hope this helps. Thanks.
-
Hi there
If you are new to swing trading/trading in general, I find good info on YouTube-TD Ameritrade Swing Trade - John McNichol + others from TDA. They also have scanner in TDA - TOS. I also use scanner on Trading View. Hope this is helpful. Numerous ways to keep swing trade lists: ie just trade SPY, QQQ or XL?? ETFs for starters., move on to trending stocks....list grows too big then you might want to have a Growth Stock List of your own trending stocks ....hope this is food for thought.
You can also get great info on TD Ameritrade Webcasts.....they have daily scheduled training lessons ..no cost...:TD Ameritrade Webcasts (thinkorswim.com).
-
Hi, sounds great...let me know meet-up details when available. Thx.
-
 1
1
-
-
Hi something went wrong...I signed up on Robert's list but did not get any update/schedule on the meetup. Thx.
-
Hi Robert
Any update on the Vancouver meet this year. Thanks.
Regards
Vinod
-
Thank you for the analysis Zack.
Regards
Vinod
-
Hi Zack
If you have some time can you please provide comments on attached update on UJ trade analysis from yesterday Thank you.
Regards
Vinod
-
Hi Zack
If time permits, would you be able to review and post comments on attached setup for our team. Thank you.
Regards
Vinod
-
Hi Zack
Further to our discussion and your suggestion, can you please provide a detailed analysis of the attached setup for USDJPY to share with our BBT team. Thank you.
Regards
Vinod
-
Hi Robert, thanks for putting this together. Last Vancouver meet I went to was last summer on a Saturday at Olympic Village at 3 pm. This was on Skytrain route and worked great for me. Look forward to seeing you all again.

.jpg.dadf42e002525ad63c967d5499f15615.jpg)
.png.bb615a08662b04cde8dd1933e80873c2.png)
.jpg.7fffa348927996607664c65acbde5e1e.jpg)
Swing Trade Routine - Update 4D
in Swing Trading
Posted
Here are some examples of prospective breakouts with chart pattern/base formation from the Watchlist I attached earlier.
Please note this is not an investment advice. Please seek investment advise from your own investment advisor. The attachments are for illustration and discussion purpose only on our Forum.