

fab
-
Content Count
20 -
Joined
-
Last visited
-
Days Won
4
Posts posted by fab
-
-
On 7/12/2020 at 8:37 AM, Paulius Kurpis said:Sorry for late reply, was travelling to Italy from UK by car, long trip.
I would say Daily trade history. Weekly, Monthly, Yearly statistics.
And Trade print screens with Daily trade history.
Basicaly what I'm trying to do now is to create Journal with Notion. So I would view and review trades even on the go in mobile app (if will succeed will share with everyone).
And Notion has option to import from .csv . Now I'm still in learning mode of trading, I just started I had DAS Trader for 14-days trial to get familiarised, but I can't download other trial and forgot to do test export of .csv and to see what you can export from DAS directly. Maybe any of you guys could send few trade example exports from DAS? just to see what it already exports?
Your system of journaling @fab is fab! 🙂 I would like to have exact one in Notion as part of all daily notes.
I saw in download section samples of exel macro journaling, but to be honest it's complex to understand what is where and where to put what, and there is no video of andrew explaining how to do journaling (but he says it's very important in his book).
Hi Paul, I was thinking that you needed something like exporting the same data included in the statistics, or the list of selected trades with their data. That would have been feasible with reasonable amount of work...
In order to export other kind of data, that has to be included first in the program. I had the idea to add some basic weekly/monthly statistics (mostly to see which weeks/months were green/red), but didn't have time yet. When I will include that in the program it will be potentially exportable too.
-
On 7/9/2020 at 5:45 PM, Paulius Kurpis said:Hi Fab,
what a great tool you have created! 👏🙏
One question or request?
Is it possible to export as .csv file?
Hi Paul, thanks and welcome!
What kind of data would you like to export to the .csv?
As @Justin said, you can export the database and extract the information it contains, but if you need something more specific, like the statistics or the list of selected trades I can evaluate to add this function to the new release...
-
16 hours ago, Alastair Mowatt said:This always annoy me. But i am OCD. lol
Fab,
Thks for exposure to this ability. I need some help/guidance with this. I have two questions:
1. Need to create a new file everyday instead of "mylist.csv". File name would be WL_YYYYMMDD.csv (i.e. WL_20200419) so I have a history of my lists over time. Can u help with the script to format the file name based on the date ? Would use in the save/export and import function.
2. Add symbol to Mkt Viewer function - currently does not work. Using 7 monitors 7 = 1 + 2 x 3. The single monitor is top left then have 3 over 3. The function seems to look for 4 monitors, does it need to be coded differently for 7 monitors ?
Ur thoughts and guidance would be appreciated .
Hi Alastair, I updated the scripts in the meanwhile, I will attach the new version in the original post.
It includes the possibility to add/remove the date in the file name with a parameter (I also had the necessity to keep the history of my trades 😉), plus a few new functions.
About the market viewer dirty after importing the list, I use the "delete all rows" function before importing the list. I guess that the delete all rows and import scripts can be joined actually, I will give it a try.
I didn't use the add symbol to market viewer key for a long time, I think it can be transformed to a function that takes the actual windows coordinates as parameters, in order to be more flexible. I will try to write the function when I have some free time...
-
I just uploaded a new version of the program.
It includes some new features and some improvements suggested by @Justin:
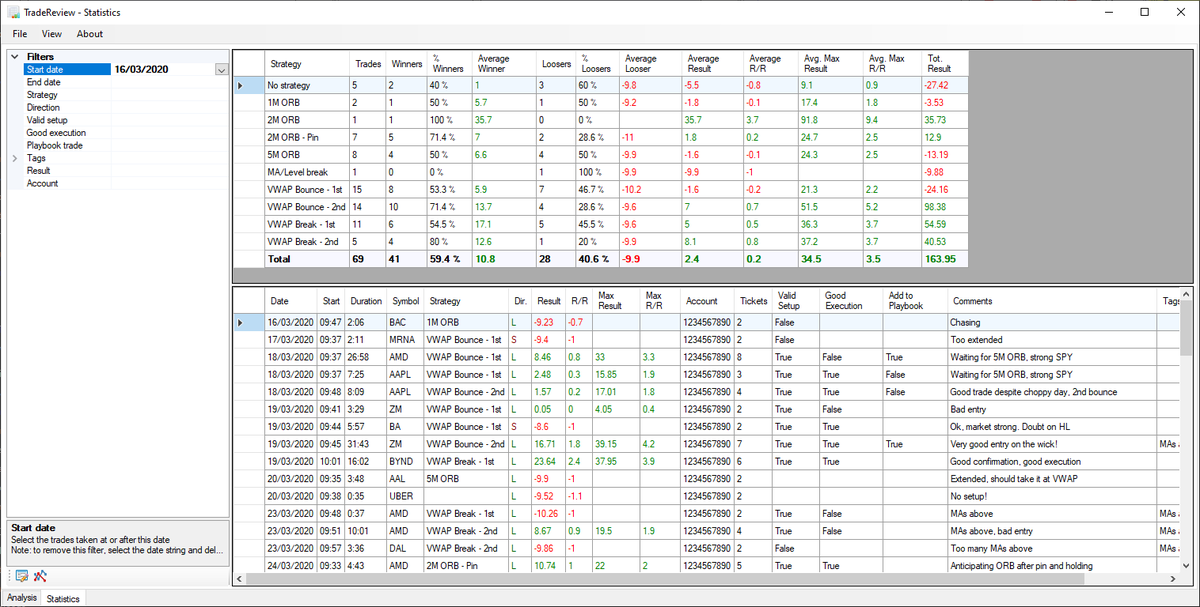
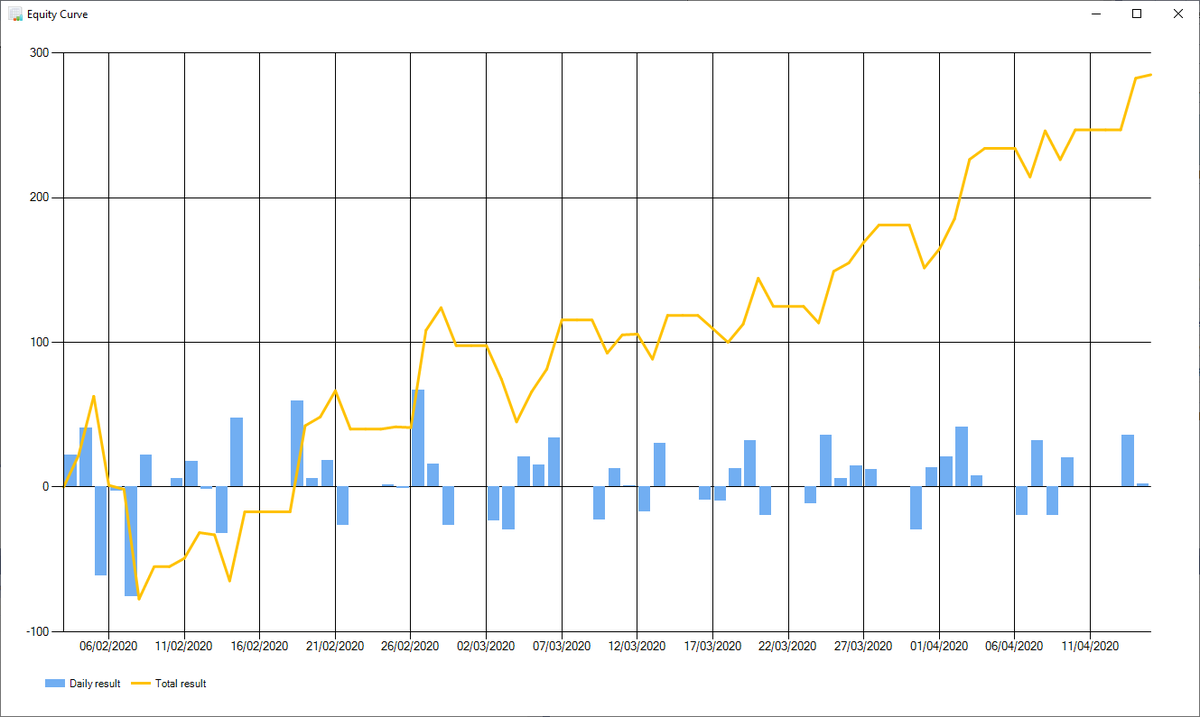
- It is now possible to visualize the equity curve of your trades. The function is accessible from the menu of from the button in the Statistics tabs, and it is synchronized with the statistics (i.e. you can use the filters to show the equity curve based on a subset of your trades)
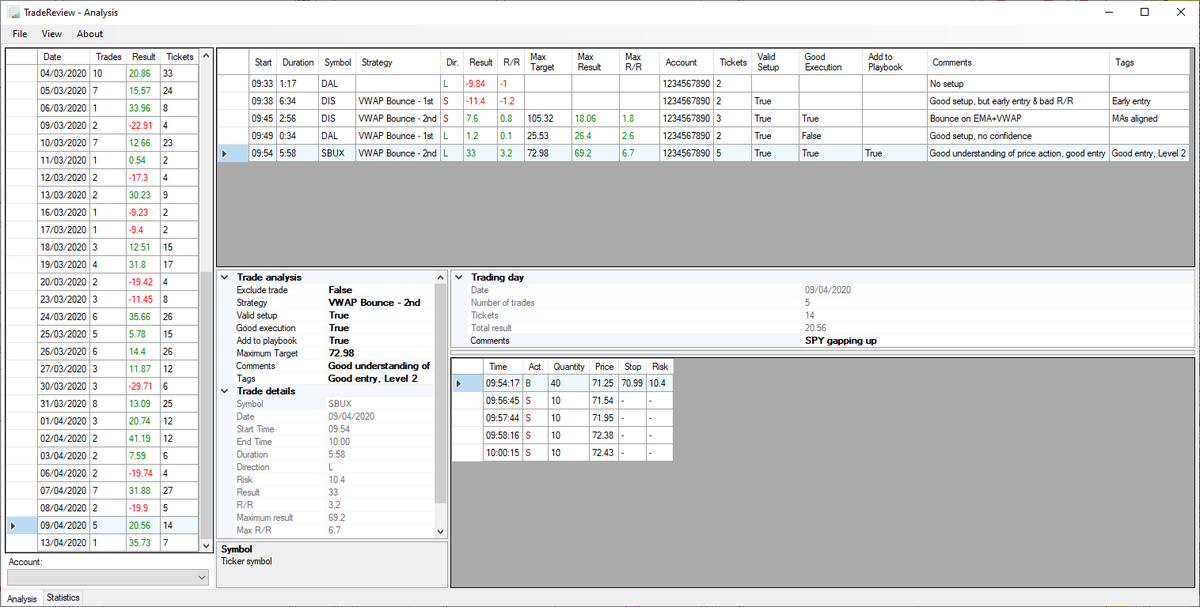
- The Trades and Analysis tabs have been joined because they were redundant. There is a setting to show both the tabs if you prefer
- It is possible to edit the trades directly from the tables in the Analysis tab and Trade details window, by just clicking on the table
- In the Statistics tab, you can now filter your trades also by long/short direction
- You can add some comments to the trading day
- You can import the last screenshot that you took from DAS (if you press the button the program imports from the Screenshots folder of DAS the last file generated)
- In the settings, you can choose more fields to be visualized in the trades tables
- Some bug fixing
-
11 hours ago, Justin said:Hey Fab,
These are great changes! Although I don't see the updated link..? It's still 1.2.0 on the main page. Or maybe I'm missing it somewhere?
Didn't upload the new version yet, still adding the last features and performing some tests. I will update the link today I guess...
-
On 4/7/2020 at 8:09 PM, Justin said:Definitely wouldn't worry about the lagging or scaling issue - really not that big of a problem. And no big deal about the current trade moving to the bottom; also not a real problem.
Saving the screenshot to clipboard is pretty great actually. If you haven't started working on this yet, I'd save your energy 😛
I did find a bug today though... One of my buy orders wasn't recorded, so my P&L is not correct. I've restarted DAS and TradeReview and that didn't help unfortunately. Let me know what I can do to get you what you need to debug the problem. I can send my db file and my correct trade list exported from DAS. I know exactly what trade wasn't recorded so at least you'll know where to start looking.
Hi Justin, I already implemented the function to import the last screenshot from DAS, it was not difficult 🙂
Also joined the Trades and Analysis tabs: you were true, it's much more usable now 😉
I updated the version of the .NET Framework to a newer version, I was using an older one to grant more portability but with the installer the portability is not an issue any more I guess... Maybe that will help with the scaling problem, but I'm not sure.
About the missing trade, the first thought that I have is that the program considers only the closed trades, i.e. when the sum of buy and sell orders is equal to 0: did you hold part of your position overnight, or closed it outside DAS? If not it can be a bug, you can PM me attaching the DAS log file of the day of the trade (you can find/replace the account number with another string for privacy...), and let me know the details of the trade (symbol and times of the orders).
-
On 3/31/2020 at 10:57 PM, Justin said:I think it has to do with in not being compatible with Windows 10 scaling. Because my laptop resolution is 3840 x 2160 but at 225% scale.
I also have a 3840 x 2160 monitor on my laptop, tried to set it to 225% but wasn't able to replicate the issue. About the lagging when changing the tab, especially if you switch to the Statistics tab, it's because the program has to recalculate the strategies etc. that may have changed meanwhile. The grid views are the Microsoft standard ones, maybe there are more some sophisticated controls that are faster but it would require a lot of work to rewrite the code...
On 4/2/2020 at 10:16 PM, Justin said:For the Strategy, Valid Setup, Good Execution and Comments columns, it would be nice if you could edit those fields right where you see the trade, and not have to edit in the Trade Analysis window. (This is my least important request).
I think that I tried that in the past, but there were some sync/handlers problems; I will try to do that in the Trade details to begin, and let you know if it works without problems.
On 4/2/2020 at 10:16 PM, Justin said:It seems like the Trades tab is redundant. The Analysis tab shows all the information that the Trades tab does. For the Trades tab's left section, you could move the Trades, Results and Tickets columns into the Analysis tab's left section. Although that data is also already in the Trading Day section of the Analysis tab. Maybe if this is a difficult change we can have the option to default to the Analysis tab?
Yes, the 1st tab is redundant now, it is there because on the beginning the program was meant to be able to work with only the data retrieved from DAS, without strategies, etc., and also because the grids were larger at the beginning so there was not enough space for all the data in the same tab. But the 1st tab can definitely be removed now, I will work on that.
On 4/2/2020 at 10:16 PM, Justin said:When you select a strategy in the Trade Analysis it auto scrolls so that the selected trade is at the bottom of the window. Can it not scroll and leave the scroll bar where it is?
This is because when you change a field in the trade analysis the table is automatically updated, and it looses the current row selection. Therefore the row has to be selected again, and that causes the current trade to be at the bottom. I'm afraid there's not much to do here...
On 4/2/2020 at 10:16 PM, Justin said:I have a great idea for adding screenshots! If it's not too difficult of course 😛 In DAS there is a screenshot hotkey (ScreenRecorder SelectRegionScreenshot) that adds a screenshot to the default DAS folder under "ScreenShot". Maybe if you're in a Trade Details screen, and you take a screenshot in DAS, TradeReview will detect the new file in the Screenshots folder and automatically add that latest screenshot to the trade you have open in Trade Details! This way, at the end of the day, when I'm adding strategies to my trades and cross referencing them in DAS, I can quickly use the hotkey and have it appear in the Trade Details window.
I never used this hotkey, I'm currently using a hotkey that copies a portion of the screen to the clipboard instead... but I will check it, think that something can be done in this direction.
-
4 hours ago, Justin said:Great update @fab!
Do you find that the window is very laggy to resize and the text is a bit blurry?
I'm wondering if it's because it's not optimized to work on 4k screens?
Because the title bar where it has the icon and "TradeReview - Trades" is perfectly clear, but then anything inside the application window is slightly blurry.
Hi Justin, I didn't experience this issue on my PC, everything appears as in the screenshots...
My integrated laptop screen is 4k and the external monitors are 1080p and the appearance/resizing are ok on all of them, so I don't know if it's related to the resolution. Do you have any other particular settings for your screens? Did it happen also in the previous version?
-
I uploaded to the 1st post an updated version with these new features:
-
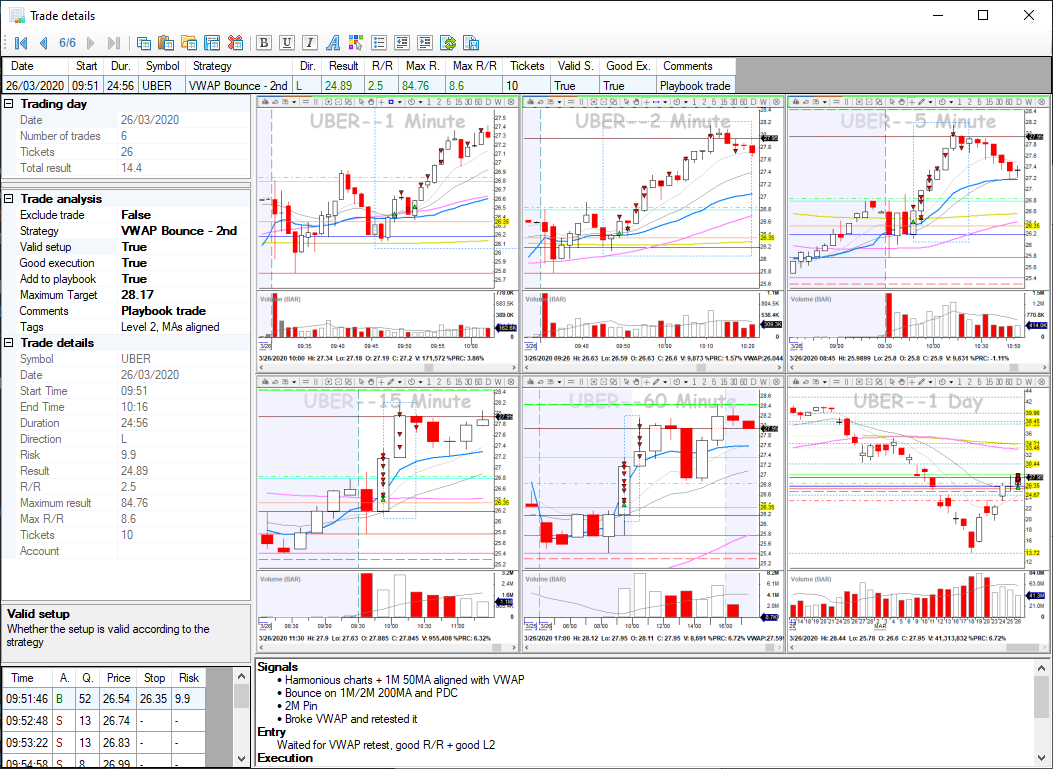
I added a window displaying a detailed view of the trades, that you can open from the menu or by double clicking the tables containing the trading days, the trades and the statistics. Depending on where you click, the list of trades loaded in the trade details is populated accordingly:
- if you click on a trading day/trade in the Trades/Analysis tabs, the list contains the trades taken during the day
- if you click on a strategy in the Statistics tab, the list is populated with the trades associated to that strategy, given the selection filters
- if you click on the selected trades in the Statistics tab, the list contains all the trades selected according to the filters
- You can associate a screenshot to each trade. The screenshot can be pasted from the clipboard or can be imported from a file
- You can add a detailed review of the trade. The trade review consists in formattable text, and a template for the review can be saved in order to use it as default for the new trades.
- I added a few tooltips to highlighting the content of each area of the windows for the new users. You can disable them from Settings->Tooltips.
-
I added a window displaying a detailed view of the trades, that you can open from the menu or by double clicking the tables containing the trading days, the trades and the statistics. Depending on where you click, the list of trades loaded in the trade details is populated accordingly:
-
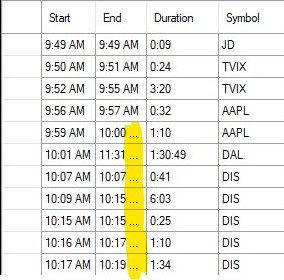
On 3/14/2020 at 1:42 AM, Justin said:That's probably not needed, what I found is probably just a bug then. When I enabled End Time to be visible it cut it off:

But I just realized that after I restarted it it's fine, so all good!
Think that I found the cause of the bug, fixed it in the new version, and also improved the auto-size mechanism, that sometimes was using more space than needed.
I will post the new version as soon as I complete the screenshots attachment feature...
-
On 3/26/2020 at 7:30 AM, jonosg said:Thanks Justin, I tried searching the forums before posting but couldn't find anything. I have not used AutoHotKey for about 15 years, I'd completely forgotten about it. Should be able to cobble something ugly together - programming wise I know enough to be dangerous.
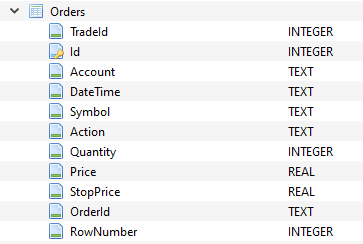
Hi, if the SQLite format is ok for you this application:
reads the DAS logs and saves them in a SQLite DB, which you could use to get the information about the orders and join them with the watchlist info.
In the DB for each order you would find this info:
If you want to integrate this in a script I don't see any problems in making the DB creation available from command line.
-
I uploaded a new version with some new features:
- You can import and export trades data and settings
-
The tool calculates the Risk/Reward of the trades. You can choose between 3 methods to calculate the risk:
- Based on the sum of the risks associated to the S.L. orders in the trade
- Based on the maximum risk associated to the S.L. orders in the trade
- Based on a fixed $ amount
- You can associate tags to the trades, and use them to filter the trades in the statistics
- I made an installer
You can download the new version from the main post.
-
 1
1
-
On 3/14/2020 at 1:42 AM, Justin said:That's probably not needed, what I found is probably just a bug then. When I enabled End Time to be visible it cut it off:
But I just realized that after I restarted it it's fine, so all good!
I wasn't able to replicate the issue, maybe because I have times without AM/PM... Let me know if it happens again on other fields, and I will check.
-
1
-
-
31 minutes ago, Justin said:Fantastic! That did it.
Couple thoughts and questions:
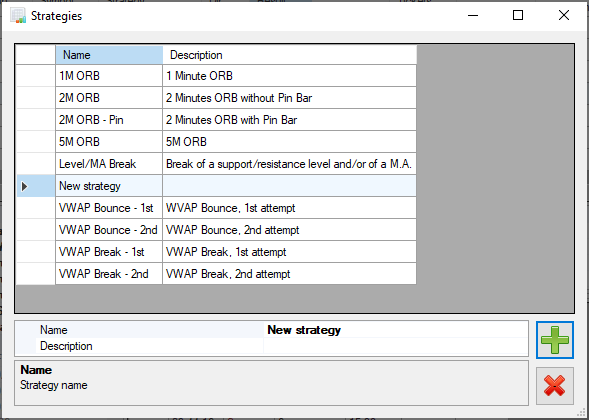
How do you get to the Strategies window you've shown?
I also can't seem to edit the Valid Setup, Good Execution, or Comments fields.
Is it possible to make the columns user expandable? I seem to be able to expand the first row that shows the selection arrow, but none of the others.Anyway, all in all this is an amazing pieces of software.
Separate note:
I also looked at your past post about creating the hotkeys for the Market Viewer - So great! I feel we have similar minds 😄 I'm always looking for ways to automate and make tedious tasks more efficient!
Great! 🙂
To edit the fields you have to select the Analysis tab and then select the fields in the highlighted area. To add strategies just select <Edit strategies> in the Strategy drop-down list (always in the red area).
The columns are set to fit the content, but no problem to add a setting to allow you to resize them in the next release...
PS: glad that you liked my post about hot keys! Yes, I like to automate things too, trading is already complicated in itself so I try to simplify what I can... 😉
-
 1
1
-
-
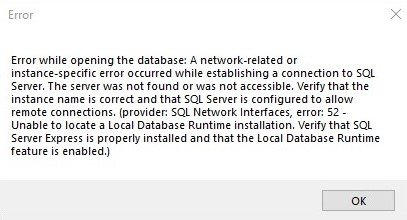
18 hours ago, Justin said:Slightly different error
Made some research and found out that the DB format that I was using was not very portable, so I decided to migrate to another format.
I performed a few tests of the new versions on a Win 7 virtual machine without anything installed on it, and seems to work fine.
Could you give it a try:
https://drive.google.com/uc?export=download&id=1WwcB1lxP8bxAMx7fuMUBP7WRYT-tEJ_6
You can also uninstall the SQL Express Local DB plug-in at this point.
-
1
-
-
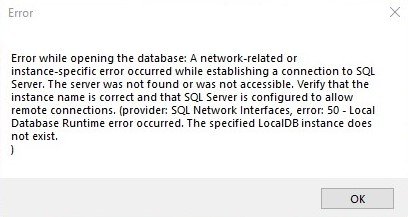
15 minutes ago, Justin said:First, this is absolutely amazing. What a thing to give back to the community! I love that it's super clean and data-centric. Definitely my style of journaling as well!
But unfortunately I can't seem to get it to run fully. It brings me to the settings screen on first open, creates the TradeReview.config file, then closing that screen (which I assume you need to do to have the main application run), will then pop this error below:
Trying to run the software again will show the same error.
Hi Justin, seems that you need SQL Express Local DB plug-in installed to open the DB, I didn't consider that... 🤔
Can you try to install it from here:
- 64 bit system: http://download.microsoft.com/download/8/D/D/8DD7BDBA-CEF7-4D8E-8C16-D9F69527F909/ENU/x64/SqlLocalDB.MSI
- 32 bit system: http://download.microsoft.com/download/8/D/D/8DD7BDBA-CEF7-4D8E-8C16-D9F69527F909/ENU/x86/SqlLocaLDB.MSI
and let me know if it works?
-
I made a small application to review my trades and make some statistics about the results of each strategy. I wrote it because I needed some tools to speed up my journaling and to help me reviewing my trades and didn’t find something out there that was exactly personalizable for my style of trading and my way of journaling...
Thought that sharing it with you guys would be a way to give back some of the great help that I received from this community!
Features
The application imports automatically from the DAS logs your trades and displays:
- The results for each trade and trading day
- All the entries and exits
- If you use hard stops based on trigger orders, the risk of the order/trade
- The risk/reward of the trade, based on the S.L. orders or on a fixed $ amount
You can create trading strategies and associate to each trade additional information:
- The strategy used
- Whether the setup was valid or not according to the strategy, and if your execution of the strategy was good
- The theoretical maximum target that could be reached -> based on that the app calculates the maximum result of the trade if you closed your whole position at the max target
- If the trade is a “playbook trade”, i.e. if you want to add it to the list of your “ideal” trades for this particular strategy
- You can associate custom tags to the trade
- You can choose to exclude the trade from the calculations of the daily results and of the statistics
- You can attach a screenshot from the clipboard, or import it from a file
- You can add quick comments as well as a detailed review of the trade
Based on that, the tool calculates some statistics:
- Number of trades and global result of the trades in each strategy
- Number of winners/loosers, percent winners/loosers and average winner/looser in the strategy
- Average result and average max result of the trades in the strategy
- Average risk/reward and max risk/reward of the trades in the strategy
You can filter the trades for which you want the statistics:
- Start date/end date
- Time of day
- Strategy
- Direction (long/short)
- Whether the setup is valid, and whether the execution was good
- You can select the playbook trades only
- You can filter the trades by tags
- You can select only the winner or the looser trades
- You can filter by trading account
You can visualise the equity curve of your trades:
- You can filter the trades used to calculate the equity curve
- The equity curve is synchronized with the statistics
Screenshots
Download
Setup:
Download and run the installer inside the zip. Once installed, just select the DAS Trader directory and the application will automatically start loading your trades.
If you already installed a previous version of the program, the installer will automatically import all your data. In any case you can transfer/backup your data through the Import/Export functions from the File menu.
Download link:
New in 1.3.0:
- Equity curve visualization, synchronized with the filters of the Statistics tab
- Possibility to edit the trade details directly from the table + added context menu for trade exclusion/details
- Joined the Trades and Analysis tabs (can be reverted through settings)
- Possibility to filter the trades also by long/short direction
- Possibility to add some brief comments about the trading day
- Possibility to import the last DAS screenshot
- Possibility to visualize more fields in the trades tables
- Bug fixing
New in 1.3.1:
- Possibility to filter the trades by time of day
- Trades executed in replay mode are discarded
- Bug fixing
-
1
-
6
-
If someone is interested, I wrote a few AutoHotkey commands to add new rows and perform other actions in the Market Viewer through hotkeys.
In the attached file you can find hotkey scripts to:
- Delete the selected row (ALT+D)
- Delete all the rows (SHIFT+ALT+D)
- Add a new row (ALT+N)
- Export the current list to a file (ALT+E)
- Import the previously exported list (ALT+I)
The last two commands are useful to copy the content of a Market Viewer window to another Market Viewer window
Additionally, there is a command to add the current symbol selected in the Montage window to the Market Viewer. However, the script is written to work only if the Market Viewer window is the only one located in the same screen of the Montage window. If you need the script can be adapted to insert the symbol in a specific Market Viewer (follow the instructions in the script).
To use the script, change the extension of the file to .ahk and launch it with AutoHotkey (https://www.autohotkey.com/)
EDIT: Updated with a new version, including some new functions:
- Possibility to add the date to the exported files (IncludeDateMVList parameter at the beginning of the file)
- Some functions to calculate the profit targets based on multiples of your predefined risk
- A function to drag a symbol from the Market Viewer list to a chart (useful if you don't want to use a montage window for each chart)
- A function to toggle between standard and bigger Montage window height (to display wider market depth when needed)
-
3
-
2

Trade Review – Tool for automatic import of trades from DAS, analysis and statistics
in Day Trading Hardware, Software and Tools
Posted
Hi Paul!
I share a couple of example log files from DAS, that can be used as an input for TradeReview. You just have to save them in a folder named "Log" and set the "DAS Folder" in the tool to the parent directory of the Log folder.
200707Log.txt 200708Log.txt